Voltammetric Detection of Diquat at the Carbon Paste Electrode Containing a Ca10(PO4)6(OH)2
Moulay Abderrahim EL MHAMMEDI1, Mina BAKASSE2, Abdelilah CHTAINI*1
1Equipe d’Electrochimie et des Matériaux Inorganiques, Université Cadi Ayyad, Faculté des Sciences et Techniques, BP. 523, de Beni-Mellal, Maroc. *Corresponding author
2Equipe d’Analyse des Micro-Polluants Organiques, Faculté des Sciences, Université Chouaib Doukkali, BP. 20, El jadida, Maroc.
amhammedi@yahoo.fr, mbakasse@caramail.com, chtainia@yahoo.fr
Abstract
We report a sensitive electrochemical voltammetric method for analyzing diquat (DQ) ions using a carbon paste electrochemical (CPE) modified by porous material, such as hydroxyapatite (HAP). Diquat strongly adsorbed on a HAP-CPE surface and provides facile electrochemical quantitative methods for electroactive DQ ions. Operational parameters have been optimized, and the stripping voltammetric performance has been studied using square wave voltammetry. The peaks current intensity are highly linear over the 7×10⁻⁷–3×10⁻⁴ mol L-1 diquat range examined (10-min accumulation time), with a good sensitivity. These findings can lead to a widespread use of electrochemical sensors to detect DQ contaminates.
Scanning electron microscopy was used for morphology observation and in particular the X-ray diffraction analysis (XRD) and Fourier transformed infrared spectroscopy (FTIR) analysis for characterization of synthesis powder.
Keywords
Diquat, Carbon paste, Square wave voltammetry, Hydroxyapatite
Introduction
The apatites form a large family of inorganic compounds, with the main formula M10 (XO4)6Y2 (M = Ca, Sr . . ., / X = P, Si, V . . . and Y = F, Cl, OH. . .). Apatites are the major constituent of the mineral part of bone and dental enamel, and an important compound in solid-state chemistry [1, 2]. They are the starting material of phosphate fertilizer, and have many industrial applications [3-7]. Hydroxyapatite (HAP) Ca10(PO4)6(OH)2 is the main constituent of the apatitic family; its crystallize in the hexagonal group P63/m . Their physical-chemical properties give them a high adsorption power and a strong catalytic activity, so it may be use as catalysts [8-12] or gas detectors. Apatites have been widely investigated because of their various applications in several domains such as agronomy (fertilizer), medicine (bone and teeth prosthesis), gemology and technology phosphors and laser materials [13-16]. It is well known that the reactivity of apatite is correlated to their structure (existence of channels), chemical composition (substitution in the cationic and anionic sites) [9], and surface properties [17-20]. One characteristic of the apatites is the capacity to establish a chemical bond with various organic compounds such as oxalic acid, porphylin, glycine, carbohydrate polymers, etc. [21-25].
During the past five years we have studied the use of phosphate compounds [26] to promote organic transformation [27] and to have shown that its mild basic and acidic proprieties can be exploited in many synthetic applications [28]. In our work, we were interested to valorize this ceramic in the domain of modified electrodes destined for organic compounds determination such as herbicides. Besides a wide number of analytical methods, based on the most commonly employed physico-chemical techniques for the identification of organic compounds (UV, IR, HPLC, GC, MS or various combinations of these) [29-33], is available to detect and determine pesticides quantitatively in different matrices; nevertheless, none of the above mentioned techniques is effectively used ‘‘on the spot’’ to monitor the levels of pesticides in risk areas continuously: in this direction, the use of alternative analytical methods, such as those based on chemical sensors.
Diquat has been extensively used as herbicides in olive crops. Its toxic to algae, fish, and other aquatic organisms such as crayfish and insects [34] acute oral LD50 (rats) for diquat (400mg/Kg) is relatively low [35]. The adverse health effect of acute and chronic exposure to humans is well documented [36]. Diquat produces lung damage although it is not concentrated. However diquat had severe toxic effects on the central nervous system. The cationic character of diquat makes their determination difficult. Capillary electrophoresis (CE) [37, 38] and ion-pair high-performance liquid chromatography (HPLC) using UV detection [22] are the methods of choice for ion species, although the use of selective electrodes [23] has also reported. Different techniques of mass spectrometry coupled to either capillary electrophoresis [24, 25] or HPLC [26, 27] have been described for determination of diquat. The aim of this work was to use the synthesis hydroxyapatite to modify the carbon paste electrode. We investigate the electrochemical behavior of diquat attached on HAP-CPE surfaces on cyclic voltammetry and square wave voltametry.
Experimental procedures
Powder preparation
Hydroxyapatite powder was precipitated in an aqueous medium by slow addition, at a rate of 10 ml/min, of calcium nitrate Ca (NO3)2,4H2O solution into a boiling diammonium phosphate solution containing NH4OH [26]. The pH of the mixture was about 10, and was maintained at this level throughout the reaction with a pH stat by addition of 3 vol% ammonia solution. After total addition of the reactants the suspension was filtered and calcined at 900°C about 3h.
The chemical composition of the ceramic was also investigated by Fourier transform infrared spectroscopy. The powder was ground together with KBr in an agate mortar and compressed to tablets. Transmission IR spectra were recorded under nitrogen atmosphere from 4000 to 400 cm-1 with a resolution of 4 cm-1. Hydroxyapatite powder served as a reference and was heated to 900°C for 3h prior to use. Fourier transformed infrared spectroscopy (FTIR) analysis (PERKIN-ELMER FTIR) was performed in order to determine hydroxyapatite stoechiometry deviations, in particular the PO43- and/or OH- groups. After grinding the material in an agate mortar the chemical composition of the ceramic was investigated by X-ray diffraction analysis (XRD: Cu Ka radiation, XPERT) to evaluate the purity of the synthesized hydroxyapatite powder. The Ca/P ratio was calculated from the calcium and phosphorus content In order to evaluate Ca/P ratio of the powder using inductively coupled plasma–atomic emission spectrometry (ICP-AES) analysis.
Electrode preparation
The electrode was prepared by mixing a pure graphite powder and a synthesis hydroxyapatite described above. The mixture was grinding in a mortar. The mixture paste was packed into working electrode. The geometric surface area of the working electrode was 0.1256 cm2. The electrolytic solution K2SO4 (0.1M) was deoxygenated with nitrogen during experiment at ambient temperature.
Apparatus and electrochemical procedures
Voltammetric measurements were made using a potentiostat PGSTAT 100 driven by the General Purpose Electrochemical Systems data processing software (voltalab master 4 software). The auxiliary electrode was platinum, the reference electrode a saturated calomel electrode (SCE). The working electrode consisted of an HAP-CPE with a drop area of 0.1256 cm2. The pH measurements were carried out with a pH meter. The parameters for the SWV were: step potential 25mV; amplitude 5 mV and duration 5 sec at scan rate 1mV s-1. All experiments were performed at 25°C. Test solutions for voltammetric experiments were prepared in 20 ml volumetric flasks containing a suitable amount of diquat solution, 0.1M potassium sulphate. All solutions were added deionised water to a final volume of 20 ml and transferred to the electrochemical cell. Before the voltammetric scan, the solutions were stirred and de-aerated by bubbling nitrogen gas (purity 99.95%) at flow rate of 50 ml min−1 for 5 min. Current-potential curves from -0.2 to -1.2V (versus SCE) in the square wave voltammetry mode were recorded and the scanning (CV) was performed in a negative direction at a rate of 50 mV s−1 with a step potential of 2 mV and duration step 0.02 sec.
Results and Discussions
Characterization of the prepared powder
To obtain more information of the phases and other components of the synthesis ceramic it was investigated by Fourier transform infrared spectroscopy. FT-IR spectra displayed in Fig. 1 confirm also the formation of hydroxyapatite apatite powders with the observed fundamental vibrational modes of PO43- group at 475, 574, 609, 966 and in particular.
Figure 1. X-ray diffraction pattern for the prepared powders calcined at 900°C
The bands at 3571-3572 cm-1 and at 631-632 cm-1 derived from stretching and librational modes of OH groups in Ca10(PO4)6OH2 [39]. The XRD patterns of the as-prepared powders are presented in Fig.2. All the powders have indicated the formation of an apatite phase. The SEM pictures (see Fig. 3) gave insight into the ceramic structure with respect to porosity, pore structure, pore- and crystal size and their variations. Calcium, phosphorus concentration and Ca/P ratio results of the synthesized powders are shown in Table1.
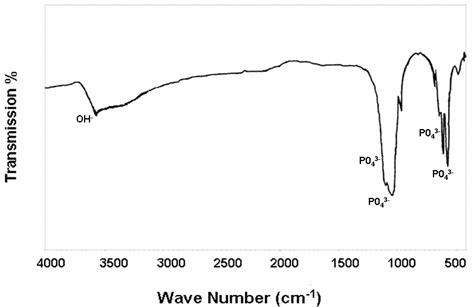
Figure 2. FT-IR spectra of the apatite heated at 900°C for 3h
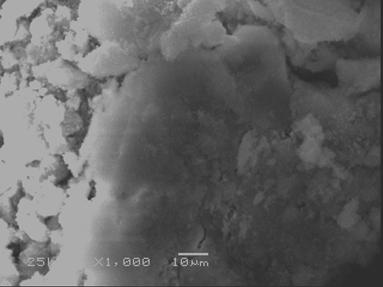
Figure 3. SEM images of synthesis apatite.
Table 1. Chemical composition (ICP-AES) of apatite calcined for 3 h at 900°C
|
Elem |
Ca |
P |
Ca/P |
|
Wt % |
35.115 |
16.171 |
1.678 |
Electrochemical behaviors on HAP-CPE
The cyclic voltammogram (CV) of diquat, recorded with chemically modified carbon paste electrode in 0.1M K2SO4 between -0.3 V and -1.2 V for 75 % modified carbon paste electrode with Hydroxyapatite phosphocalcic at 50 mV s-1, obtained after exposure to 2×10⁻⁴ mol L-1 solution of diquat for 10 min in potassium sulphate solution is shown in Fig. 4.Two pair reversible peaks at scan rate 50mV.s-1can be observed at the HAP-CP electrode (P1, P4) and (P2,P3) at a potential E1 = - 0.75 V and E2 = - 1.0 V (versus SCE) respectively in the pH range from 3.0 to12.0 associated to the redox couple (Eqs. 1 and 2).Besides the redox reaction occurred at HAP-CPE is much more distinguishable due a properties of HAP to capture the diquat ions.
|
DQ 2+ + e- ↔ DQ+ |
(1) |
|
DQ+ + e- ↔ DQ0 |
(2) |
Figure 4. Cyclic voltammogram for 2×10⁻⁴ mol L-1 of diquat in 0.1 mol L-1 K2SO4, pH 7.0, the HAP-CPE at scan rate 50 mVs-1 and 10 min of preconcentration time
As it has been pointed out in Figure 5, we demonstrate that the diquat has been shown to exhibit improved voltammetry response at carbon paste electrode modified by HAP when compared with conventional CP. Modification of CPE with Hydroxyapatite allowed the subsequent bond of HAP by following an extremely simple procedure consisting of immersion of HAP-CPE in diquat solutions. This led us to develop a methodology for the determination of diquat in real samples.
Figure 5. Square wave voltammetry for 2×10⁻⁴ mol L-1 of diquat in 0.1 mol L-1 K2SO4 at HAP-CPE with pH 8.2, step potential 25 mV, amplitude 5mV and duration 5sec at scan rate 1mV s-1,after preconcentration time of 10 min at (a) HAP-CPE and (b) CPE
The square voltammetry (SWV) experiments yielded the same reduction and oxidation processes described in Eqs. (1) and (2). Here peak 1 was observed at -0.71 V and peak 2 at -1.0 V versus SCE, which is in close agreement with values obtained in cyclic voltammetric experiments.
Effect of HAP laoding
The accumulation of DQ at HAP-CPE was based on the adsorption reaction between the herbicide ion and the modifier. Therefore the concentration of HAP in the carbon paste had significant influence on the voltammetric responses on the modified carbon paste electrode. The peaks currents increased with increasing the ratio of HAP/CP to give maxima at 75% by weight (w/w) after this percentage the peaks current decreased with the increase of the HAP amount (Fig. 6). This was attributed to the reduction of conductive area at the electrode surface.
Figure 6. Effect of HAP loading on the reduction peaks intensity on SWV of 2×10⁻⁴ mol L-1 diquat (same conditions as for Fig.5)
Influence of accumulation time
The influence of preconcentration time was examined in 9×10⁻⁶ mol L-1 diquat (Fig. 7). The reduction peaks intensity increased when the preconcentration times ranged from 2 to 40 min. for larger times the peaks was progressively broader and the peaks became less than expected from initial linear relation. In this concentration equilibrium seemed too reached after 10 min. However, after a specific accumulation period, the peak current tented to level off; illustrating that adsorptive equilibrium was achieved.
Figure 7. Influence of preconcentration time on the peaks currents on SWV of 9×10⁻⁶ mol L-1 of diquat (same condition as for Fig. 5)
Effect of pH
A study of the influence of pH on the peak current Ip in square wave voltammetry was made in the pH range 2-12 at a diquat concentration of 2×10⁻⁴ mol L-1 (see Fig.8).
Figure 8. Effect of pH on the reduction peaks on SWV of 2×10⁻⁴ mol L-1 of diquat ions (same conditions as for Fig. 5)
Diquat exhibits only a single voltammetric peak (P1) at potential -0.75 V versus SCE in the pH ranges pH < 3.0 probably due to reduction of electrolytic media. However, in the pH range 3.0–12 two voltammetric peaks are observed. In this case the potential of the observed peaks at HAP-CPE does not shift with increasing pH, suggesting the absence of any protonation step in the reduction mechanism indicated by Eqs. (1) and (2).
Calibration graph
Figure 9 shows the dependence of peaks intensity of DQ concentration on SWV at HAP-CPE under the optimum experimental conditions resumed in Table 2. The electrode response was tested for DQ solutions ranging from 7×10⁻⁷ to 3×10⁻⁴ mol L-1. The linear response with this concentration was achieved and the regression straight line has the following equation: I1(µA) = 0.1462 [DQ](mol L-1) + 8.4691 and I2(µA) = 0.079 [DQ](mol L-1) + 3.0378 with the correlation coefficient of 0.9927 and 0.9890 of peaks P1 and P2 respectively.
Figure 9. Influence of diquat concentration on the peak intensity
(same conditions as for Fig. 5)
Table 2. Optimized parameters for diquat determination using the carbon paste electrode modified with hydroxyapatite in square wave voltammetry
|
Parameter |
Optimized value |
|
Electrode composition |
75% modified hydroxyapatite and 25% of graphite powder |
|
Supporting electrolyte |
0.1M potassium sulphate |
|
pH |
8.2 |
|
Pre-concentration time |
10 min |
|
Scan rate |
1 mV/s |
|
Pulse amplitude |
5 mV/s |
Conclusion
The present results obtained with hydroxyapatite modified carbon paste electrode seem at first sight one more common evidence of this conclusion. The excellent properties of this material can contribute to the accumulation of the product onto electrode surfaces. It was demonstrated that the rather simple procedure using HAP-CPE allowed a rapid determination of DQ in dilute solution down 7×10⁻⁷ mol L-1. More important is that the square wave voltammetry opens new opportunities for analyzing diquat ions.
References
[1] Andresen V., Deut Zahn aerztl Wochenschr, 30(8), 1927, p. 5-8.
[2] Haoki H., Kato K., Seramikkus, 10(7), 1975, p. 469-478.
[3] Slanski T., Memoire du B.R.G.M. Geologie des phosphates se´dimentaires, 1980.
[4] Trombe J. C., Montel G., C R Acad Sci Paris t.278 ser. C, 1974, p. 1227.
[5] Montel G., Bonel G., Trombe J.C., Heughebaert J.C., Rey C., First Int on Phosphate Compound Rabat, 1977.
[6] Lang J., Bull Soc Sci Bretagne, 53, 1987, p. 95.
[7] Jarcho M. J., Bolen C. H., Thomas M. B., Bobick J., Kay J. F., Doremus R. H., J Mater Sci 11(11), 1967, p. 2027-2035.
[8] Yamaguchi K., Mori K., Mizugaki T., Ebitani K., Kaneda K., J. Am. Chem. Soc. 122, 2000, p. 7144-7145.
[9] Mori K., Yamaguchi K., Mizugaki T., Ebitani K., Kaneda K., Chem. Commun., 2001, p. 461-462.
[10] Mori K., Yamaguchi K., Hara T., Mizugaki T., Ebitani K., Kaneda K., J. Am. Chem. Soc., 124, 2002, p. 11572-11573.
[11] Mori K., Tano M., Mizugaki T., Ebitani K., Kaneda K., New J. Chem., 26, 2002, 1536-1538.
[12] Rey C., l’Actualite´ Chimique, Societe Française de Chimie, Paris, France, 1995, p. 41- 45.
[13] DeLoach L. D., Payne S. A., Smith L. K., Kway W. L., Krupke W. F., J. Opt. Soc.Am. B, 11(2), 1994, p. 269.
[14] Boulon G., Rev. Phys. Appl., 21, 1986, p. 689.
[15] El Ouenzerfi R., Panczer G., Goutaudier C., Cohen-Adad M. T., Boulon G., Ayedi M. T., Ariguib N. K., J. Opt. Mater., 16(1-2), 2001, p. 301.
[16] Benmoussa H., Mikou M., Lacout J. L., Mater. Res. Bull., 34(9), 1999, p. 1429-1434.
[17] Owada H., Yamashita K., Umegaki T., Kanazawa T., Solid State Ionics, 35, 1989, p. 401.
[18] Nadir S., Ph.D. thesis, University Mohammed V, Rabat, 1986.
[19] Rhlalou T., Ph.D. thesis, University Mohammed V, Rabat, 1991.
[20] Lacout J. L., Ph.D. thesis, INPT, Toulouse, 1983.
[21] Rey C., Trombe J. C., Montel G., Bull. Group Int. Rech. Sci. Stromat. Odont., 20, 1977, p. 5-16.
[22] Ince D. E., Johnson C. T., Modgil B. M., Langmuir, 7, 1991, p. 1453.
[23] Peckauskas R. A., Pullman I., Biopolymers, 16, 1977, p. 199.
[24] Pautard F. G. E., Coll International sur la Physicochimie et la Cristallographie des Apatites d’intérêt Biologique, 1973, p. 93.
[25] Rey C., Trombe J. C., Montel G., J. Inorg. Nucl. Chem., 40, 1978, p. 27-31.
[26] El Mhammedi M. A., Achak M., EL Kahlaoui M., Chtaini1 A., ITE Letters Batteries, New Technologies & Medicine, 6(3), 2005.
[27] El Mhammedi M. A., Chtaini A., El Bouadili A., ITE Letters on Batteries, New Technologies & Medicine, 6(1), 2005.
[28] Lazrek H. B., Rochdi A., Kabbaj Y., Taourirte M., Sebti S., Synth. Commun., 29, 1999, p. 1057.
[29] Barceló D., Environmental Analysis: TechniquesApplications and Quality Assurance, vol. 13, 1993.
[30] Adou K., Bontoyan W. R., Sweeney P. J., J. Agric. Food Chem., 49, 2001, p. 4153.
[31] Cappiello A., Famiglini G., Palma P., Mangani F., Anal. Chem., 74, 2002, p. 3547.
[32] Lacassie E., Dreyfuss M. F., Gaulier J. M., Marquet P., Daguet J. L., Lachatre G., J. Chromatogr. B Biomed. Sci. Appl., 759, 2001, p. 109.
[33] Thier H. P., Zeumer H. (Eds.), DFG Manual of Pesticide Residue Analysis, VCH, Weinheim, Germany, 1987.
[34] Stevens J. T., Sumner D. D., Jr., Eds. Academic Press, New York, NY, 1991.
[35] Lott. P. F. at all, J. Chromatogr. Sci., 16, 1978, p. 390-395.
[36] Braitwaite R. A., Human Toxicol., 6, 1987, p. 83-86.
[37] Yuen S. H., Babness J. E., Myles. D., Analyst, 92, 1997, p. 375.
[38] Shivhare P., Gupta V. K., Analyst, 116, 1991, p. 391.
[39] Fowler B. O., Inorg. Chem., 13(1), 1974, p. 194-207.