Evaluation of Leakage Current Measurement for Site Pollution Severity Assessment
Seyyed Mohammad Hossein Nabavi, Ahmad Gholami, Ahad Kazemi,
Mohammad Ali Shercat Masoum
Department of Electrical Engineering Iran University of Science and Technology
Tehran, Iran
H_nabavi@ee.iust.ac.ir, Gholami@iust.ac.ir, Kazemi@iust.ac.ir, M_masoum@iust.ac.ir
Abstract
Flashover of insulators in transmission and distribution systems may cause costly outages for power companies and their customers. Industrial and/or coastal pollution of external insulation is a major cause for such events at the normal power frequency voltage of the systems. The power companies are now facing increasing competition resulting in pressure to lower the cost and to increase the system reliability. Different methods have been applied in the past to overcome or reduce the problems with flashover on insulators. Methods which should provide reliable data under real physical conditions. In this paper several measuring methods to evaluate the pollution levels on outdoor insulators are described. According to this comparison, Leakage Current Measurement ‘LCM’ method is a reliable method for measurement leakage current in outdoor insulators and surge arresters.
Keywords
Reliability, Leakage Current Measurement, Site Pollution Severity, Flashover
Introduction
Flashover of high voltage insulators results in the reduction of reliability of power systems and irretrievable losses to the power networks. The possibility of flashover in contaminated environments depends on the type of pollution and duration of the time that an insulator is placed in a polluted environment. The occurrence of pollution-born flashover on insulator surface generally consists of the following stages [1, 13]:
· Settling of pollutants on the insulator surface
· Compounding soluble pollutants with rainwater and formation of a conductive layer
· Formation of leakage current
· Insulator surface’s getting hot and formation of a dry area
· Partial discharge and the occurrence of flashover.
Therefore, inappropriateness of insulation designing will be resulted, flashover and consequently in system outages. Hence, identifying different factors causing insulation surface pollution and dealing with their unfavorable effects have an important role in increasing the reliability of the network [1, 13, 15, 17, 21]. The major consequence of pollution is the reduction of insulation in high-voltage transmission lines and substations. During recent years, many studies have been carried out to improve methods of pollution measurement, including IEC815, IEC507, IEC383, IEC1106, ANSI C290, DE0441, VDE0218, and ASTMD2302. For this purpose, the relationship between Equivalent Salt Deposit Density ESDD/ Non-soluble Salt Deposit Density NSDD and LCM in high-voltage insulators have been studied [1, 6, 11]. The performance of spiral-shaped insulators and their electric resistance against pollutants is rather weak [20]. In a study carried out on pollution measurement, analysis of performance of ceramic insulators under polluted (estimation) circumstances is based on ESDD and LCM [12]. The relationship and the confirmation coefficient between flashover voltage and leakage current have been analyzed in [10]. Preparing the pollution map affecting insulation based on the values obtained from pollution measurement with ESDD and Directional Dust Deposit Gauges (DDG) can also prove useful in designing insulator of high voltage substations and transmission lines [13]. Among other issues related to the methods of insulation pollution measurements are the relationship between ESDD and resistance of high voltage insulator’s surfaces [2, 8, 9] and estimation of Salt Deposit Density (SDD) content in terms of leakage current peak [3]. In this paper, the LCM method to find site pollution severity affecting insulation has been explained and its capabilities have been compared with those of other common techniques. In the second part, the significance of pollution measurement is studied and then, in part three, common methods of pollution measurement are spelled out. Identifying pollution severity based on leakage current measurement and comparing it with other methods are presented in parts four and five, respectively.
Significance of Measuring Sites Pollution Affecting Insulation
High voltage insulators are used to separate different voltage levels. Gradually, sites pollution settles on the insulator surface and an electrolyte layer forms on it under the influence of environment and weather conditions such as moisture and rainfall [22, 23]. This layer extends over time and in some cases, such as in the case of inappropriate insulation designing, leads to flashover and system outage. Thus, identification of the factors causing insulation surface pollution, pollution severity measurement, and tackling its unfavorable effects has an important role in increasing the network reliability. The role of these is highly remarkable particularly in environments with high site pollution. According to the statistics already available, about 70% of high voltage transmission lines errors result from the inappropriate performance of insulation. The major consequence of pollution in these areas is the reduction of insulation in high voltage transmission lines and substations [1, 15, 17]. Identifying site pollution severity affecting insulation in these areas is crucial not only for sound designing of insulation of high voltage lines and substations but also for selecting insulation type and the suitable program for the maintenance of insulation (preventive practices such as washing and using special covers). Various methods to identify site pollution severity have already been proposed, each facing technical and procedural limitations.
Proposed Methods to Measure Pollution
Weather changes and environmental pollution have direct influences on the performance of insulations. The type of pollutants and the duration of time the insulator is exposed to pollution are among other parameters affecting system insulation. Various methods are applied to identify the content and type of pollutants. These methods are described below:
A. ESDD Method
By definition, the density of equivalent salt deposit density (ESDD) equals an amount of sodium chloride which, solved in water, will change water’s conductivity to the level equal to that resulting from the solution of polluted deposits gathered from insulator surface divided by the insulator’s surface area (mg/cm2) [1]. This method is generally used for calculating average pollution based on average density of soluble salt. Pollution measuring station of an insulator chain in this method consists of seven disk insulators as in figure 1 [13] (The number of insulators, of course, may vary between five and twelve).
Figure 1 Pollution gathering station in ESDD method [13]
These insulators do not contain
electricity and are used to gather pollution under site conditions. The dirt on
the surface of insulators is washed up according to the schedule in figure 1. Pollution
index and ESDD can be calculated according to the parameters of conductivity
index of water, water temperature, and the volume. Equation 1 illustrates
pollution in 20°C. Conductivity (![]() ) is measured by conductivity measurement
probe in the temperature t.
) is measured by conductivity measurement
probe in the temperature t.
|
σ20 = σt[1-0.02277(t-20)e0.01956(t-20)] |
(1) |
where:
σt = inductivity index measured (μS/Cm)
t = temperature of solution (°C)
σ20 =: revised conductivity index for 20°C
Equation 2 works out solution hardness (Sa) in 20°C
Equation 3 works out equivalent salt deposit density (ESDD) in terms of mg/cm2
|
Sa = (5.7 σ20)1.03 |
(2) |
|
ESDD = Sa · V/A |
(3) |
where:
V = volume of distilled water
A = area of washed surface of insulator
The shortcomings with this method are as follows:
· It is costly
· It requires a lot of time to do the experiment and it is impossible to measure maximum pollution
· The measures pollution index is low compared with its real value after rainfall and natural washing of the insulator
· There is the possibility of human-made errors
· The effect of electricity-containing of the insulator in absorbing pollution is not considered
· Such special conditions as momentary pollution (conductive fog) and pollution stemming from metallic particles in industrial environments cannot be monitored.
In this method, insulators 1 and 7 are installed only to support other insulators, and pollution is not removed from them.
B. NSDD/ESDD Method
This method is the developed form of ESDD method, in which non-soluble pollution content in available samples is measured. This content finally is normalized according to the insulator area and its unit is mg/cm2.
C. DDG Method
This method was first chosen by research institute of Electricity Supply Commission (Eskom) in 1974 to examine insulator pollution. As shown in figure 2, DDG includes four vertical split pipes and a pot below each pipe to gather pollution. The pipes are placed along the four geographical directions, north, south, east, and west. To facilitate international comparison of the results, the size of DDG cracks must be the same in all places to be tested [12, 13, 15]. DDG pollution index, according to equation (4), is the average of the four conductivities (μS/cm) obtained from the four directions for a 30-day month in 500 cc normalized washing water.
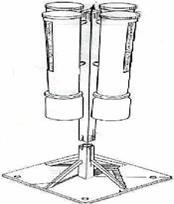
Figure 2. Pollution gathering machine in DDG method
Normalized conductivity and average conductivity are worked out from the equations (4) and (5), respectively. [13]:
|
σN = C(V/500)(30/N) |
(4) |
|
Average conductivity = (σN + σS + σE + σw)/4 |
(5) |
where:
σN, σS, σE, σw = normalized conductivity indexes in north, east, west, and south (μS/cm)
C = conductivity (μS/cm)
V = volume of distilled water (ml)
N = number of days when the insulator has been under investigation
DDG method, in large scale, has the following advantages over other techniques:
· DDG does not need any feeding resource or energy resource
· DDG is cheap and allows for extensive measurements along a transmission line
· Calculations can be done easily and are repeatable
· There is no need for the existence of an insulator in doing DDG tests
· It is equivalent to ESDD
· It identifies the direction that produces the most pollution
· It requires no maintenance other than cleaning after the tests
· It is not influenced by rainfall
The only shortcoming with DDG is the inaccessibility of insulator’s self-filtering features and the effect of insulator profile in dirt settling on the insulator surface. This method faces limitations in high-rain areas, where the primary conductivity index of the rain water in the container is not known. Therefore, a higher index may be acceptable. However, in areas with little rain but excessive fog, the actual pollution severity is larger than that of indicated by DDG. Another point is that the DDG machine must be installed somewhere away from trees or any other barriers influencing natural airflow. Studies done already reveal that the results from both ESDD and DDG are equal if the site weather conditions are also considered. Thus, they can be considered equivalent in terms of the practical results. Table 1 illustrates site pollution severity obtained from DDG and ESDD. [13] Figure 3 shows correlation coefficient and ESDD variations of correlation coefficient in terms of DDG. It shows a direct relationship between these two methods.
Table 1. DDG and ESDD Indices [13]
|
Pollution severity |
DDG |
|
ESDD |
|
Monthly average |
Monthly maximum |
Monthly maximum |
|
|
μS/cm |
mg/cm2 |
||
|
Light |
0-75 |
0-175 |
0.06> |
|
Average |
76-200 |
176-500 |
0.06 - 0.12 |
|
Heavy |
201-350 |
501-850 |
> 0.12-0.24 |
|
Very Heavy |
350 < |
850 < |
> 0.24 |
Figure 3. Correlation and variation graph of ESDD in terms of DDG
Identifying Sites Pollution Severity Based on Measuring Leakage Current
To identify exact site pollution index, the tests must be carried out in real conditions of insulation location. Since it is extremely difficult to provide a natural environment to measure the real value of pollution and since measurement must be done in absolutely real conditions, using an online method seems necessary. In this method, the leakage current of the insulator under nominal voltage is the basis for defining pollution index [6, 11, 16, 18, 19]. Defining pollution severity based on a leakage current measurement is the optimal solution for these problems. It is described below.
A. Leakage Current Measurement System
The general systematic structure of leakage current measurement machine is illustrated in figure 4. A collar-shaped ring is placed in the end of the insulator near to the earth. The leakage current sensor is placed between the insulator and the ring to create a closed-loop current. The sensor, which has a high performance speed, work based on Hall’s effect current transformer [15]. The leakage current made on the insulator surface passes through the sensor and flows toward the earth. Figure 5 illustrates the sensor performance based on Hall’s effect and magnetic fields. Sensor’s input impedance is of a very small value. Sensor’s output it directly connected to the central unit of the formation recording, as in figure 6. This unit consists of the analog - to - digital (A/D) converter and a microprocessor to gather information, which records leakage current indexes in all the insulators being tested. All the adopted and saved information can be transferred through RS232 port serial or modem [4, 5, 15]. For sufficient information, the sampling frequency related to the A/D converter is usually selected for 20 kHz. The central unit is also responsible for recording the phase voltage magnitude to the earth and line current for each of the phases [14].
Since the weather conditions like humidity and temperature have an essential role in creating leakage current, it is necessary for the measurement system to be equipped with sensors of temperature and humidity and wind velocity gauges. The output of the sensors also is connected to the central unit of information recording and is saved.
Figure 4. General systematic structure and measuring equipment of leakage current
Figure 5. Sensor’s performance based on Hall’s effect
Figure 6. Central unit of information recording
B. Analysis of Leakage Current Results
Studies show that it is possible to monitor the current and voltage online in LCM method [3, 8, 14, 15]. So the relation between them can be shown through figure 7 and 8 [15]. It is observed in this figure that the relation between the leakage current and the voltage of insulator’s two ends is non-linear [15]. Maximum leakage current, however, occurs when voltage is also maximum. The current gradually increases during the first quarter of voltage curve period, and then the leakage current highly increases in a critical point. But during the second quarter, variations of leakage current curve remain sinusoidal and follow voltage variation with a less linear gradient. The current is zero in voltage zero point and this process recurs in the negative cycle too.
Since ESDD/ NSDD are common methods of measurement and since site pollution severity in related standards is defined on the basis of the parameter of this method, the relationship between these two methods and LCM method must be determined [1, 3, 6, 7, 8, 9]. Figure 9 illustrates the correlation coefficient and variation graphs of LCM in terms of ESDD for several types of insulators [1]. It shows an almost linear relationship between these methods. The graph of flashover voltage variations in terms of ESDD leakage current index are shown in figures 10 and 11, respectively. Both are of the same exponential form and much similar [12].
Figure 7. Leakage current and voltage of insulators two ends
Figure 8. Leakage current variations in terms of voltage of insulator’s two ends [15]
C. Characteristics of Leakage Current Measurement Method
Monitoring pollution using leakage current measurement is generally carried out for the following reasons:
· Defining site pollution coefficient to properly design insulation of high-voltage substations and lines
· Measuring pollutions severity to specify polluted areas and to prepare pollution maps
· On-line monitoring of pollution to specify insulators washing time and to create flashover
· Comparing performance and behavior of different insulators (in view of shape and length) and the quality of insulator materials under the same polluted environment.
Figure 9. Comparing ESDD variations in terms of LCM in different insulators
|
Figure 10. Flashover voltage variations in terms of ESDD
Figure 11. Flashover voltage variations in terms of leakage current
Regarding to the trend of flashover [13,15,18], it is observed that polluting soluble material is combined with air moisture or rain water and forms an electrolyte layer of the insulator surface. In common measuring methods like ESDD/ NSDD or DDG, the index obtained from the content of polluting soluble material is the only basis for defining site pollution severity and designing insulation. Factors like moisture or rainfall content are not considered although they have a major role in lowering insulation level in polluted areas. Therefore, these methods can not be highly efficient in polluted areas with high average moisture contents. Records of exploitation in coastal areas of southern Iran approve the fact that insulation level in polluted and very wet areas is lower than that of in equally polluted but dry areas. Insulation problems are more serious in such areas. Since flashover incidence is directly attributed to leakage current magnitude (or to the average content within a few seconds), common methods cannot submit precise information about insulator performance and leakage current created. Therefore, for the purpose of raising power system reliability, it is crucial to use a method free of the mentioned problems but capable of measurement in particular states. In leakage current method, the effects of all the factors involved in insulation, such as polluting soluble and non-soluble materials, moisture absorbed by the insulator, and other environmental conditions are taken into account [18]. This method is applicable in all environmental conditions like in conductive fog and for all pollutants, including industrial and metallic ones. In summary, advantages of LCM method include:
· On-line analysis of insulator behavior in the polluted environment
· Possibility of measuring maximum and minimum indices of pollution
· Lack of results being influenced by rainfall
· Studying the effect of insulator profile in the process of the settling of deposit on the insulator surface
· Precise measuring of the pollution content in conditions where common methods like ESDD/ NSDD or DDG are not applicable because of the existence of conductive fog
· Testing under nominal voltage
· Possibility of testing without removing electricity from the power system
· Testing in real conditions of exploitation
· Decrease in the effect of physical and human errors during the test
· Lack of necessity to attend test site to gather information (possibility of remote controlling)
· Lack of need for complicated calculations and possibility of repetition
· Possibility of preparing exact pollution map and optimal designing of insulation of high-voltage transmission lines and substations
· Access to momentary profile of voltage and current
· Applicability for measuring leakage current of surge arrester
· Machine’s being equipped with sensors of moisture, temperature, and wind velocity
· Easiness of comparing results internationally
· Applicability for environments with industrial pollutants like metallic particles.
Conclusions
Defining site pollution severity affecting insulation through common methods such as ESDD/ NSDD or DDG, though easy to apply, encounters limitations in some instances. The results of the studies reveal that in addition to factors measured in these methods, like ESDD index, other factors, including weather conditions, especially moisture, greatly decrease insulation level in polluted areas. These factors are not considered in common methods. Furthermore, these methods are not capable of measuring pollution in such conditions as conductive fog or non-soluble conductive pollutants like metallic particles. Specifying site pollution index using leakage current method allows identify pollution severity in natural conditions, i.e. conditions where insulators are actually exploited. This method raises the system reliability by indicating exact pollution content. According to the studies already done, this system is equipped with sensors of moisture, temperature, and wind velocity as well as sensors of current and voltage. LCM method allows to prepare the exact pollution maps and optimal designing of insulator of transmission lines and substations. In addition, the information required to access insulator self-refining features and estimate insulation duration can be obtain from LCM method.
The cost necessary for using LCM potentials is insignificant considering its advantages and preventing flashover and its consequent risks. Regarding to these advantages and limitations of commons methods like ESDD/NSDD and DDG in coastal areas of southern Iran, this method can prove useful for designing insulation of high-voltage transmission lines and substations in these areas, where pollution and unfavorable environmental conditions like high moisture exist.
Reference
[1] Montoya G., Ramirez I., Montoya J. I., Correlation Among ESDD, NSDD and Leakage Current in Distribution insulators, Generation, Transmission and Distribution, IEE Proceedings, 151(3), 2004, p. 334 - 340.
[2] Fierro-Chavez J. L., Ramirez-Vazquez Z., Montoya-Tena G., on-Line Leakage Current Monitoring of 400Kv insulator Strings in Polluted Areas, Generation, Transmission and Distribution, IEE Proceedings, 143(6), 1996, p. 560 - 564
[3] Kanashiro A. G., Burani G. F., Leakage Current Monitoring of insulators Exposed To Marine and industrial Pollution Electrical insulation, Conference Record of the 1996 IEEE international Symposium on Volume 1, 16-19 June 1996, p. 271 - 274.
[4] Ziyu Zhao, Hengkun Xie, Zongren Peng, A Newly Developed Leakage Current Monitoring System for the Assessment of Insulator Pollution Severity, Electrical insulating Materials; international Symposium, 17-20 Sept. 1995, p. 319 - 322.
[5] Sugawara N., Hokari K., Leakage Resistance Data Acquisition System For Porcelain insulators Along the Coast, Properties and Applications of Dielectric Materials, Proceedings of the 4th international Conference on Volume 2, 3-8 July 1994, p. 503 - 506.
[6] Guan Zhicheng, Cui Guoshun, A Study on the Leakage Current Along the Surface of Polluted insulator"; Properties and Applications of Dielectric Materials, Proceedings of the 4th international Conference on Volume 2, 3-8 July 1994, p. 495 - 498.
[7] Schwardt W. H., Holtzhausen J. P., Vosloo W. L., A Comparison Between Measured Leakage Current and Surface Conductivity During Salt Fog Tests [Power Line insulator Applications], 7th Africon Conference in Africa, Volume 1, 2004, p. 597 - 600.
[8] Matsuo H., Fujishima T., Yamashita T., Hatase K., Relation Between Leakage Impedance and Equivalent Salt Deposit Density on An insulator Under A Saltwater Spray, IEEE Transactions on Electrical Insulation; 6(1), 1999, p. 117 - 121.
[9] Salam M. A., Aamer K., Hamdan A., Hamdan N., Study the Relationship between the Resistance and ESDD of A Contaminated insulator A Laboratory Approach, Properties and Applications of Dielectric Materials, Proceedings of the 7th International Conference on Volume 3, 1-5 June 2003, p. 1032 - 1034.
[10] Kaidanov F., Munteanu R., Investigations of Leakage Currents Along Polluted and Wetted insulators and their Correlation With Flashover Voltages, Electrical and Electronics Engineers in Israel, Eighteenth Convention of 7-8 March, 1995.
[11] Tjokrodiponto W., Sebo S. A., Sakich J. D., Tiebin Zhao, Leakage Current Magnitudes and Wave shapes Along Polymer insulators, Electrical insulation and Dielectric Phenomena, IEEE 1997 Annual Report, Conference on Volume 2, 19-22 Oct. 1997; p. 390 - 393.
[12] Ramirez-Vazquez I., Fierro-Chavez J. L., Criteria For the Diagnostic of Polluted Ceramic insulators Based on the Leakage Current Monitoring Technique, Electrical insulation and Dielectric Phenomena, Annual Report Conference on Volume 2, 17-20 Oct. 1999, p.715 - 716.
[13] Pietersen D., Holtzhausen J. P., Vosloo W. L., An investigation into the Methodology To Develop An insulator Pollution Severity Application Map For South Africa, 7th Africon Conference in Africa Volume 2, 2004, p. 697 - 703.
[14] Insulator Pollution Monitor, Diagnostic Monitoring Systems and Services; 1999.
[15] Halassinakis E., Aragiannopoulos C. G., Measurements and interpretations Concerning Leakage Currents on Polluted High Voltage insulators, Institute of Physics Publishing Measurement Science and Technology, Meas. Sci. Technol. 14, 2003, p. 421 - 426.
[16] Surge Arrester Monitor Experience from Condition Monitoring of Metal Oxide Surge Arresters in Service, Diagnostic Monitoring Systems and Services; 1999.
[17] Abdelaziz E. O., Javoronkov M., Abdelaziz C., Fethi G., Zohra B., Prevention of the interruptions Due To the Phenomena of the Electric insulators Pollution, Control, Communications and Signal Processing, First international Symposium on 2004; p. 493 - 497.
[18] Lee C. J., Field Experience and Pollution Monitoring of Composite Long Rod insulators, Reliability of Transmission and Distribution Equipment, Second International Conference on the 29-31 March, 1995, p. 204 - 209.
[19] Leakage Current Measuring Arrangement, Software & Hardware Manual, Furukawa Electric Institute of Technology, Budapest, Hungary, 1997.
[20] Boudissa R., Djafri S., Haddad A., Belaicha R., Bearsch R., Effect of insulator Shape on Surface Discharges and Flashover Under Polluted Conditions, Dielectrics and Electrical Insulation, IEEE Transactions, 12(3), 2005, p. 429 - 437.
[21] Vosloo W. L., Holtzhausen J. P., The Electric Field of Polluted Insulators, Africon Conference in Africa, IEEE Africon, 6th Volume 2, 2-4 Oct. 2002, p. 599 - 602.
[22] Vosloo W. L., Holtzhausen J. P., The Effect of thermal Characteristics of Power Line insulators on Pollution Performance, Africon Conference in Africa, IEEE Africon, 6th Volume 2, 2-4 Oct. 2002, p. 609 - 612.
[23] Farzaneh-Dehkordi J., Zhang J., Farzaneh M., Experimental Study and Mathematical Modeling of Flashover on EHV insulators Covered With Ice, 61st Eastern Snow Conference Portland, Maine, USA, 2004.