Detection of Weak Spots in Benchmarks Memory Space by using PCA and CA
Abdul Kareem PARCHUR*, Fazal NOORBASHA and Ram Asaray SINGH
Department of Physics and Electronics, Dr. H. S. Gour University, Sagar, India-470003
*E-mail: kareemskpa@hotmail.com
(* Corresponding author: +91-9907048098)
Abstract
This paper describes the weak spots in SPEC CPU INT 2006 Benchmarks memory space by using Principal Component Analysis and Cluster Analysis. We used recently published SPEC CPU INT 2006 Benchmark scores of AMD Opteron 2000+ and AMD Opteron 8000+ series processors. The four most significant PCs, which are retained for 72.6% of the variance, PC2, PC3, and PC4 covers 26.5%, 2.9%, 0.91% and 0.019% variance respectively. The dendrogram is useful to identify the similarities and dissimilarities between the benchmarks in workload space. These results and analysis can be used by performance engineers, scientists and developers to better understand the benchmark behavior in workload space and to design a Benchmark Suite that covers the complete workload space.
Keywords
SPEC CPU INT 2006, Principal Component Analysis (PCA), Cluster Analysis (CA), Performance.
Introduction
AMD Opteron 2000+ and AMD Opteron 8000+ Series Processors are the members of a new family of seventh-generation AMD processors designed to meet the computation-intensive requirements of cutting-edge software applications running on high-performance desktop systems, workstations, and servers with most advanced x86-64 architecture. The technology innovation for the x86 architecture drives today's personal computers. It incorporates the most new microarchitectural features including a more than 200MHz system bus, a high-performance cache architecture and enhanced 3DNow!™ technology. 3DNow! technology is a set of 21 new instructions designed to open the traditional processing bottlenecks for floating-point-intensive and multimedia applications. The 3DNow! technology enables faster frame rates on high resolution scenes, better physical modeling of real-world environments, sharper and more detailed 3D imaging, smoother video playback, and near theater quality audio. Future AMD processors designed to operate at a frequencies grater than of 3GHz, should provide even high performance implementations of 3DNow! technology [1].
AMD Athlon processors are manufactured on AMD’s robust 0.18-micron aluminum process technology and on AMD’s leading-edge HiP6L 0.18-micron process technology featuring copper interconnects. The approximately 37-million-transistor new AMD Athlon processor has a die size of 120 mm2 on 0.18-micron technology [2]. Computer architectural complexity is growing so dramatically, the performance becomes an important approach to take full advantage of hardware’s computational potential [3]. The CMOS scaling leading to ever increasing level of transistor integration on a chip, designers of high performance embedded processors have ample area available to increase processor resources in order to improve performance [4].
The SPEC CPU2006 benchmark suite contains several programs from different application areas such as Physics, Artificial intelligence and Combinatorial Optimization etc. The recently released SPEC CPU2006 benchmark suite is expected to be used by computer designers and computer architecture researchers for pre-silicon early design analysis [5]. Accuracy of the processor performance depends on the selected benchmarks in simulation study. The selected benchmarks should cover the vide spectrum of the application area. Increase in benchmarks program accelerates the simulation time, at the same time improper selection of the benchmarks may not accurately determines the performance of the processor Increasing size of the benchmarks makes detailed simulation an extremely time consuming process[6].
In this paper we have detected the hotspots in benchmarks memory space by using AMD Opteron 2000+ and AMD Opteron 8000+ series processors SPEC CPU INT 2006 performance scores, PCA and CA techniques. The similarities and dissimilarities between the benchmarks have been identified.
Scope of This Study
Building a high-performance microprocessor presents many reliability challenges. Today we are moving towards the nanotechnology era and also from 32-bit processor environment to 64-bit processor environment. The analysis of our study examines the weak spots in different series of AMD processors (AMD Opteron 2000+ and AMD Opteron 8000+ Series) which are fabricated for the requirement of the modern generation utility. This study is helpful to build complete benchmark suite which covers the entire spectrum of the application area and to predict the performance of the processor more accurately. We previously reported the performance prediction of the processors and evaluated scalability of the Memory Wait Time which degraded the performance of the processor by using a simple statistical correlation technique [7]. This analysis is more useful to performance engineers, scientists and developers to better understand benchmark behavior in workload space, and the scalability of the performance in modern generation commercial processors.
Benchmarks
Benchmarks are used for the performance evolution of the processors. The SPEC, HINT, and TPC are most important and popular benchmarks are available for performance evolution. SPEC is a nonprofit corporation formed to establish, maintain, and endorse a standardized set of benchmarks. SPEC’s membership includes computer hardware and software vendors, leading universities, and research facilities worldwide. SPEC CPU2006 is designed to provide a comparative measure of compute-intensive performance across a range of hardware. Comprised of two suites of benchmarks, SPEC CPU2006 gauges compute-intensive integer performance with CINT2006 and measures floating-point performance with CFP2006. CINT2006 and CFP2006 results are presented as ratios, which are calculated using a reference time determined by SPEC and the runtime of the benchmark higher scores indicate better performance [8].
Table 1. The CINT 2006 Suite Benchmarks
|
S. No |
Integer Benchmark |
Language |
Description |
|
1 |
400.perlbench |
C++ |
PERL Programming Language |
|
2 |
401.bzip2 |
C |
Data Compression |
|
3 |
403.gcc |
C |
C Language Optimizing Compiler |
|
4 |
429.mcf |
C |
Combinatorial Optimization |
|
5 |
445.gobmk |
C |
Artificial Intelligence : Game Playing |
|
6 |
456.hmmer |
C |
Search a Gene Sequence Database |
|
7 |
458.sjeng |
C |
Artificial Intelligence : Chess |
|
8 |
462.libquantum |
C |
Physics / Quantum Computing |
|
9 |
464.h264ref |
C |
Video Compression |
|
10 |
471.omnetpp |
C++ |
Discrete Event Simulation |
|
11 |
473.astar |
C++ |
Path – Finding Algorithm |
|
12 |
483.xalancbmk |
C++ |
XSLT Processor |
Table 2. The CFP2006 Suite Benchmarks
|
S. No |
Floating Point Benchmark |
Language |
Description |
|
1 |
410.bwaves |
Fortran – 77 |
Computational Fluid Dynamics |
|
2 |
416.gamess |
Fortran |
Quantum Chemical Computations |
|
3 |
433.milc |
C |
Physics / Quantum Chromo Dynamics |
|
4 |
434.zeusmp |
Fortran – 77 |
Physics / Magneto Hydro Dynamics |
|
5 |
435.gromacs |
C/Fortran |
Chemistry / Molecular Dynamics |
|
6 |
436.cactusADM |
C / Fortran-90 |
Physics / General Relativity |
|
7 |
437.leslie3d |
Fortran – 90 |
Computational Fluid Dynamics |
|
8 |
444.namd |
C++ |
Scientific, Structural Biology, Classical Molecular Dynamics Simulation. |
|
9 |
447.dealII |
C++ |
Solution of Partial Differential Equations using the Adaptive Finite Element Method. |
|
10 |
450.soplex |
C++ |
Simplex Linear Programming Solver |
|
11 |
453.povray |
C++ |
Computer Visualization / Ray Tracing |
|
12 |
454.calculix |
C/Fortran-90 |
Structural Mechanics |
|
13 |
459.GemsFDTD |
Fortran-90 |
Computational Electromagnetic |
|
14 |
465.tonto |
Fortran-95 |
Quantum Crystallography |
|
15 |
470.lbm |
C |
Computational Fluid Dynamics |
|
16 |
481.wrf |
C/Fortran – 90 |
Weather Processing |
|
17 |
482.sphinx3 |
C |
Speech Recognition |
The SPEC CPU2006 suite contains 18 floating-point programs (Some programs are written in C and some in FORTRAN) and 13 integer programs (8 written in C, 4 in C++ and 1 in ANSI C). Table.1 and Table 2 provides a list of the benchmarks in SPEC CPU2006 suite. The SPEC CPU2006 benchmarks replace the SPEC89, SPEC92, SPEC95 and SPEC CPU 2000 benchmarks [8, 9, 10].
Methodology
In this study we use the integer benchmarks from the newly released SPEC CPU2006 suite for the detection of weak spots in this analysis. Benchmark scores for AMD Opteron 2000+ series processors and AMD Opteron 8000+ series are obtained under the same operating conditions. We reported the performance scaling in AMD Opteron 2000+ series processors and AMD Opteron 8000+ series Processors [7]. Principal Component analysis and Cluster Analysis is used to identify the weak spots in workload memory space and to find the similarities and dissimilarities between different benchmarks in workload memory space. We used commercial statistical software called STATISTICA v.7.0 [11] for evaluating PCA and CA.
Results and Discussion
Using the Benchmark scores of AMD Opteron 2000+ series processors and AMD Opteron 8000+ series processors we obtained four most significant principal components, the first principal component (PC1) covers 79.6%, PC2 (26.5%), PC3 (0.91%) and PC4 (0.019%) of variance respectively. Among all PCs the first two principal components gives important information about benchmark behavior. The eigenvalues scree plot of all principal components, (PC1-PC4) is shown in Figure 1.
Figure 2, shows the benchmarks behavior in PC1 and PC2 memory space. Among all the benchmarks 462.libquantum shows high deviation in memory space. The benchmarks 403.gcc (C Language Optimizing Compiler) and 471.omnetpp (Discrete Event Simulation) are overlapped at top of the memory space by showing high variance, the benchmarks 400.perlbench (PERL Programming Language) and 464.h264ref (Video Compression) and the benchmark 445.gobmk (Artificial Intelligence : Game Playing) and 483.xalancbmk (XSLT Processor) are overlapped at the bottom of the memory space, these benchmarks can only increase the simulation time without providing an extra information. These weak spot in the memory space was represented by gray shapes in memory space of PC1 vs. PC2. These weak spots identification provides the information to build a complete benchmark suite that covers a complete workload space.
Figure 1. Eigenvalues scree plot of all principal components, which explain the variance in the workload (PC1-PC4)
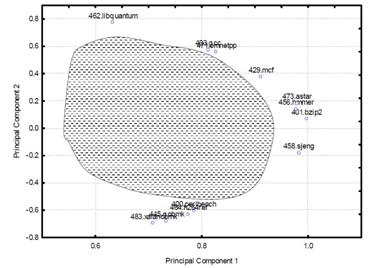
Figure 2. SPEC CINT 2006 programs plotted in the PC space using memory access characteristics (PC1 vs. PC2), Weak spots are highlighted trough a gray shapes
Figure 3 and Figure 4 shows the SPEC CINT 2006 programs plotted in the PC space using memory access characteristics, PC3vs. PC4 and PC2vs. PC3 respectively, Weak spots are highlighted trough a gray shapes. Figure 5 represents the variance in the four significant individual Principal Components. (a)-(d) Presents the variation of individual Principal component score corresponding to each benchmark, figure 5(a) shows the most significant variations in the in the benchmarks, PC1 covers 72.6% variation in memory space. The dissimilar behavior benchmarks are represented trough red circles in figure 5(a).
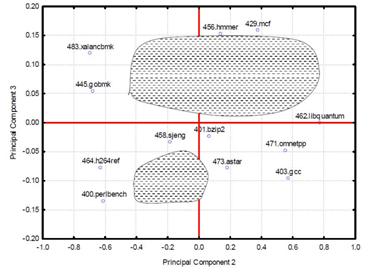
Figure 3. SPEC CINT 2006 programs plotted in the PC space using memory access characteristics (PC2 vs. PC3), Weak spots are highlighted trough a gray shapes
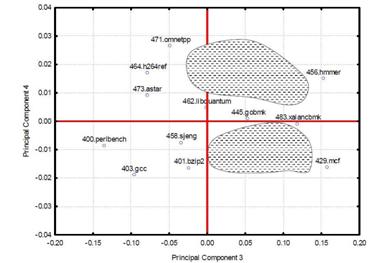
Figure 4. SPEC CINT 2006 programs plotted in the PC space using memory access characteristics (PC3 vs. PC4), Weak spots are highlighted trough a gray shapes
Figure 6 shows the dendrogram, which explains similarities and dissimilarities in workload space of AMD Opteron 2000+ and AMD Opteron 8000+ Series Processors. The benchmarks 401.bzip2 and 458.sjeng are linked with smaller linkage distance; on the other hand 462.libquantum benchmark is useful for Physics / Quantum Computing shows long linkage distance. This dendrogram is useful for selecting benchmark suite for performance evolution. The line drawn at linkage distance L=400, can select K=4 benchmark, so, one can reduce the program execution time. Figure 7 shows the two-way Joining results of AMD Opteron 2000+ and AMD Opteron 8000+ Series Processors and SPEC CPU INT 2006 benchmarks. The benchmark 462.libquantum shows high execution time which is represented trough 1800 score point boxes.
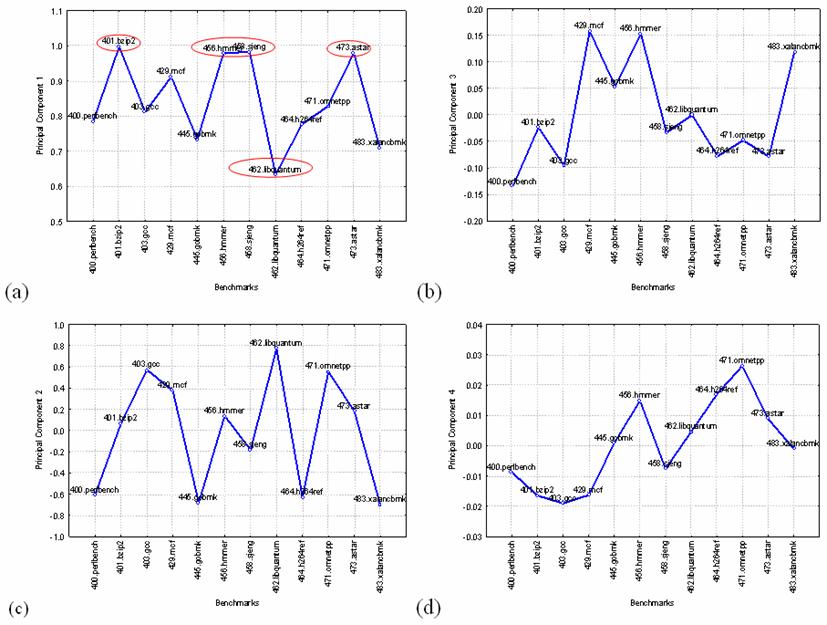
Figure 5. Represents the variance in the four significant Principal Components. (a)-(d) Presents the variation of individual Principal component score corresponding to each benchmark
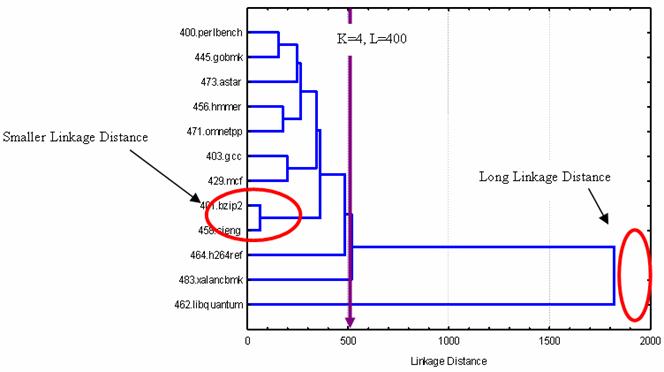
Figure 6. Dendrogram showing the similarities and dissimilarities in workload space of AMD Opteron 2000+ and AMD Opteron 8000+ Series Processors
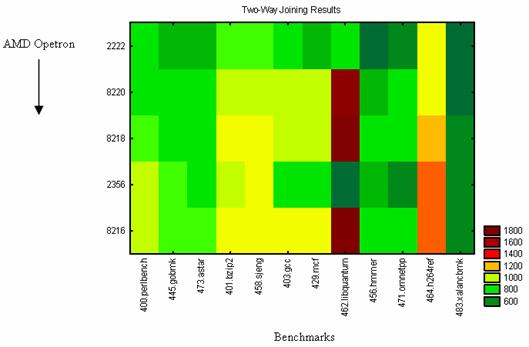
Figure 7. Cluster analysis of Two-way joining results showing the similarities and dissimilarities in workload space of AMD Opteron 2000+ and AMD Opteron 8000+ Series Processors
Disclaimer
All the observations and analysis done in this paper on SPEC CPU2006int Benchmarks are the author’s opinions and should not be used as official or unofficial guidelines from SPEC in selecting benchmarks for any purpose. This paper only provides guidelines for performance engineers, academic users, scientists and developers to better understand the benchmark suite and to build a complete benchmark suit which covers the entire spectrum of the memory space without weak spots.
Acknowledgement
The authors would like to thank Prof. D. K. Gautam, Head, Department of Electronics, North Maharastra University, Jalgaon, (M.S), India, and Prof. Ravi Pandey, Professor and Department Chair, Michigan Tech. University, USA, for many stimulating comments and discussions. One of the authors (A.K.P.) gratefully acknowledges financial support of UGC for a meritorious research fellowship.
References
1. Oberman S., Favor G., Weber F., AMD 3DNow! Technology: architecture and implementations, IEEE_M_MICRO, 1999, 19, p. 3748.
2. AMD ×86-64 Architecture Manuals [online] [accessed on August, 2009]. Available at: http://www.amd.com.
3. Xue Y., Zhao C., Automated PhaseOrdering of Loop Optimizations Based on Polyhedron Model, Proc. 10th IEEE International Conference on High Performance Computing and Communications HPCC '08, 2008, p. 672677.
4. Homayoun H., Pasricha S., Makhzar M., Veidenbaum A., Dynamic register file resizing and frequency scaling to improve embedded processor performance and energydelay efficiency, Proc. 45th ACM/IEEE Design Automation Conference DAC 2008, 2008, p. 6871.
5. Aashish Phansalkar, Ajay Joshi and Lizy K. John, Analysis of Redundancy and Application Balance in the SPEC CPU2006 Benchmark Suite, ISCA’07, June 9-13, 2007.
6. Nair A., John L., Simulation points for SPEC CPU 2006, Proc. IEEE International Conference on Computer Design ICCD 2008, 2008, p. 397403.
7. Abdul Kareem P., R. A. Singh, Performance Scaling of Individual SPEC INT 2006 Results for AMD Processors, Leonardo Electronic Journal of Practices and Technologies, 2009, 14, p. 65-72.
8. SPEC CPU2000 Press Release FAQ [online] [accessed on August, 2009], Available at: http://www.spec.org/osg/cpu2000/press/ faq.html
9. KleinOsowski A.J., Lilja D.J., MinneSPEC: A new SPEC benchmark workload for simulation-based computer architecture research, Computer Architecture Letters, 2002, 1, p. 7-7.
10. Henning J.L., SPEC CPU2000: Measuring CPU performance in the new millennium. IEEE Computer, 2000, 33, p. 28-35.
11. StatSoft, Inc. (2004). STATISTICA (data analysis software system), version 7, for windows. www.statsoft.com.