Global Voltage Stability Analysis of a Power System Using Network Equivalencing Technique in the Presence of TCSC
Sunita Halder Nee DEY, Palukuru NAGENDRA*, and Subrata
PAUL
Department of Electrical
Engineering,
E-mail: sunitaju@yahoo.com; indrapn@gmail.com; spaul@ee.jdvu.ac.in
(*Corresponding author: Phone: 09804353148, Fax: 03324146184)
Abstract
This paper presents a methodology for assessing the voltage stability using the concept of equivalencing the multi-bus power system to a two-bus network model and by studying the necessary parameters of the equivalent system. There by, a generalized global voltage stability indicator being developed, it has been applied to a robust practical 203-bus Indian Eastern Grid system. Simulation results indicate that this optimal power flow (OPF) based network equivalent approach is promising to assess voltage stability of any power system at any operating point in global scenario. In addition, the application of thyristor controlled series capacitor (TCSC) compensator at critical line indicates the improvement of global voltage stability at all operating conditions. In the equivalent network the generators are modeled more accurately considering economic criteria.
Keywords
Global Voltage Stability; Network Equivalence; OPF; TCSC; Weakest Bus.
Introduction
To meet ever-increasing electrical load demand, the modern power systems are under going numerous changes and becoming more complex from operation, control and stability maintenance standpoints. The major problem that associated with such a stressed system is voltage instability or collapse. A system is said to enter a state of voltage instability when a disturbance causes a progressive and uncontrollable decline in voltage, which can occur because of the inability of the network to meet the increased demand for reactive power. Many recent power system blackouts all over the world have been the consequences of instabilities characterized by sudden voltage collapse phenomena [1, 2]. Therefore, the voltage stability analysis is essential in order to identify the critical buses in a power system i.e., buses which are closed to their voltage stability limits and thus enable certain measures to be taken by the operators in order to avoid any incidence of voltage collapse.
Many analysis methods [3-6] of voltage stability determination have been developed based on the load flow solution feasibility, optimal power flow, bifurcation technique, singularity of Jacobian etc. Different voltage stability indicators have also been established covering both static and dynamic aspects of the problem [7]. Efforts also have been made to assess the voltage stability of large power systems in terms of network equivalents to obtain the global picture of voltage stability. The power system equivalents are of importance [8-10] for the study of static characteristics of a large system when either the computer facilities for direct solution or the available solution time is restricted. The use of equivalent representation of the complex system simplifies the lengthy calculations and analysis system stability easily. This paper describes a unique method of equivalencing a multi-bus power network to an equivalent two-bus system developed from optimal power flow solution and thereby voltage stable states of the entire system following the load changes in ‘weak’ load buses investigated for a typical power system networks. The simulation also includes the detection of the ‘weak’ load bus/buses and identification of the global voltage stable states of the system following the derived two-bus equivalent system simulation [11-13].
Next, this paper concentrates on the application of Flexible AC transmission system (FACTS) to enhance the power system performance in terms of voltage stability. With the development of FACTS controllers, there is a growing interest in using these devices to provide voltage and power flow control in power systems. Their application in improving the overall performance of the power system is discussed in [14]. FACTS controllers have been defined by IEEE as ‘alternating current transmission system incorporating power electronic based and other static controllers to enhance controllability and increase power transfer capability’ [15]. Among the existing FACTS devices, the thyristor controlled series capacitor (TCSC) compensator has been effectively used to increase the line power transfer as well as to enhance the voltage stability of the system. Hence, in this paper an attempt is made to study the role of TCSC compensator installed at critical lines and its effect on local as well as global voltage stability [16], following the computer simulation. Voltage stability enrichment with the application of TCSC is compared with the results obtained for normal system.
Optimal Power Flow
The main purpose of an OPF program is to determine the optimal operation state of the power system by optimizing a particular objective while satisfying certain specified physical and operational constraints. In this paper, Newton’s method of optimal power flow has been utilized to assess the voltage stability of the multi-bus power system considering economic criteria.
The cost function (![]() ) of a N-bus
power system having NG number of fossil fuel units is given by [16]
) of a N-bus
power system having NG number of fossil fuel units is given by [16]
 unit
of cost/hr
(1)
unit
of cost/hr
(1)
where αi, βi, γi are the cost coefficients of ith generator; Pgi, the real power generation at ith generator bus; NG, the total number of generators; Fci, the cost of generation at ith generator; and Fctotal, the total cost of generation in the system.
The aim of optimal power flow is to optimize the cost function subjected to active power, reactive power and security related constraints. The Lagrangian function for optimal power system is given by
 (2)
(2)
where Pi
and Qi are the active and reactive
power injections at ith bus respectively; ![]() is
the reactive power generation at ith bus; λpi and λqi
are Lagrangian multipliers for active power and
reactive power balance at the ith bus
respectively. From (2) the change in control variables is available as
is
the reactive power generation at ith bus; λpi and λqi
are Lagrangian multipliers for active power and
reactive power balance at the ith bus
respectively. From (2) the change in control variables is available as
 (3a)
(3a)
or
 (3b)
(3b)
or [H] [Change in control variables] = [J], where [H] and [J] are Hessian and Jacobian matrices, respectively.
Starting from initial data of an interconnected power system optimal power flow solution may be achieved by solving (3a) or (3b) using iterative process and thereby both power generations and voltages are calculated simultaneously considering the economics of operation with all system constraints taken into account. As the Hessian matrix, [H] becomes singular, there will be a large change in control parameters of the system and therefore the critical point of optimal power flow solution, beyond which there will be no possible generation, can be identified. This state represents the voltage stability limit of the system.
The total complex power loss of the entire multi-bus power network being the algebraic sum of the all line flows in the system, the power balance equation for multi-bus power system is given by
SL = Sg - Sload (4)
Equivalent Two-Bus Network and Formulation of GVSI
Development of Equivalent Two-Bus Network
Let us assume a two-bus equivalent network where sending end bus is assumed as a generator bus and receiving end as a load bus connected by a line impedance, representing the equivalent of the entire multi-bus network as shown in Fig.1.

Figure 1. Equivalent two-bus power network
The behavior of the proposed two-bus equivalent network will be same as that of multi-bus network and it should reflect the common properties of the original system [17, 18]. Therefore, the power balance equation for the two-bus equivalent network can be written as
Sg = SL + Sload (5)
The complex power loss for this equivalent system is given by
 (6)
(6)
where Pg, Qg are real and reactive power generations respectively; Sg, Sload are the total complex source and load powers respectively; SL is total complex power loss; and Zeq is equivalent impedance of the two-bus network.
The sending end voltage, Vs being assumed to be at nominal value of 1.0 p.u., the Zeq can be obtained. Then, the receiving end voltage Vr can easily be calculated as follows:
 (7)
(7)
Thus the two-bus system developed above becomes the equivalent model of a multi-bus network at any particular network and load configuration.
Global Voltage Stability Analysis
Once the global two-bus power network equivalent to multi-bus power system is obtained then the global voltage stability indicator could be formulated in a straight forward manner from the parameters of global network as follows:
The voltage-current relation in terms of ABCD parameters for the series equivalent circuit of the transmission line, is given by
 where
where ![]()
Assuming ![]() and
the sending end voltage, Vs being constant (1Ð0º p.u.),
the active and reactive power at receiving end are given by
and
the sending end voltage, Vs being constant (1Ð0º p.u.),
the active and reactive power at receiving end are given by
![]() (8)
(8)
![]() (9)
(9)
The Jacobian matrix [17-19] of above power flow equation is given by
 (10)
(10)
Then, the determinant of Jacobian matrix
![]() (11)
(11)
At the
critical point of voltage stability, ![]()
![]() (12)
(12)
where Vcr, dcr is the critical values of receiving end voltage and power angle respectively at voltage stability limit.
Also, the
critical power angle ![]() ;
;
Again taking Vr as reference phasor, the fundamental power equation may be represented as,
![]() (13)
(13)
Taking the first derivative of (13) with respect to S (complex load bus power), simplification yields (at voltage stability limit),
 (14)
(14)
Taking into account the profile of voltage against S (Fig.2) voltage stability limit is attained obviously when dVr/dS = 0; voltage stability is maintained till the slope of dVr/dS is negative, (i.e. when Vr<Vs/2). Therefore, to secure global voltage stability, global voltage stability indicator can be defined as GVSI = dVr/dS. It indicates how far the present operating condition is from global system voltage collapse i.e., the global voltage security status of the present operating condition. Therefore, with Vs=1 p.u, voltage stability of the two-bus network is maintained when
 (15)
(15)

Figure 2. P – V curve
Thyristor Controlled Series Capacitor
The Thyristor controlled series capacitor (TCSC) is one of the most popular FACTS controllers, which has been extensively used to increase the line power transfer as well as to enhance the voltage profile of the system. TCSC is connected in series with the transmission lines. It is a variable reactance device based on thyristors. With suitable control, the TCSC changes its apparent reactance smoothly and rapidly and hence it is useful for controlling the series voltage drop in the line [16]. The basic structure of TCSC, shown in Fig. 3, consists of a capacitive series reactance shunted by a thyristor controlled reactor in order to provide stepless variation in capacitive reactance. In this scheme, the firing angles of the anti-parallel thyristors are controlled to control the reactor and at 180° firing angle, the thyristor controlled reactor is non-conducting while the series capacitor has its normal impedance. When the firing angle is reduced from 180º (but not less than 90º), the capacitive impedance increases and at 90º firing angle, the thyristor controlled reactor conducts fully and the total impedance becomes inductive.
The TCSC can be modeled as a variable reactance (both inductive and capacitive) where the equivalent reactance offered by TCSC, XTCSC depends on the firing angle of the thyristors. The expression of power flow of a transmission line with TCSC connected between two nodes i and j is given by
![]() (16)
(16)
The equivalent reactance of the TCSC controller can be adjusted to regulate the active power flow across TCSC.
For inductive operation, the reactive power equation at node i is
![]() (17)
(17)
and for capacitive operation, the signs of the equation are reversed.
The real power flow mismatch equation in TCSC, is given by
∆Pij = Pij(req) – Pij(cal)
where Pij(req) is the required power flow in the TCSC.
The value of the XTCSC of the TCSC controller can be updated at the end of p iteration as follows
XTCSC(p+1) = XTCSC(p) + ∆XTCSC(p) (18)
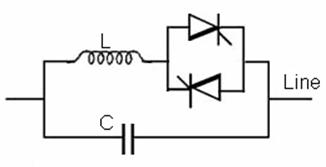
Figure 3. Schematic of Thyristor Controlled Series Capacitor
Algorithm
The necessary algorithm of the proposed methodology for equivalencing the multi-bus system to a two-bus system and computing voltage stable states is presented below:
- Run the optimal power flow for base case and identify the weakest bus of the given multi-bus system and define power factor of load at weakest bus.
- Increase the active load of the weakest bus in small step and modify reactive load keeping power factor constant.
- If TCSC model is added, then find the required XTCSC and make necessary changes in admittance matrix.
- Run the optimal power flow algorithm of the given multi-bus system. Go to step-9 if the OPF algorithm does not converge.
- Calculate the total generation, load and transmission line loss of the system.
- Find equivalent impedance (Zeq) for the equivalent two-bus model.
- Calculate Vcr (i.e., voltage corresponds to voltage collapse point), Vglobal (i.e., receiving end voltage of the equivalent system) and global voltage stability indicator (dVr/dS).
- Goto step-2.
- Stop.
Results and Discussion
The developed concept has been applied to a robust practical West Bengal State Electricity Board (WBSEB) 203-bus (Indian Eastern grid) system, the single line diagram of which is given in appendix. The real WBSEB system has 24 generators, 35 three-winding transformers, 37 two-winding transformers and 108 load buses which are connected by 267 transmission lines. A computer software programme has been developed in the MATLAB environment to perform the simulation on the considered system. The reactive power sensitivity analysis reveals that bus numbers 172, 173, 171 are the critical buses consecutively.
For the test system, the complex loading at the weakest bus is increased in steps up to a point at which OPF method is diverged indicating total voltage collapse of the system keeping the power factor constant at 0.85 lag. Two-bus equivalent being first developed, the profiles of global parameters have been obtained for dynamic changes in system load demands at any particular load bus separately for bus numbers 172, 173, 171 of the practical system. The TCSC model is connected between the load buses 156 and 152 and the behavior of the test system has been studied for different loadings of the system in terms of load margin in static voltage stability study. The results are encouraging to assess the global voltage stability of the system and are shown graphically below.
The voltage profiles of the individual weak load buses (i.e., 172, 173, 171) of the system have been plotted in Fig. 4 for system operating load variations at respective load buses. Observation of individual load bus voltage decline profile reveals that the bus voltage approaches instability much earlier for increase in system loading in bus 172 than the bus voltage in bus 173 or 171. Degree of stability is thus the lowest for bus 172 followed by those of bus numbers 173 and 171 of the WBSEB grid system. An increased voltage profile at weakest bus (i.e., 172) is observed in each loading case when TCSC compensator is connected at the corresponding critical line between 156-152 buses of the system along with better loading catering capability.
Fig. 5 exhibits the profiles of the computed |dVr/dS| (global voltage stability indicator) for the equivalent system for complex power demand variation at the load buses of the original multi-bus network indicating loss of voltage stability much earlier incase of weakest bus than that of consecutive weak buses of the test system. These profiles help to assess the vulnerability of the power system towards global voltage collapse and at the point of global voltage collapse, the slope of the |dVr/dS| is negative. Also it is clear that with the application of TCSC compensator at corresponding critical line connected to weakest bus of the system, the global voltage stability limit has been improved significantly.
Figure 4. Profiles of voltage of the load bus under simulation for WBSEB grid system
Figure 5. Profile of VSI criterion applied for equivalent system for change in complex power demand in load buses for WBSEB grid system
Figure 6. Profile of global receiving voltage for change in complex power demand in load buses for WBSEB grid system
Fig. 6 exhibits the variation in global receiving end voltage (Vg) for the equivalent two-bus system of the multi-bus network for system load variation at respective weak load buses of the original system. The global receiving end voltage is gradually decreasing with the increase of load indicating the system is approaching towards local voltage collapse at equivalent receiving end. The nose point of the curve represents the point of critical voltage stability of the system. It may again be observed that the bus number 172 is the most vulnerable to voltage collapse followed by bus numbers 173 and 171 in the simulated WBSEB grid network. The application of TCSC indicates sharp improvement in voltage stability.
Next, to highlight the strong relation between the voltage stability analysis of the original system and its equivalent two-bus system, the determinant of Hessian matrix of the original system is considered (Fig. 7). With the increase in system load, the determinant of Hessian matrix approaches zero indicating the system’s susceptibility towards voltage collapse which perfectly matches with profiles of global VSI (Fig. 5) and thus relate the original system and the proposed equivalent two-bus model in a better way.
Figure 7. Profile of determinant of Hessian matrix of the WBSEB grid system with increase in load at weakest bus
Conclusions
A network equivalencing technique to diagnose the weakest bus and assess the voltage stability in a multi-bus power system based on the optimal power flow has been developed. The operating variables for the developed two-bus equivalent network being termed as global voltage, global critical voltage etc., the OPF simulation for determination of these parameters helps to diagnose the weakest part of the multi-bus power system and is thus extremely helpful in assessment of voltage stability. The investigation on the robust WBSEB 203-bus (Indian Eastern grid) system reveals that the proposed technique is promising to detect the weakest load bus as well as the global voltage stable states of the entire network following any disturbance in the load structure of the network.
The investigation also reveals that the application of TCSC compensator at the critical line in the system not only improves bus voltage profiles and assures stable voltage operation but also improves system economy by optimising cost functions governed by active and reactive power constraints.
Acknowledgements
The authors gratefully acknowledge the authorities of the
References
1.
Kundur P., Power system stability and
control,
2. Bian J., Rastgoufard C. D., Power system voltage stability and security assessment, Electric Power systems Research, 1994, 30(3), p. 197-201.
3. Ajjarapu V., Lee B., Bifurcation theory and its application to nonlinear dynamical phenomena in an electrical power system, IEEE Trans. Power Systems, 1992, 7(1), p. 424-.–431.
4. Salama M. M., Saied E.M., Abdel-Maskoud S.M., Steady state voltage assessment in power system, Int. J Energy conversion and Management, 1999, 40 (1), p. 59-69.
5.
Venikov V. A., Sterov
V. A., Idelchick V. I., Tarasov
V. I., Estimation of electric power system steady state stability in load
flow calculation,
6. Vaahedi E., Tamby J., Mansour Y., Wenjuan Li., Sun D., Large scale voltage stability constrained optimal VAR planning and voltage stability applications using existing OPF/ optimal VAR planning tools, IEEE Trans. Power Systems, 1999, 14(1), p. 65-74.
7. Morison G. K., Gao B., Kundur P., Voltage stability analysis using static and dynamic approaches, IEEE Trans. Power Systems, 1993 8(3) p. 1159-1171.
8. Nagendra P., Datta T., Halder S., Paul S., Power system voltage stability assessment using network equivalents - a review, Journal of Applied Sciences, 2010, 10(18), p. 2147-2153.
9. Rahman T.K.A., Jasmon G. B., A new technique for voltage stability assessment in a power system and improve load flow algorithm for distribution network, IEEE 1995, Proc. of EMPD’95, 2, p. 714-719.
10. Kashem M.A., Ganapathy V., Jasmon G.B., Network reconfiguration for enehancement of voltge stability in distribution neworks, IEE Proc-Gener, Transm, Distrib., 2000, 147(3), p. 171-175.
11. Verbic G., Gubina
F., A new concept of voltage-collapse protection based on local phasors, IEEE Trans. Power
12.
13. Corsi S., Taranto G.N., A real time voltage instability identification algorithm based on local phasor measurements, IEEE Trans. Power Systems, 2008, 23(3), p. 1271-1279.
14. Hingorani N.G., Gyugyi L., Understanding FACTS: Concepts and Technology of Flexible AC Transmission System, Wiley-IEEE Press, 1999.
15. CIGRE 95 TP 108, FACTS overview, IEEE Power Engineering Society, 1995.
16. Chakrabarti A., Sunita Halder, Power system analysis: operation and control, New Delhi, India, Prentice Hall of India (pvt) Ltd., 2nd edition, 2008.
17. Jasmon G.B., Lee L.H.C.C., Distribution network reduction for voltage stability analysis and load flow calculation, Int. J Electric Power and Energy System, 1991, 1(1), p. 9-13.
18. Yang Wang, Wenyuan Li, Jiping Lu, A new node voltage stability index based on local voltage phasors, Electric Power Systems Research, 2009, 7(1), p. 265-271.
19. Chakrabarti A., Kothari
D.P., Mukhopadhyay A.K., De A., An introduction to
reactive power control and voltage stability in power transmission systems,
Appendix
The single line diagram of the WBSEB Grid system is shown in Fig. A
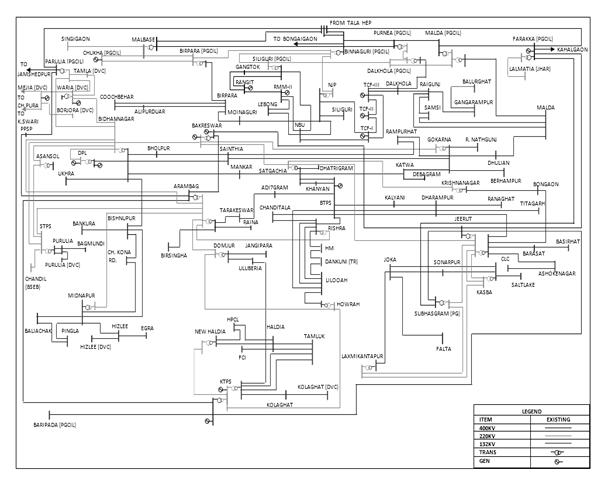
Figure A. Typical Indian Eastern grid (WBSEB 203-bus) system