Use
of Drag Reducer in Improving Water (Flooding) Injectivity
in
*Amieibibama JOSEPH and Joseph Atubokiki AJIENKA
*Department of Petroleum and Gas Engineering,
Email: *josephamieibibama@yahoo.com, jajienka@yahoo.com
*Corresponding author: Phone: +234-8136301813
Abstract
Evaluation of water-flooding injectivity involves identifying the causes of the problem(s) of the operation and coming up with possible solutions. Ukpokiti field was projected to be injected with 40,000BWPD, however, on commencement of operation only about 30,000BWPD could be injected.
This live field experimental work identified pipeline restriction to the injector wellheads as responsible for the lower injectivity. The test involved injecting 15ppm, 20pm and 27ppm of Conoco drag reducer (CDR) downstream the turbine pumps that supply water to the injector wells. Velocity and the injection rate of water to the injector wells (with no CDR added) were measured. From the field results, 20ppm of CDR injection gave optimum injection increase of 13% and adding a third side outlet 3” pipeline into the wellheads gives independent 16% increase in injectivity. The test had no negative impact on the environment.
The result could be applied as an aid and quick means of predicting water-flooding operation in similar operating condition as Ukpokiti field.
Keywords
Water-flooding; Injectivity; Drag reducer; Pumpability; Turbulent flow.
Introduction
Drag reduction is the increase in pumpability of a fluid caused by the addition of small amounts of addictive (drag reducers) to the fluids. It can also be defined as the difference in frictional pressure drop along a segment of pipeline, comparing pumping untreated fluid and fluid containing drag reducer at a constant flow rate.
Turbulent flow can occur in the boundary layer near solid surfaces (pipeline) and the associated fiction increased as the flow velocity increases. The energy losses and self-noise due to turbulence friction can be of very high magnitude. For liquids, it is believed that for a pipeline in turbulent flow, there exists near the pipe wall a viscous sub-layer of laminar flow. Next to this is an intermediate (elastic) sub-layer and in the centre is the turbulent core [1]. Drag reducers are believed to work by stabilizing and modifying the pipe wall sub- layer by reducing the frequency of turbulent eddy bursts from this region [2]. In this way the rate of energy dissipation within the eddy flow, the frictional drag and hence pressure drop in the pipeline is reduced. This reduction in rate of energy dissipation due to fluid friction could be achieved by injecting small amount of drag reducing agent at the outlet of the pump stations.
The main purpose of drag reduction (DR) is to delay the onset of turbulent flows. In other words, a drag reducer will shift the transition from laminar flow to a turbulent flow to higher flow velocity. The turbulent core is reduced in size as the intermediate sub-layer expands. When injected continuously into a pipeline at concentrations of typical 40-100ppm of formulated product, turbulence and resulting frictional pressure drop can be reduced by as much as 60%. Drag reducer (otherwise known as the flow improver) also acts on the formation to increase fluid injectivity by increasing capacity of the system [3]. It was reported that there is unusually low friction factors for dilute solutions of poly (methyl methacrylate) in monochlorobenzene. Accordingly, this product has particular application in pressure-limited systems [4,5] which is operating at or near the maximum line pressure. The benefits of drag reducers begin almost immediately after injection and increase until all the fluids in the line contain drag reducer. Similarly, the benefits reduce once injection is halted [6].
Reservoir Description
Ukpokiti field is located in offshore
Western Niger Delta in
The field has two reservoirs that in this project are referred as the short and long reservoirs. The long reservoir, which is under-saturated, has an API of 42.8 with a bubble point pressure of 2730psi, while the short reservoir is saturated with API of 43.2 with bubble point pressure of 3239psi [7].
The field has pressure
support by water flooding through well ‘C’ and ‘A’. Well ‘A’ is
supposed to flood the long reservoir, while well C will give pressure support
to the short reservoir. These wells are supposed to flood the reservoirs with
the projected 40,000BWPD. However, at the commencement of operation, the
facilities could only deliver 31,000
Description of Injection Water Treatment System
The injection water treatment system (IWTS) was designed to provide 40,000 BWPD treated seawater (maximum) prior to injection into oil-bearing formation in order to maintain reservoir pressure and optimize oil output [8]. The equipment is located on an FPSO, Offshore Nigeria.
Seawater lift pumps provide sufficient water at process pressure of about 100psi to feed the coarse strainers and then the media filters. The package is designed to remove 95% of particles of 5micron and larger diameter from the seawater. There are three 50% media filters vessels for a total maximum throughput of 42,000 BWPD. Before entering the media filter vessels the seawater is treated with coagulant and polyelectrolyte.
The water entering the vessel is easily spread over the entire top surface of each filter bed by the top distributor system. It then work its way down through the three layers of the filters media which is then collected via laterals of the header system before leaving the vessel. During filtration, the particular matter carried by the water is trapped within the filter media. Due to the carefully selected grades of media, this entrapment occurs right through the top two layers. This system is usually back-washed.
Planning and Execution
Sequel to the low water injection rate being experienced with the injection water system, with the assistance of multidisciplinary team of engineers and operations personnel; we came up with the option of testing the CDR performance and sizing the flowlines. This chapter will be concerned with the test planning and execution. At the end, we will see whether we could restore the projected water injection rate.
Before the commencement of the actual test, fluid compatibility studies were conducted by two reputable companies to determine the cause of the lower injection rates in this field. The major conclusions are summarized below as [9]:
§ Loss of injectivity was attributed to fluid incompatibility. Crude + oil based mud + seawater (1:1:1) produced a thick heavy emulsion at 95ºF.
§ Addition of 15% HCl or 10% acetic acid to the emulsion (crude oil, oil based mud, seawater, and acid = 1:1:1:1) produced non-flammable solid mixture in the laboratory. It was concluded that the treatment design for restoring the injectivity should not include an acid.
§ Injection of defoamer into the injection system may have also contributed to increase injectivity. Defoamer may reduce the foaming in the de-aerator and may also contribute to lower levels of dispersed gas in the aqueous phase. This phenomenon may have been further helped by the discontinuation of the continuous corrosion inhibitor (containing surfactant) into the water. It was concluded that injection of sea water with lower levels of dispersed gas may have contributed to increased injectivity.
Injectivity calculation on actual well data confirmed that the well is capable of accepting an injection rate of 30,000 – 40,000BWPD. The well experienced losses of 300BPH after each perforation run; this equates to an injectivity index of 29bpd/psi. With this injectivity index, the well should be capable to accept the expected rate (frictional losses with casing injection are calculated at 13 psi).
Another test that was carried out prior to the water flooding evaluation is pressure fall-off test. Data generated and analysed showed no skin or damaged problems. The salinity test to check whether there was water break-through, proved that the salinity of the produced water (12,000ppm) and injected water (10,000ppm) were completely different, which suggests that there was no water breakthrough [10]. Meanwhile, the electronic analyzer showed that the turbidity was within acceptable level of 0.005NTU.
With the assistance of Watson test on the CDR overall impact on Ukpokiti water-flooding network [11], the environment as well as compatibility with other chemicals used for this operation showed a satisfactory result with no negative impact. Consideration given for selecting the CDR was because it is easily accessible and it belongs to the new generation of drag reducing agents that is more concentrated than many competitive products. The estimates of product performance as a function of DRA concentration lack the test data required to validate our peculiar case. However, this might be attributed to the complication of Ukpokiti field network where about 84% of total injected water goes to well A.
Actual CDR Performance Test
When the actual CDR performance test began, data were generated for a 24-hour period and graphically displayed on Figure 1-6. During the said period, no CDR was injected into the lines and all systems including the turbine pumps steam supply were in full throttle. This was taken as the baseline.
The CDR injection started using 27 gallons initially which was calculated to be 20ppm (Figures 1-6).After 24-hours of injection, the CDR injection rate was reduced to 15ppm and monitored for another 24hours. The decision to inject CDR for these two rates (20ppm and 15ppm) was occasioned by result of laboratory test carried out which showed that an optimum injection rate will be within this concentration [6]. However, to test this laboratory result, we injected 27ppm of CDR into the injection line. The result obtained did not differ from that of 20ppm.
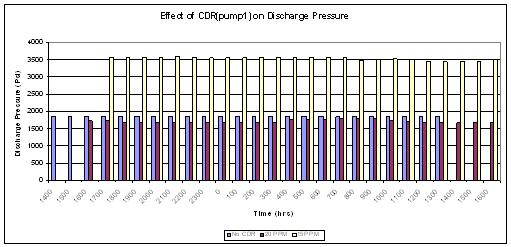
Figure 1. Discharge Pressure against time
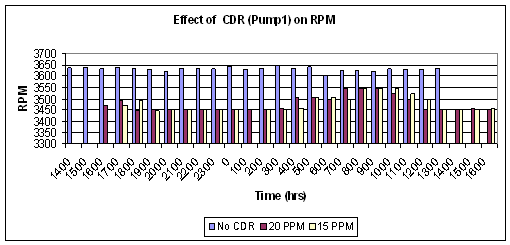
Figure 2. A plot of RPM against Time
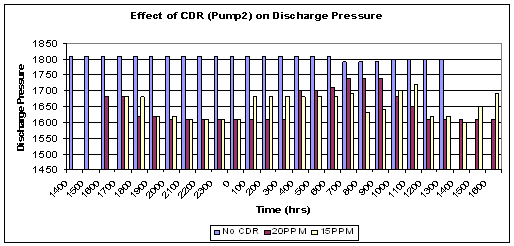
Figure 3. A plot of Discharge Pressure against Time
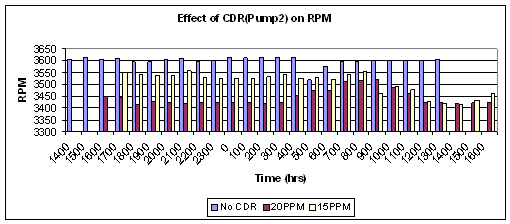
Figure 4. A plot of RPM against Time
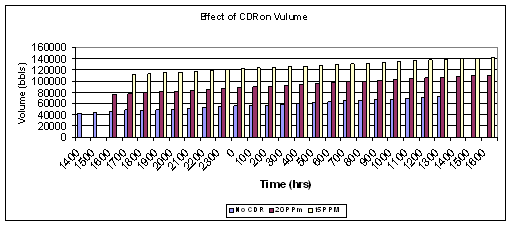
Figure 5. A plot of Volume against Time
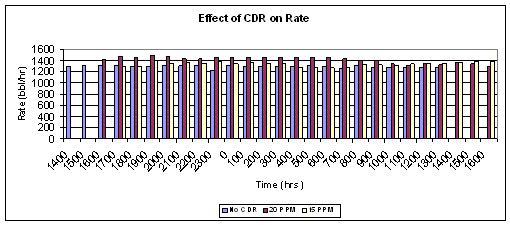
Figure 6. A plot of Rate versus Time
Sizing of the Pipeline
The original design was a 6-inch pipeline which runs to the injector well and which is supposed to deliver 40,000WPD at a surface pressure of 1600psi. However, this failed. A field test was done to investigate the effects of the pipe size. It was assumed that the total flow be equally split into the two lines and that each line is schedule to give an inside diameter of 2.9-inch. The velocity of flow observed was significantly greater than the normal designed velocity of 7ft/sec to 14ft/sec. The consequence of higher velocity is that the pipeline could erode at a very fast rate.
From the baseline data it was clear that the undersized pipeline could only deliver 30,959BWPD at a surface pressure of about 1840psi (weighted average). The failure of the said pipeline to deliver the projected 40,000 BWPD showed that there is need to redesign the pipeline because earlier test proved that the formation could accept more water. Accordingly, considering the fact that Ukpokiti field is a marginal field and management might not be ready (financially) to line up new pipelines of higher diameter, one of the ways to de-bottle this undersized pipeline, beside CDR injection is to replace the 3-inch line with a larger diameter line and/or an additional 3-inch line (being the third) be installed.
Analyzing of Test Result
Firstly, we would critically look at the result from the CDR performance test, then the pipeline sizing.
For the CDR performance test, from the generated data for each of the rates; point of consideration for the analysis are regions where we had ‘stability’ or minor disturbances. The instabilities could be attributed to changes in the steam supply to the turbine pumps or malfunctioning of the CDR injection pump, among other factors.
In establishing the
stable region, the discharged pressure speed (
By definition, drag reduction is the ration of
the pressure drop of a formulation to the pressure of the pure solvent at the
same flow rate [12]:
DR = ∆pformulation /∆psolvent | Constant flow rate (1)
Thus, the percent drag
reduction can as well be expressed as:
DR(%) = (∆Puntreated
- ∆Ptreated)/∆Puntreated*100 (2)
where, DR = percentage of drag reduction; (ΔP) untreated = Baseline average pressure, psi; (ΔP) treated = Average pressure after CDR treatment, psi.
For the injection of 20ppm of CDR (Figures 1-6), we had stability from 100hrs through 300hrs the next day. This resulted in pressures of 1669psi and 1610psi for pumps 1 and 2 respectively; thus averaging 1635psi and delivering 34,778bwpd. Based on this rate there was an increase of (34,778 – 30,959) 3,819bwpd that gave us 13% in water injection rate.
Meanwhile,
DR(%) = (1-1635/1840)*100 = 11.14%
Accordingly, for the injection of 15ppm of CDR (Figures 1-6), we observed stability from 2300hrs through 0300hrs the next day, with pressures of 1730psi and 1680psi for pumps 1 and 2 respectively. On the average we had 1705psi while delivering 32,482bwpd. We experienced an increase of (32,482 – 30,959) 1,532bwpd that equates to 5% increase in water injection.
Consequently,
%DR = (1840/1705-1)*100 = 7.92%
The test results are successful in showing that drag reduction and water flooding injectivity could be increased here in the Niger Delta, by using Conoco drag reducer in a single phase system as water. This will increase Ukpokiti field facility capacity and in one way solve our problem of lower injectivity.
The Pipelines
The treated seawater is injected into the Ukpokiti injector well via 6-inch injection lines from the FPSO. The injection to each of the well is through 3-inch side inlets. From Table 1, the total throughput and velocities for these lines are shown. However, from the recommended three side inlets to the injector we had an increase in injectivity:
Injectivity Increase (%) = (36000/30959-1)*100 = 16.28%
Table 1. Pipe Sizing
|
Total Flow Rate(bwpd) |
Total Flow Rate in each of the two pipes(bwpd) |
Velocity (ft/sec) |
|
20,000 |
10,000 |
14.17 |
|
24,000 |
12,000 |
17.0 |
|
30,000 |
15,000 |
21.5 |
It was recommended that we use the point where 12,000bwpd flow through each of the lines. This will give a total throughput of 36,000bwpd and considering the optimum velocity of water through these is within 17ft/sec.
Conclusion and Recommendation
Despite encouraging performance of the last result, the major fear is the cost of the drag reducer considering the fact that Ukpokiti field is marginal. The test results show no detrimental environmental health or general safety problem and compatibility with the treated injected seawater was proven.
It is recommended that for best result there should be multiple points of CDR injection especially at the wellhead. Steam supply unit should be checked as well as modify injection pump control settings so as to inject higher rates (>31,000BWPD).
It is also recommended that the 2.9-inch inch line at the well head be replaced with a larger diameter line and/or and additional 3-inch line be installed at injection rates higher than 31,000 BWPD to minimize erosion problems.
Furthermore, all future treatment designs to restore injectivity in injector well or to enhance productivity from producing well should include fluid compatibility studies.
Other options could be employed to improve injection since these results only prove the viability of limited options we could use to improve injectivity. For instance, based on the laboratory test from one of the clients; we should pump 15 barrels of a solution (containing xylene, 10% mutual solvent, 0.2 to 0.5% surfactant, 0.5% to 1.0% non-emulsifier) as a slug from the FPSO into the injection well. Calculate the injection rate and stop injection when the slug reaches the perforation interval. Also, to soak the mixture on the perforations for one hour; resume sea water injection and obtain stable injection rates after the aforementioned slug treatment.
Finally, since this is one of the notable work on drag reducing agent in water flooding here in the Niger Delta, it is recommended that further work on this should look at the impact it has on the Niger Delta formation, interfacial shear and greater control of the optimizer solution. However, this work could be used as quick reference tool in improving water flooding injectivity locally and regionally. This result compares favourably with other celebrated work of this subject matter.
References
1. Bewersdorff H.W., and Berman B.S., The Influence of Flow Induced Non-Newtonian Fluid Properties on Turbulent Drag Reduction, Rheol. Acta, 1988, 27, p. 130-136.
2. Ohlendorf D., Effect of Surfactants on Crude Oil Drag Reduction, Oil Field Chemical Symposium, Geilo, Norway, 1986.
3. Miner K.A., Experience in the use of Drag Reduction Agent In Multiphase Pipeline to Increase Production,
SPE Paper 51245 Presented at the 22nd SPE conference held in
4. Balance D., Introduction to Oilfield
Production Chemical Treatments, Oilfield Chemicals Course held in
5. Gruner H., Application of
Chemical Drag Reducer in the Gyda Seawater Injection
Wells, 5th Oilfield Chemical Symposium
6. Dingwall I., Water Injection Drag Reducer, Field Experiences, 9th International Oilfield Chemical Symposium, Geilo, Norway, 1998.
7. Nicholas G.O., Ukpokiti Reservoir Characterization, Conoco Energy Limited, Lagos, 1996.
8. Serek B., Ukpokiti Field Injection Treatment System, Operations and Maintenance Manual, 1996, Vol. 1 (Section 9).
9. Bansal K.M., Report on UKpokiti Two Injection Rates Facilities and Development Projects, Conoco Houston, 1979.
10. Amedu J., Seminar Presentation on Ukpokiti Field Development, Conoco Energy Nigeria Limited, Lagos. 1998.
11. Watson D.K., Report of CDR Performance on Ukpokiti Field, Production Chemical Nigeria Limited, Warri, Nigeria, 1998.
12. Salvins J.G., Some Comments on Pumping Requirements for Non-Newtonian, Fluids, Inst. Petr, 1961, 47, p. 329.