The Livestock Burdent of Parasitism Database: A Strategic Management Tool
Simon BROWN 1,* and David C. SIMCOCK 2
1 School of Human Life Sciences, University of Tasmania, Locked Bag 1320, Launceston, Tasmania 7250, Australia.
2 Institute of Food, Nutrition and Human Health, Massey University, Private Bag 11222, Palmerston North, New Zealand.
E-mail(s): Simon.Brown@utas.edu.au, D.C.Simcock@massey.ac.nz
(* Corresponding author: Telephone: 03 6324 5467, Fax: 03 6324 3658)
Received: 7 April 2010 / Accepted: 12 December 2010 / Published: 24 December 2010
Abstract
The parasite burden of livestock places an enormous burden on both the animals and farmer. Parasite control usually involves the use of anthelmintics to which the parasites are rapidly developing resistance. To prolong the usefulness of the current generation of anthelmintics it is prudent to monitor their use and effectiveness, and provide reliable advice to farmers and veterinarians in order to minimise their use. We describe the prototype of the Livestock Burden of Parasitism database that is based on a Java interface to R which generates the web pages and graphics needed to respond to the requests of a user. The database is accessible at various levels according to the needs of the user and allows the input and checking of new data as well as the output of appropriate summaries of existing data. The database provides a tool for the management of anthelmintic use, the identification of successful treatment strategies and the provision of advice.
Keywords
Anthelmintic resistance; Database; Environment; Nematode; Parasite.
Introduction
Sheep, cattle and other livestock live with a burden of parasites. Sheep, for example, are known to carry nematode parasites in their gut. The nematodes lay eggs that pass out of the sheep with the faeces where they hatch and develop into infective larvae that are found on the pasture and in the upper layers of soil. As the sheep graze they ingest larvae and once the larvae reach the gut of the sheep they mature into adults, mate and lay eggs. In the gut, some species of parasite feed on the blood of the sheep while others transiently invade glands in the gastrointestinal tract or gut wall, causing local inflammation, the formation of nodules resembling ‘ulcers’ and disruption of the normal function of the gut. Parasitism compromises animal health and productivity, and parasite control imposes considerable cost and time burdens on farmers.
The main form of parasite control for most farmers is small number of anthelmintic compounds. However, the inevitable development of anthelmintic resistance [1, 2] generates an increasing challenge that has made it virtually uneconomic to keep livestock in some regions [3, 4]. Anthelmintic resistance is common among sheep and goats, is also becoming problematic among horses [5, 6], and, while it appears to be less prevalent among cattle [7], this is unlikely to remain the case [8]. In recent years there has been a marked rise in anthelmintic resistance amongst internal parasites infecting sheep and cattle in New Zealand [9-11] and elsewhere. While alternatives are being developed [12-15], it is only prudent to try to maintain the usefulness of the current anthelmintics for as long as possible [16, 17], which inevitably implies some form of monitoring of their effectiveness and of the developing resistance to them. Careful monitoring will lead to a reduction in anthelmintic use, which will prolong their useful life, reduce costs to farmers and minimise their environmental impact [16]. Eventually, it will be sensible to monitor the success of the parasite control measures that replace them [15]. Moreover, such monitoring complements those programmes in which selection pressures on nematodes have been investigated, and on the basis of which treatment regimes have been proposed which may delay the further development of anthelmintic resistance [18-21]. Overall, it is as essential to farming to gather data in this respect as in any other. McKenna [22] reported that faecal egg count reduction test (FECRT) results may offer useful information regarding the prevalence of anthelmintic resistance in sheep nematodes. Unified data from surveys and FECRT results would be a valuable resource for veterinarians, farm consultants and farmers.
Since the 1990's several surveys of parasite prevalence have been conducted in New Zealand [23-25] and there are reports concerning anthelmintic resistance [26]. The most recent data indicate that anthelmintic resistance is becoming more serious and warrants close monitoring [27]. To date such data have been collected sporadically and the results have not necessarily been integrated. Even in highly controlled studies, such as the recent monitor farm survey [27], sample sizes are small and may not be representative of all regions of New Zealand. The combination of variable anthelmintic treatment regimes, animal movements, parasite adaptibility and the changing environment make the sporadic collection of data from a few monitor farms less than ideal. A sustained effort to evaluate the parasite burdens and, as much as possible, the prevalence of anthelmintic resistance is not only desirable, but necessary if the current generation of anthelmintics on which livestock farming depends is to continue to be useful.
Farmers rely on accumulated experience, advice from farm consultants and veterinarians, and information from anthelmintic manufacturers and industry organisations, to determine the best approach to parasite control. Inevitably, the data available from each of these sources are limited, but in combination they are, potentially, extraordinarily powerful. For example, the monitoring of the spread of swine ‘flu in recent months and of SARS some years ago enabled health authorities to minimise their impact and, perhaps, to prevent them from running out of control. The effort to control the inexorable rise of multi-drug resistant Staphylococcus aureus (MRSA) is another example of the importance of controlling the use of therapeutic agents and systematically monitoring the prevalence of resistance.
New Zealand is an ideal location in which to test the usefulness of any systematic monitoring system because (i) it is geographically isolated, (ii) sustained ruminant productivity is an important component of the national economy, (iii) farmers have the resources to access the database and employ appropriate treatment strategies, (iv) many patterns of anthelmintic use are employed, and (v) some of the many ‘hobby farmer’ smallholdings adjacent to urban centres are of particular concern. Here, we outline the prototype of the Livestock Burden of Parasitism (LBP) database, which provides a means of combining all of these data into a coherent resource for New Zealand that may be a model for the rest of the world.
Practicalities of Implementation
We have developed the prototype of an internet-accessible database through which data are collated, accessed (subject to appropriate constraints) and, based on the analysis of these data, advice can be formulated and disseminated in appropriate forms to government, industry, veterinarians and farmers.
A means of collating the data collected by individuals throughout New Zealand is necessary if the developing parasite populations are to be monitored and the spread of anthelmintic resistance is to be minimised. To be useful all the relevant data need to be available for both cross-sectional and longitudinal analysis. In this way, the effects of climate change, parasite adaptation and farming practices can be monitored, and problems and useful strategies identified.
Unfortunately, farm-specific data cause farmers some concern. For example, some regard evidence of parasitism as an indication that their animals are not of the best quality, that their farming practices may be suspect or, arguably worse, that this might be true of a neighbour. While such concerns may be baseless, they are sufficient to persuade farmers that the data are commercially sensitive. For this reason, in the figures below we provide only regional summaries or artificial data.
To minimise inappropriate anthelmintic usage and facilitate rapid identification of situations of particular concern, such as the development of resistance ‘hotspots’, the data have to be analysed and made accessible to farmers and their advisors. Two issues need to be addressed: (i) the collation of data monitoring the magnitude of parasitism and the development of resistance, as well as other related issues; and (ii) the provision of expert advice to government, industry, the profession and farmers. A web-accessible database would be a cost-effective and efficient means of collecting data and disseminating advice and the latest information. Naturally, the database requires expert supervision and technical support.
Several sources of data are envisaged, each having a different level of reliability and specificity: specialist parasitologists generate relevant research data; veterinarians obtain data, such as faecal egg counts, FECRTs and anthelmintic dose rates, in the course of their clinical practice; and farmers might usefully report treatment regimes and seasonal observations. Of course, it is a simple matter to enable different levels of access based on registration of the used to control the input and verification of data and the nature of the information made available to the user.
To ensure the privacy of individuals and that no stakeholder is deterred from supporting the use of the system, the advice and information provided to a general user would be tailored to a specific region, rather than identifying any individual farm. Obviously, any unexpected data are brought to the attention of the supervising parasitologist, in which case specific advice may be provided directly.
The intention is that the database be continuing, accessible, not restricted to particular species and, eventually, run or supervised by parasitologists.
Software Components
The Livestock Burden of Parasitism (LBP) database is accessed through a web interface in two parts. The first is intended for data input and quality control. The possible input is determined by the identity of the user (for example, database adminstrators, veterinarians, farmers and the general public have access at different levels) and the data are checked for internal consistency and to ensure that anything exceptional is identified. The second is intended for interrogation of the database. Again, the level of access is linked to the identity of the user, in part because of the sensitivity of farmers to the potential for abuse of the data.
In implementing the protoype of the LBP database, we chose to use R [28] and Java. The statistical and graphical power of R makes it particularly useful in generating the necessary analyses and the maps. In particular, we employ the R packages hwriter [29] to write new HMTL scripts and maps [30] to produce a geographical display of the data. The choice of Java was motivated by a desire to minimise the likelihood of problems in integrating different packages, although we did consider several alternatives. Using rJava and JRI enabled us to call R from Java and to activate Java from the R prompt, each of which was useful in the development phase. In effect, the web pages provide a Java interface with R, which is used to carry out the analysis and create the maps and other graphics that are displayed to the user. The Java interface also facilitated the transfer of new data to R, which is used to check for internal consistency and to ensure that anything exceptional is identified (Figure 1).
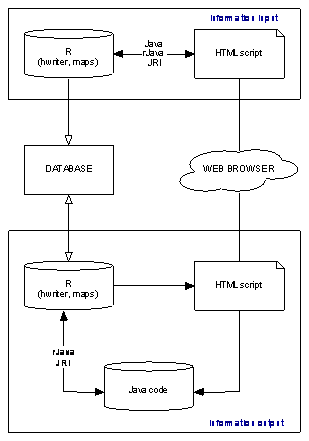
Figure 1. Interconnections of the modules in the Livestock Burden of Parasitism (LBP) database.
The upper and lower blocks represents the data input and output modules, respectively
Data Collected
Data concerning parasite prevalence, anthelmintic resistance and anthelmintic use are collected in the database. There is also provision for the import of climatic data because environmental conditions strongly influence the survival of the free-living larval stages of the parasites [31].
Many different parasites infect sheep in New Zealand. Some of these are more problematic than others. For example, Haemonchus contortus feeds on the blood of the sheep, whereas Teladorsagia circumcincta does not, consequently, infections with H. contortus are more commonly fatal to the sheep than are those with T. circumcincta. In general, H. contortus is more common in warmer regions, whereas T. circumcincta is common in temperate climates (Figure 2), but climate change and the alternating El Niño and La Niña conditions may influence the distribution of these and other parasite species. Prevalence data are collected in anticipation that any extension of the historical range of a parasite species might be identified.
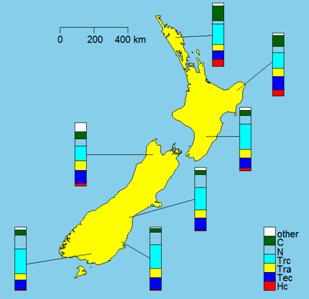
Figure 2. An example of the output from the Livestock Burden of Parasitism (LBP) database. The data shown are regional summaries of the prevalence of parasites of sheep [24] superimposed on a map of New Zealand. The data do not represent any one farm to avoid any possibility of causing farmers unnecessary concern. The species (key in the lower left of the map) are: Hc – Haemonchus contortus; Tec – Teladorsagia circumcincta; Tra – Trichostrongylus axei; Trc - Trichostrongylus colubriformis; N – Nematodirus spp.; C – Cooperia spp.; others includes Bunostomum spp., Chabertia spp. and Oesophagostomum spp
It is especially important to monitor anthelmintic resistance if the current anthelmintics are to be useful for as long as possible [17]. Unfortunately, field testing for resistance is not commonly carried out by individual farmers, but industry bodies, such as Meat and Wool New Zealand do collect data [27].
For individual farms data concerning the regime of anthelmintic usage are collected to ensure that those regimes that are especially successful can be identified and appropriately distributed.
User Interactions
Three levels of data input are possible: professional parasitologists and researchers have access that enables them to input highly detailed data; veterinarians can input typical clinical observations and may apply for a higher level of access should the need arise; and farmers and farm consultants can enter details relating to drenching regimes and any other observations they might make. By providing a variety of input options we intend to encourage as much use of the database as possible from all sectors of the industry. All data are checked, as much as is possible, for internal consistency and for any especially unusual data.
In general, data are output as regional summaries superimposed on maps, such as that shown in Figure 2. Individual farms are not identified, except at the highest level of access, because of the sensitivities of farmers and the potential for abuse of the data. It is possible to use the database to provide more detailed representations of the data. To avoid mapping easily recognisable property boundaries, we use Voronoi tesselations to delimit regions around the location of each datum [32]. These are easily generated in R and facilitate a clear graphical representation of the data (Figure 3).
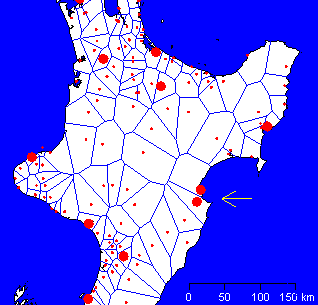
Figure 3. An example of the output from the Livestock Burden of Parastism (LBP) database. A map of the central North Island of New Zealand on which is superimposed a summary of FECRT results (red circles). The diameter of each circle indicates the apparent resistance to a specific anthelmintic. The Voronoi tesselations are also shown to provide an indication of the region represented by each datum. The arrow indicates a location that might warrant further investigation because of the proximity of two sites reporting resistance to the same anthlemintic. This map is only an example; the values do not represent the current situation.
Data Analysis
Several important questions can be addressed using the data collected. These can be considered in terms of time.
The immediate problem is whether there are regions in which anthelmintic resistance is especially common (sometimes called ‘resistance hotspots’). This involves identifying clusters [33], which is assisted using the representation shown in Figure 3. However, the data are multidimensional (at least three anthelmintics alone and in combination, location and/or climatic data, drenching regime and several parasite species, for example), and so thorough analysis requires more than the informal consideration that has been employed hitherto. The statistical power of R is invaluable in this respect.
The analysis of historical data (which are limited at present) enables the identification of patterns indicative of developing anthelmintic resistance and, potentially, any impact of developing climate change on the geographical distribution of parasites. Given sufficient longitudinal data parasitologists, veterinarians, farmers, farm consultants and industry organisations will eventually be able to work proactively rather than reactively. While the historical record may eventually be somewhat less relevant as non-chemical parasite control measures [12-15] become more common. By that time, the value of continued monitoring and the developing sophistication of the analysis will have been established.
Prediction of future trends and comparison of the predictions with data as they are collected are critical. This step provides an objective test of our understanding of the development of parasitism. The combination of the analysis of the immediate situation and of historical data is the only rational basis on which to make predictions and will eventually lead to the development of coherent models of parasite biology.
Discussion
The success of this resource requires the involvement of all stakeholders, including farmers, veterinarians, pharmaceutical companies, industry organisations and government. The cost of operating the database is minimal compared with the value of the industry (a technical salary and some costs associated with advertising, site maintenance and a sum to cover the cost of consultation), which we anticipate will be met by government and industry organisations, ideally with a contribution from the pharmaceutical companies that will benefit from the potential extension of the lifespan of their products and the goodwill arising from this service to the farming community.
Analogous large-scale databases concerning a range of other issues have been proposed and implemented previously [34-42]. The success of these databases provides confidence that the system we propose would also be very valuable. Much can be learnt from these examples, but there are issues specific to parasitism that would require consideration, such as the data needed. Moreover, there are many questions relating to data analysis that would have to be addressed: to provide data abstraction; situation analysis; advice formulation (at appropriate levels, including the ability to bring the situation to the attention of a human being); and global database analysis, which would comprise system for interrogating the database and providing graphical and numerical summaries for farmers, consultants, veterinarians, industry bodies and government.
Conclusions
The Livestock Burden of Parasitism database integrates a developing body of data that will be used to inform the effort to cope with parasitism. The concept could be applied anywhere in the world and data from the various databases could be combined to yield a broader picture should that be desirable. It represents a tool that could contribute to retarding the development of anthelmintic resistance, minimisation of anthelmintic use and would more underpin continuous monitoring.
References
1. Rowlands D.T., Anthelmintic resistance - can science win?, British Veterinary Journal, 1993, 149(2), p. 117-119.
2. Sibley C.H., Hunt S.Y., Drug resistance in parasites: can we stay ahead of the evolutionary curve?, Trends in Parasitology, 2003, 19(11), p. 532-537.
3. Waller P.J., Echevarria F., Eddi C., Maciel S., Nari A., Hansen J.W., The prevalence of anthelmintic resistance in nematode parasites of sheep in Southern Latin America: General overview, Veterinary Parasitology, 1996, 62(3-4), p. 181-187.
4. van Wyk J.A., Malan F.S., Randles J.L., How long before resistance makes it impossible to control some field strains of Haemonchus contortus in South Africa with any of the modern anthelmintics?, Veterinary Parasitology, 1997, 70(1-3), p. 111-122.
5. Kaplan R.M., Anthelmintic resistance in nematodes of horses, Veterinary Research, 2002, 33(5), p. 491-507.
6. Brady H.A., Nichols W.T., Drug resistance in equine parasites: an emerging global problem, Journal of Equine Veterinary Science, 2009, 29(5), p. 285-295.
7. Coles G.C., Cattle nematodes resistant to anthelmintics: why so few cases?, Veterinary Research, 2002, 33(5), p. 481-489.
8. Charlier J., Hoglund J., Samson-Himmelstjerna G., Dorny P., Vercruysse J., Gastrointestinal nematode infections in adult dairy cattle: impact on production, diagnosis and control, Veterinary Parasitology, 2009, 164(1), p. 70-79.
9. Pomroy W.E., Anthelmintic resistance in New Zealand: a perspective on recent findings and options for the future, New Zealand Veterinary Journal, 2006, 54(6), p. 265-270.
10. Waghorn T.S., Leathwick D.M., Rhodes A.P., Jackson R., Pomroy W.E., West D.M., Moffat J.R., Prevalence of anthelmintic resistance on 62 beef cattle farms in the North Island of New Zealand, New Zealand Veterinary Journal, 2006, 54(6), p. 278-282.
11. Waghorn T.S., Leathwick D.M., Rhodes A.P., Lawrence K.E., Jackson R., Pomroy W. E., West D.M., Moffat J.R., Prevalence of anthelmintic resistance on sheep farms in New Zealand, New Zealand Veterinary Journal, 2006, 54(6), p. 271-277.
12. Athanasiadou S., Kyriazakis I., Jackson F., Coop R. L., Effects of short-term exposure to condensed tannins of adult Trichostrongylus colubriformis, Veterinary Record, 2000, 146, p. 728-732.
13. Bisset S.A., Morris C.A., McEwan J.C., Vlassoff A., Breeding sheep in New Zealand that are less reliant on anthelmintics to maintain health and productivity, New Zealand Veterinary Journal, 2001, 49(6), p. 236-246.
14. Epe C., Holst C., Koopman R., Schnieder T., Larsen M., von Samson-Himmelstjerna G., Experiences with Duddingtonia flagrans administration to parasitized small ruminants, Veterinary Parasitology, 2009, 159, p. 86-90.
15. Molento M.B., Parasite control in the age of drug resistance and changing agricultural practices, Veterinary Parasitology, 2009, 163(3), p. 229-234.
16. McKellar Q.A., Ecotoxicology and residues of anthelmintic compounds, Veterinary Parasitology, 1997, 72, p. 413-435.
17. Leathwick D.M., Hosking B.C., Bisset S.A., McKay C.H., Managing anthelmintic resistance: Is it feasible in New Zealand to delay the emergence of resistance to a new anthelmintic class?, New Zealand Veterinary Journal, 2009, 57(4), p. 181-192.
18. Leathwick D.M., Miller C.M., Atkinson D.S., Haack N.A., Alexander R.A., Oliver A.-M., Waghorn T.S., Potter J.F., Sutherland I.A., Drenching adult ewes: implications of anthelmintic treatments pre- and post-lambing on the development of anthelmintic resistance, New Zealand Veterinary Journal, 2006, 54(6), p. 297-304.
19. Leathwick D.M., Waghorn T.S., Miller C.M., Atkinson D.S., Haack N.A., Oliver A.-M., Selective and on-demand drenching of lambs: impact on parasite populations and performance of lambs, New Zealand Veterinary Journal, 2006, 54(6), p. 305-312.
20. Leathwick D.M., Miller C.M., Atkinson D.S., Haack N.A., Waghorn T.S., Oliver A.-M., Managing anthelmintic resistance: untreated adult ewes as a source of unselected parasites, and their role in reducing parasite populations, New Zealand Veterinary Journal, 2008, 56(4), p. 184-195.
21. Waghorn T.S., Leathwick D.M., Miller C.M., Atkinson D.S., Brave or gullible: testing the concept that leaving susceptible parasites in refugia will slow the development of anthelmintic resistance, New Zealand Veterinary Journal, 2008, 56(4), p. 158-163.
22. McKenna P.B., An examination of the relative reliability of laboratory case submissions in determining the prevalence of anthelmintic resistance in sheep nematodes in New Zealand, and the possible influence of test analysis methodology on such data, New Zealand Veterinary Journal, 2008, 56(2), p. 55-59.
23. Bisset S.A., Helminth parasites of economic importance in cattle in New Zealand, New Zealand Journal of Zoology, 1994, 21, p. 9-22.
24. Vlassoff A., Leathwick D.M., Heath A.C.G., The epidemiology of nematode infections of sheep, New Zealand Veterinary Journal, 2001, 49, p. 213-221.
25. Vlassoff A., McKenna P.B., Nematode parasites of economic importance in sheep in New Zealand, New Zealand Journal of Zoology, 1994, 21, p. 1-8.
26. Leathwick D.M., Pomroy W.E., Heath A.C.G., Anthelmintic resistance in New Zealand, New Zealand Veterinary Journal, 2001, 49(6), p. 227-235.
27. Meat and Wool New Zealand, Monitor farm FECRT results, Wormwise, 9.
28. Ihaka R., Gentleman R., R: a language for data analysis and graphics, Journal of Computational and Graphical Statistics, 1996, 5(3), p. 299-314.
29. Pau G., hwriter: HTML writer - outputs R objects in HTML format. Comprehensive R Archive Network, Cambridge.
30. Becker R.A., Wilks A.R., Maps in S. AT&T Bell Laboratories.
31. Brown S., Simcock D.C., Neale J.D., Simpson H.V., The thermotolerance of some nematode parasites of sheep and the role of the sheath, Journal of Veterinary Parasitology, In press.
32. Aurenhammer F., Voronoi diagrams - a survey of a fundamental geometric data structure, ACM Computing Surveys, 1991, 23(3), p. 345-405.
33. Alon N., Dar S., Parnas M., Ron D., Testing of clustering, SIAM Review, 2004, 46(2), p. 285-308.
34. Bergquist N.R., A concept for the collection, consolidation and presentation of epidemiological data, Acta Tropica, 2001, 79, p. 3-5.
35. Gebre-Michael T., Malone J.B., Balkew M., Ali A., Berhe N., Hailu A., Herzi A.A., Mapping the potential distribution of Phlebotomus martini and P. orientalis (Diptera: Psychodidae), vectors of kala-azar in East Africa by use of geographic information systems, Acta Tropica, 2004, 90(1), p. 73-86.
36. Mabaso M.L.H., Appleton C.C., Hughes J.C., Gouws E., The effect of soil type and climate on hookworm (Necator americanus) distribution in KwaZulu-Natal, South Africa, Tropical Medicine and International Health, 2006, 8(8), p. 722-727.
37. Malone J.B., Gommes R., Hansen J., Yilma J.M., Slingenberg J., Snijders F., Nachtergaele F., Ataman E., A geographic information system on the potential distribution and abundance of Fasciola hepatica and F. gigantica in east Africa based on Food and Agriculture Organization databases, Veterinary Parasitology, 1998, 78(2), p. 87-101.
38. Polley L., Gaschler C., Gajadhar A., National occurrence reporting of Trichinella and trichinellosis using a computerized database, Veterinary Parasitology, 2000, 93, p. 351-363.
39. Ricòs C., Alvarez V., Cava F., García-Lario J.V., Hernández A., Jiménez C.V., Minchinela J., Perich C., Simón M., Current databases on biological variation: pros, cons and progress, Scandinavian Journal of Clinical and Laboratory Investigation, 1999, 59, p. 491-500.
40. Thomson A.J., Willoughby I., A web-based expert system for advising on herbicide use in Great Britain, Computers and Electronics in Agriculture, 2004, 42(1), p.43-49.
41. Tortorano A.M., Kibbler C., Peman J., Bernhardt H., Klingspor L., Grillot R., Candidaemia in Europe: epidemiology and resistance, International Journal of Antimicrobial Agents, 2006, 27(5), p. 359-366.
42. Yilma J.M., Malone J.B., A geographic information system forecast model for strategic control of fasciolosis in Ethiopia, Veterinary Parasitology, 1998, 78(2), p. 103-127.