The Detection of Shifts in Autocorrelated Processes with Moving Range and Exponentially-Weighted Moving Average Charts
Karin KANDANANOND
Faculty of Industrial Technology, Rajabhat University Valaya-Alongkorn, Thailand.
E-mail: kandananond@hotmail.com
(Corresponding author Tel: +66-2-529-3829; Fax: +66-2-909-3036)
Received: 20 March 2010 / Accepted: 13 December 2010/ Published: 24 December 2010
Abstract
The objective of this research is to select the appropriate control charts for detecting a shift in the autocorrelated observations. The autocorrelated processes were characterized using AR (1) and IMA (1, 1) for stationary and non-stationary processes respectively. A process model was simulated to achieve the response, the average run length (ARL). The empirical analysis was conducted to quantify the impacts of critical factors e.g., AR coefficient (f), MA coefficient (q), types of charts and shift sizes on the ARL. The results showed that the exponentially weighted moving average (EWMA) was the most appropriate control chart to monitor AR (1) and IMA (1, 1) processes because of its sensitivity. For non-stationary case, the ARL at positive q was significantly higher than the one at negative q when a shift size was small. If the performance of the statistical process control under stationary and non-stationary disturbances is correctly characterized, practitioners will have guidelines for achieving the highest possible performance potential when deploying SPC.
Keywords
Autoregressive; Empirical Analysis; Integrated Moving Average; Monte Carlo; Stationary Processes; Non-stationary Processes; Statistical Process Control
Introduction
Statistical process control (SPC) is a procedure which focuses on process monitoring and control by separating common causes from assignable causes [1]. Common causes are the source of variation that is inherent in the process and cannot be eliminated when the process is in statistical control, while assignable cause variation is unpredictable but can be easily detected and removed. The traditional tools of SPC are Shewhart control charts, which are based on the assumptions that all processes are in-control and observations are independent [2]. However, because of the advanced measurement technology and shortened sampling interval, the independence of each observation has been violated in many scenarios, especially in continuous process industries, e.g., chemical process. The lack of independence among each sample always comes in the form of serial correlation, which can be either positively or negatively correlated [3]. This behavior of process outputs will significantly downgrade the performance of control charts [4]. As a result, the control limits of control charts will be narrower than what they should be and might signal false alarms more frequently. The consequence is the unnecessary investigation, which consumes a lot of time and money.
Therefore, several authors point out that the traditional charts fail to control and improve the quality of correlated processes (Jiang et al. [5], Loredo et al. [6] and Zhang [7]).
Literature Review
According to MacCarthy and Wasusri [8], SPC was a powerful tool to monitor and control processes and had been widely used in the manufacturing and non-manufacturing processes since it was first introduced by Walter A. Shewhart in 1924. The application of SPC control charts was classified into four categories: process monitoring, planning, evaluating customer satisfaction and forecasting. Among these categories, process monitoring was considered the traditional use of SPC tools in order to stabilize and improve the process capability, while the utilization of SPC for the purpose of scheduling and satisfactory evaluation seemed to be increasingly popular. However, the relationship between the statistical control and forecasting was different from the above three categories in the sense that forecasting techniques were deployed in order to improve the capability of the SPC, since control charts only worked effectively when the sampled data followed all the underlying assumptions (independent and normally distributed). These charts would immediately lack the robustness when the observations violated the conditions, and the problem was that most industrial processes are continuous and correlated. When the data was highly correlated, the traditional charts would signal the high rate of false alarms.
Deming [9] stated that the effort to adjust a stable (in-control) process in order to compensate for an undesirable disturbance tampered the process and led to more variation, so it was better to leave the process alone. Nonetheless, if the process was left uncontrolled, the process output was stationary with highly correlated data, or non-stationary due to disturbances. This might cause the process mean to wander from the desired target. As a result, forecasting models were integrated with the traditional SPC tools, since they had the capability to describe the correlation structure of the data (Loredo, et al., [6]). Jiang et. al. [5] reported the success of the integration between SPC control charts and the autoregressive integrated moving average (ARIMA), which was a class of forecasting models for monitoring correlated observations. Loredo, et al. [6] also supported that ARIMA was powerful as a tool for improving the ability of control charts to monitor correlated processes.
ARIMA model was first introduced by Box and Jenkins [10] as a stochastic difference equation that can model stochastic disturbances. This equation was used to forecast one-step ahead disturbances, according to data characteristics of stationary or non-stationary as shown in equation (1).
|
∆dYt = μ + f1∆dYt-1 + f2∆dYt-2 +…+ fp∆dYt-p + at – θ1at-1 - … - θqat-q |
(1) |
The ARIMA (p, d, q) model indicates
p as the order of the autoregressive part, d as the amount of
difference and q as the order of the moving average part. Mostly,
stationary disturbances are modeled using the autoregressive order one, ARIMA
(1, 0, 0) or AR (1) while integrated moving average, ARIMA (0, 1,
1) or IMA (1, 1) are used to represent non-stationary disturbances,
as recommended by Montgomery et al., [11] and Box and Luceno [12]. The ARIMA
model was considered a powerful method to solve the correlation problem,
especially when it was applied to improve the capability of control charts to
monitor the autocorrelated processes. The application of an ARIMA model
to SPC was reported by Lu and Reynolds [13]. Autocorrelated observations
were characterized by an ARIMA model and an exponentially weighted
moving average (EWMA) chart was utilized to monitor the residuals, based
on the ARIMA model forecast values. Similarly, English et al. [14]
compared the performance of ![]() and EWMA charts under an autocorrelated
process. However, the method to select the most appropriate forecasting model
and control charts to monitor the correlated data when there was a shift was
still a widely discussed issue among many authors.
and EWMA charts under an autocorrelated
process. However, the method to select the most appropriate forecasting model
and control charts to monitor the correlated data when there was a shift was
still a widely discussed issue among many authors.
For this reason, if the performance of the combined techniques is known, practitioners will have guidelines for achieving the highest capability when deploying SPC and ARIMA model.
Material and Method
The basis of the analysis in this paper was a mathematical model used to characterize process autocorrelation effects on the statistical process control system performance. The autocorrelation was categorized into two cases: stationary and non-stationary disturbances. The stationary disturbances were represented in the form of autoregressive order one model, AR (1), while the non-stationary ones were characterized by integrated moving average model, IMA (1, 1). Process disturbances were controlled by adjusting the level of autocorrelation coefficients (Φ or q). Moreover, the situation could be more complicated when a shift occurring in the autocorrelated process. The autocorrelated process used was a continuous process with only one quality characteristic, represented by Y. The process model used in this research was concluded in the following schematic diagram (Figure. 1).

Figure 1. Process Model
As a shift occurred in the process, the moving range (MR) and exponentially weighted moving average (EWMA) charts were utilized to monitor the individual measurement of process mean to detect a shift. The evaluation of the control chart performance was measured by considering the average run length (ARL) which was the average number of points plotted before a point indicated an out-of-control state. The schematic presentation of the process model was shown in Figure. 1. The observation of a process was considered from period 1 to 100 (t = 1, 2, 3...100) and the process output (Yt+1) was equal to:
|
Yt+1 = T + Nt+1 + δ(t) |
(2) |
The source of stationary autocorrelation was characterized by the autoregressive order one, AR (1), as follows:
|
Nt+1 = fNt + at+1, -1 < f < 1 |
(3) |
On the other hand, the integrated moving average model, IMA (1, 1) was utilized to represent non-stationary disturbances as follows:
|
Nt+1 = Nt + at+1 – θat, -1 < q < 1 |
(4) |
where Nt+1, Nt are disturbances at time t+1 and t respectively, at+1, at are random errors at time t+1 and t respectively, f is the autoregressive (AR) parameter and q is the moving average (MA) parameter.
After an assignable cause occurred in the process, a shift of size d0 in the form of a step function was injected into a process as:
|
|
(5) |

where d0 is the magnitude of a shift, t0 is the time that a shift occurs.
The observations were monitored by a Shewhart moving range (MR) chart and an exponentially weighted moving average (EWMA) chart. The control limits for a moving range chart were:
|
|
(6) |

where ![]() is the process mean and equals
is the process mean and equals ![]() , MR = |Yt
- Yt-1|,
, MR = |Yt
- Yt-1|, ![]() is the average of moving average, d2
= 1.128 (the moving range of n = 2 observations).
is the average of moving average, d2
= 1.128 (the moving range of n = 2 observations).
For an EWMA chart, the control limits were expressed as:
|
|
(7) |

where m0 is the average of preliminary data, L is the width of control limits, l is the weight assigned to the observation. The values of L and l used were recommended by Lucas and Saccucci [15].
Experimental Procedures
For stationary case, the selected factors to be investigated were AR parameters (f), shift sizes and types of control charts. The response was average run length (ARL). Since the factorial design 2k was used to empirically analyze the relationship between input factors and response, f were set to -1 and 1 for low and high values respectively. Additionally, shift sizes of 0.5 sa and 3.5 sa were deployed to represent small and large shifts. Two types of control charts, a Shewhart moving range (MR) chart and an exponentially weighted moving average (EWMA) chart, were used in order to monitor processes. In conclusion, each factor was set to high and low levels as shown in Table 1.
Table 1. Input Factors and Levels (Stationary Case)
|
Factor |
Low |
High |
|
A (AR parameter; f) |
-1 |
1 |
|
B (Types of charts) |
MR |
EWMA |
|
C (Shift size) |
0.5sa |
3.5sa |
The input factors and their levels for non-stationary case were shown in Table 2.
Table 2. Input Factors and Levels (Non-stationary Case)
|
Factor |
Low |
High |
|
A (MA parameter; q) |
-1 |
1 |
|
B (Types of charts) |
MR |
EWMA |
|
C (Shift size) |
0.5sa |
3.5sa |
Regarding the simulation, each run was composed of 10,000 iterations which have been accomplished using Palisade’s @Risk® Version 5.5. The random errors (at) from each period were simulated by following normal distribution with zero mean and a constant variance as: at ~ N(0, σa2). The simulation results and the analysis of ARL response for each case were shown in the following section.
Results and Discussions
A factor screening experiment was designed using a statistical package, Design Expert® Version 8.0, to analyze the effect of the autocorrelation and other factors on the responses. The analysis of variance (ANOVA) and the half-normal plot were utilized to reveal the significant factors and their interactions. The analysis was categorized into two cases as follows:
Case 1: AR (1)
The design matrix for the stationary case was shown in Table 3.
Table 3. ARL response (Stationary Case)
|
Run |
f |
Shift |
Chart |
ARL |
|
1 |
-1 |
0.5 |
MR |
46.4278 |
|
2 |
1 |
0.5 |
MR |
2.7242 |
|
3 |
-1 |
3.5 |
MR |
43.304 |
|
4 |
1 |
3.5 |
MR |
1.3198 |
|
5 |
-1 |
0.5 |
EWMA |
1.6502 |
|
6 |
1 |
0.5 |
EWMA |
1.8863 |
|
7 |
-1 |
3.5 |
EWMA |
1.1673 |
|
8 |
1 |
3.5 |
EWMA |
1.2164 |
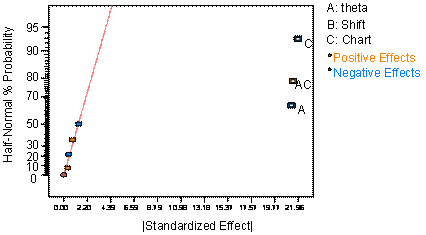
Figure 2. Half-normal Plot (Stationary Case)
The half-normal plot (Figure 2) and analysis of variance (ANOVA) in Table 4 showed that type of chart (C), AR model coefficients (A) and their interaction (AC) contributed the significant effects on the ARL. The interaction plot AC in Figure. 3 signified that there was no difference for the ARL when EWMA chart was deployed to monitor processes. However, if the selected chart was MR, the ARL at f = -1 was significantly higher than the one at f = +1.
Table 4. ANOVA (Stationary Case)
|
Source |
SS |
Df |
MS |
F |
p-value |
|
Model |
2800.446 |
3 |
933.482 |
601.6436 |
< 0.0001 |
|
A-f |
911.7005 |
1 |
911.7005 |
587.6051 |
< 0.0001 |
|
C-Chart |
964.8258 |
1 |
964.8258 |
621.8452 |
< 0.0001 |
|
AC |
923.9196 |
1 |
923.9196 |
595.4805 |
< 0.0001 |
|
Residual |
6.206212 |
4 |
1.551553 |
|
|
|
Total |
2806.652 |
7 |
|
|
|
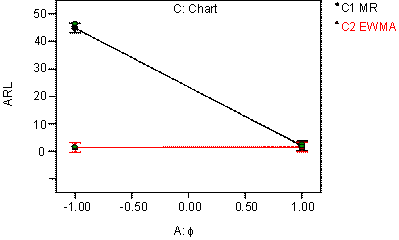
Figure 3. Interaction Plot (AC)
Case 2: IMA (1, 1)
The design matrix for the non-stationary case was shown in Table 5.
Table 5. ARL response (Non-stationary Case)
|
Run |
q |
Shift |
Chart |
ARL |
|
1 |
-1 |
0.5 |
MR |
2.3325 |
|
2 |
1 |
0.5 |
MR |
5.4765 |
|
3 |
-1 |
3.5 |
MR |
1.3765 |
|
4 |
1 |
3.5 |
MR |
1.3185 |
|
5 |
-1 |
0.5 |
EWMA |
1.3589 |
|
6 |
1 |
0.5 |
EWMA |
2.8043 |
|
7 |
-1 |
3.5 |
EWMA |
1.1572 |
|
8 |
1 |
3.5 |
EWMA |
1.0252 |
After applying the natural logarithm transformation to the response ARL, the ANOVA and the half-normal plot were utilized to reveal the significant factors and their interactions as shown in Figure 4 and Table 6 respectively.
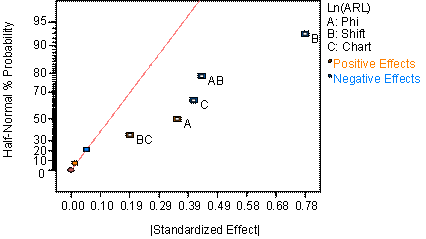
Figure 4. Half-normal Plot (Non-stationary Case)
Table 6. ANOVA (Non-stationary Case)
|
Source |
SS |
Df |
MS |
F |
p-value |
|
Model |
2.255698 |
5 |
0.45114 |
158.6599 |
0.0063 |
|
A-Phi |
0.249868 |
1 |
0.249868 |
87.87516 |
0.0112 |
|
B-Shift |
1.215479 |
1 |
1.215479 |
427.4682 |
0.0023 |
|
C-Chart |
0.334041 |
1 |
0.334041 |
117.4778 |
0.0084 |
|
AB |
0.379394 |
1 |
0.379394 |
133.4279 |
0.0074 |
|
BC |
0.076916 |
1 |
0.076916 |
27.05043 |
0.0350 |
|
Residual |
0.005687 |
2 |
0.002843 |
|
|
|
Total |
2.261385 |
7 |
|
|
|
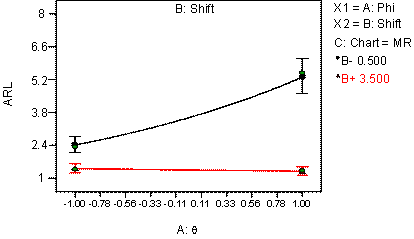
Figure 5. Interaction Plot (AB) for MR chart
According to Figure 5 and 6, there was no difference for the ARL when the shift size was large (3.5). However, for small shift size, the ARL at q = -1 was significantly lower than the one at q = +1.
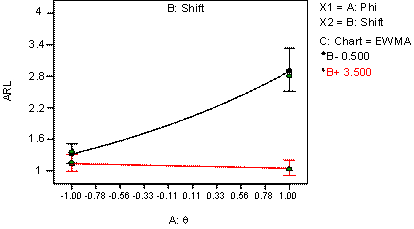
Figure 6. Interaction Plot (AB) for EWMA chart
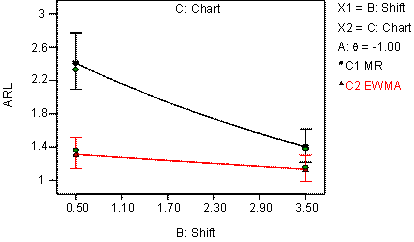
Figure 7. Interaction Plot (BC) for q = -1.00
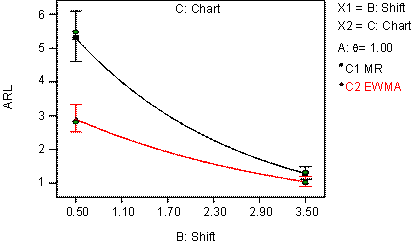
Figure 8. Interaction Plot (BC) for q = +1.00
According to Figure 7, the MR chart was sensitive to small shift size, since its ARL at shift = 3.5 was lower than the one at shift = 0.5. However, there was no significant different for the ARL when the EWMA chart was utilized. Due to Figure 8, the above conclusion was still valid when q was positive (+1).
Conclusions
This research focused on the performance analysis of a statistical process control system in order to quantify the effects of the selected factors on stationary and non-stationary processes. According to the analysis, the effects of AR parameter (f), MA parameters (q), appropriate types of control charts and shift sizes on the ARL have been determined. In summary, the above analysis was concluded as follows:
1. For both stationary and non-stationary cases, the performance of the SPC to minimize ARL will be significantly improved if an EWMA chart is utilized to monitor the observations. Moreover, when the shift size is large (3.5), the ARL is significantly higher than the one at small shift size (0.5).
2. When the observations follows IMA (1, 1) pattern and shift size is small, the ARL at q = +1 is significantly higher than the one at θ = -1.
The analysis performed in this research has suggested essential guidelines to implement the SPC effectively.
References
1. Ferrer-Riquelme A. J., Statistical Control of Measures and Processes, Chemical and Biochemical Data Analysis , 2009, 1, p. 97-126.
2. Humana S.W., Chakrabortib S., Smit F., Shewhart-type control charts for variation in phase I data analysis, Computational Statistics & Data Analysis, 2010, 54(4), p. 863-874.
3. Duchesne P., Li L., Vandermeerschen J., On testing for serial correlation of unknown form using wavelet thresholding, Computational Statistics & Data Analysis, 2010, 54(11), p. 2512-2531.
4. Fleischer J., Lanza G., Schlipf M., Statistical quality control in micro-manufacturing through multivariate μ-EWMA chart, CIRP Annals-Manufacturing Technology, 2008, 57(1), p. 521-524.
5. Jiang W., Tsui K.L., Woodall W.H., A New SPC Monitoring Method: The ARMA Chart, Technometrics, 2000, 42(4), p. 399-410.
6. Loredo E.N., Jearkpaporn D., Borror C.M., Model-based control chart for autoregressive and correlated data, Quality and Reliability Engineering International, 2002, 18, p. 489-496.
7. Zhang N.F., A statistical control chart for stationary process data, Technometrics, 1998, 40(1), p. 24-38.
8. MacCarthy B.L., Wasusri T., A review of non-standard applications of statistical process control (SPC) charts, International Journal of Quality & Reliability Management, 2002, 19(3), p. 295-320.
9. Deming W.E., Out of the Crisis, Cambridge, MIT/CAES, 1998.
10. Box G.E.P., Jenkins G.M., Time Series Analysis: Forecasting and Control, San Francisco, Holden-Day, 1970.
11. Montgomery D.C., Keats J.B., Runger G.C., Messina W.S., Integrating Statistical Process Control and Engineering Process Control, Journal of Quality Technology, 1994, 26(2), p. 79-87.
12. Box G.E.P., Luceno A., Statistical Control by Monitoring and Feedback Adjustment, John Wiley & Sons, New York, 1997.
13. Lu C.W., Reynolds M.R., EWMA Control Charts for Monitoring the Mean of Autocorrelated Processes, Journal of Quality Technology, 1999, 31(2), p. 166-188.
14.
English J.R., Lee S.C., Martin T.W., Tilmon C., Detecting
Changes in Autoregressive Processes with ![]() and EWMA Charts, IIE Transactions, 2004,
32(12), p. 1103-1113.
and EWMA Charts, IIE Transactions, 2004,
32(12), p. 1103-1113.
15. Lucas J.M., Saccucci M.S., Exponentially Weighted Moving Average Control Schemes: Properties and Enhancements, Technometrics, 1990, 32(1), p. 1-12.