Effect of Some Process Variables on Nickel Electroplating of Low Carbon Steel
Daniel OLORUNTOBA1, Oghenedoro EGHWUBARE1, Oluleke OLUWOLE 2*
1Department of Metallurgical and Materials Engineering,Federal University of Technology, Akure, Nigeria
2Department Of Mechanical Engineering,University of Ibadan,Nigeria
E-mail: lekeoluwole@gmail.com
*Corresponding author: Tel: +234(0)8033899701
Received: 1 September 2010 / Accepted: 13 May 2011 / Published: 25 June 2010
Abstract
This research work investigated the effect of current density, bath concentration, bath solution volume and electroplating time on nickel electroplating of low carbon steel. Varying voltage between 0.3 and 0.8 V, bath concentration between 0.27 g/cm3 (0.79 mol/dm3) and 0.35 g/cm3 (1.02 mol/dm3), electroplating time between 10 and 30 minutes and bath solution volume between 200 and 700 cm3, the effect of these process variables on electroplating was studied. The temperature was kept in conformity with Watt’s method at 50 ±5°C. It was observed that a bath concentration of 0.31 g/cm3 (0.89 Mol/dm3) concentration gave the best nickel deposit at 0.5V for 15 minutes. This would correspond to a Watt solution of composition: nickel sulphate-230 g/l, nickel chloride-46.5 g/l and boric acid-30.8 g/l with a pH of 4.18. Higher Watt bath concentration did not yield good results as plating thickness decreased and there was no luster. It was also observed that increasing time of plating served to increase plating thickness and did not affect brightness of plating. However non-uniform nickel deposition was observed for longer plating time. Increase in voltage served to increase rate of electrodeposition with the exceptions of 0.7 V where a long streak of plating was observed on substrate instead of uniform plating and 0.8V where plating lacked brightness having a burnt appearance. Bath volumes of between 200-500 cm3 were observed to be best for the coupons used (15mm × 20mm). Bath volumes above 500cm3 gave black plating appearance.
Keywords
Process Variables; Nickel Electroplating; Low Carbon Steel.
Introduction
Metal plating is the method of applying a metallic coating to another material [1]. There are many reasons to plate objects. These reasons include corrosion control, resistance to wear and decorative purposes [2]. Over recent decades, metal plating has evolved from an art to an exact science [3-5]. This development is seen as responsible for the ever-increasing number and widening types of application of this branch of practical science and engineering [6]. Some of the technological areas in which means and methods of metal plating constitute an essential component are; all aspects of electronics (Macro and micro, optics, opto-electronics and sensor of most types), oil and gas installation, industrial and engineering materials, auto-mobile industry (that uses for example chrome plating to enhance the corrosion resistance of metal parts), agro-allied industry, aeronautical industry, to name only a few [7].
Nickel plating is widely used in industry especially as zinc coating does not last because of its behaviour as sacrificial anode. Research has been stimulated in the area of Nickel plating [8], its speciation [9], stripping voltammetry [10] and its possible use as catalyst in the oxidation of cyclohexanol in alkaline solutions [11]. However, the study of effect of the plating parameters such as pH of the electrolyte, concentration of the electrolyte, temperature of the plating medium, current density, time of plating, current density(using electro potentials) of the electrodes, size of the material to be plated and the volume of the plating bath need be given an important attention [7]. The purpose of this project is to study the effect of some of these process variables on low-voltage electrodepositing of nickel on low carbon steel substrate. This will enhance the engineer to have a formal knowledge on when and how to apply a particular concentration for a particular purpose such as in corrosion control, decorative purpose and wear resistance. The intention is to vary the concentration of each of the salt to be used in each solution.
Materials and Method
Material
The material used in this investigation was a low carbon steel substrate rod of dimension 1m × 20mm, which was obtained from Nigeria Machine Tools limited, Osogbo, Nigeria. The chemical composition of the steel is shown in Table 1.
Table 1. Chemical Composition (Wt%) of Low Carbon Steel Substrate
|
Elements |
Wt% |
|
C |
0.18 |
|
Si |
0.18 |
|
S |
0.031 |
|
P |
0.038 |
|
Cu |
0.23 |
|
Cr |
0.1 |
|
Sn |
0.008 |
|
V |
0.006 |
|
Fe |
99.312 |
Method
Preparation of Samples
The low carbon steel substrate was sectioned into smaller pieces of dimension 15mm × 20mm. The samples were grinded and later polished on a METASERVE grinder/polisher with 60, 120, 220, 320, 400, 600 micron grade carbide and cloth and kept in the desiccators preparatory to electroplating.
Preparation of Nickel Electroplating Solution
The nickel electroplating solution was prepared in conformity with Watt’s methods [6] in which chemical reagents include nickel sulphate, nickel chloride, boric acid and formaldehyde as the brightener [2]. The chemical reagents composition in the solution were varied by weighing each proportion in the weighing balance and then dissolved in a specified volume of distilled water. The pH of the solution was taken using a HANNA pH meter. The varying concentrations are presented in Table 2.
Preparation of Nickel Electroplating Bath
Plastic bowl was used as the bath to contain the prepared electroplating solution. Copper rod of 6mm diameter was used as a cathode and anode electrode attachment to the rectifier. Copper wire was also used to attach the nickel electrode to the anode rod. The arrangement of the bath is in Watt’s standard [6].
Samples Pre-Treatment Operation
The samples were pickled in 0.5M H2 SO4 solution for 2 minutes, rinsed in distilled water and degreased in electrolytic degreasing tank for another 2 minutes. This was followed by another rinsing in distilled water. The initial weights of the samples were taken before immersion into electroplating bath using an OHAUSR digital weighing machine.
Electroplating Operation
Electroplating runs were carried out for the low carbon steel samples using different bath concentrations shown in Tables 1 and 2 by immersing the samples for constant time of 15 minutes at a temperature of 50 ±5°C; 2cm3 of formaldehyde was added into the solution in the electroplating bath. Voltage was kept constant as well at 0.5V. After electroplating, the sample was rinsed in distilled water and dried in saw dust before the final weighing. The final dimension was taken by the use of the vernier callipers. The plating was also carried out for time, voltage and bath volume variations (Tables 4-6).
Visual Observation
The electroplated samples were observed for physical appearance as in colour, brightness and streak. These were reported in Tables 3-6.
Electrodepositing Weight and Thickness Determination
The initial weights of the samples were subtracted from the final weight of the electroplated samples and the results were then recorded. Also, the initial dimensions were subtracted from the final dimensions of the electroplated samples. The values obtained from weight difference and from dimension difference were used in evaluating both the actual weight deposited per unit area and the thickness of deposition.
Mathematically, If W1= Weight of sample before electroplating, W2 = Weight of sample after electroplating, WD = Electrodeposited weight, then
|
WD =W2 - W1 |
(1) |
Also, if A1 = Area of sample before electroplating. A2 = area of sample after electroplating.
|
AD = A2 - A1 |
(2) |
Therefore the actual electrodeposited weight in g/cm2 was calculated by dividing equation (1) by equation (2); That is; Actual electrodeposited weight (g/cm2) = W2-W1/A2-A1=WD/AD The thickness of electrodeposited were also calculated as thus The thickness of electrodeposited in micron = WD/ (AD×DNi) Where DNi = density of nickel given as 8.908 g/cm2 [6].
Surface Macrographic Examination
The surface examination of the nickel electroplated samples was carried out on an AxiovertR optical metallurgical microscope with magnification ×100.
Results and Discussion
Results
Table 2 shows the composition of the various nickel baths in 600 cm3 distilled water.
Table 2. Composition for Various Nickle Electroplasting Bath Per 600cm3
|
|
Solution 1 |
Solution 2 |
Solution 3 |
Solution 4 |
Solution 5 |
|
NiSO4 |
120.00g |
132.00g |
138.00g |
150.00g |
156.00g |
|
NiCl2 |
24.54g |
27.00g |
27.90g |
30.69g |
31.91g |
|
Boric Acid |
16.37g |
18.00g |
18.45g |
20.46g |
22.08g |
|
pH |
4.34 |
4.20 |
4.18 |
4.13 |
4.11 |
|
Concentration Mol/dm3 |
0.78 |
0.86 |
0.89 |
0.98 |
1.02 |
|
Concentration g/cm3 |
0.27 |
0.30 |
0.31 |
0.34 |
0.35 |
Table 3 shows the weight, thickness and physical appearance of deposited nickel on low carbon steel for varying concentrations. It was seen that weight of nickel deposit increased with increasing bath solution concentration starting from 0.27g/cm3 and peaking at 0.31g/cm3 after which weight of deposition began to fall with increasing bath concentration. At a plating concentration of 0.35 g/cm3 (1.02 Mol/dm3) the deposited nickel had a blackened appearance.
Table 3. Weight, Thickness and Physical Appearance of Deposited Nickel on Low Carbon Steel for Varying Concentrations
|
S/N |
Concentration(g/cm3) |
Deposition Appereance |
Thickness(µm) |
Deposition weight(g) |
|
1 |
0.27 |
Dull bright |
4.68 |
0.04 |
|
2 |
0.30 |
Fairly bright |
5.10 |
0.04 |
|
3 |
0.31 |
Very bright |
5.13 |
0.05 |
|
4 |
0.34 |
Very bright |
4.78 |
0.04 |
|
5 |
0.35 |
Black |
4.76 |
0.04 |
|
Experimental Condition for Tables 3-6 Added Formaldehyde=2 cm3 (common for all experiment) Time=15 minutes for constant time experiments Temperature=45-55°C (common for all experiments) Voltage=0.5 Volts for constant voltage experiments Concentration=0.89 Mol/dm3 for constant concentration experiments |
||||
Table 4 shows the weight, thickness and physical appearance of deposited nickel on lowcarbon steel for varying deposition time at a constant concentration of 0.31g/cm3 (0.89mol/dm3). It was seen that nickel deposition increased with increasing time. The deposits were also bright in appearance.
Table 4. Weight, Thickness and Physical Appearance of Deposited Nickel on Low Carbon Steel for Varying Deposition Time at constant concentration 0f 0.89Mol/dm3
|
S/N |
Deposition Time (min) |
Deposition Appereance |
Thickness (µm) |
Deposition weight (g) |
|
1 |
10 |
Black |
4.68 |
0.04 |
|
2 |
15 |
Bright |
5.10 |
0.04 |
|
3 |
20 |
Bright |
5.15 |
0.05 |
|
4 |
25 |
Bright |
6.87 |
0.06 |
|
5 |
30 |
Bright |
9.36 |
0.08 |
Table 5 shows the weight, thickness and physical appearance of deposited nickel on low carbon steel for varying voltages. It was seen that despite the fact that nickel deposit increased with increasing electroplating voltage, plating voltages of 0.3 to 0.6 gave bright nickel deposit appearance. Plating at 0.7 and 0.8 Volts gave blackened deposits.
Table 5. Weight, Thickness and Physical Appearance of Deposited Nickel on Low Carbon Steel for Varying current densities.
|
S/N |
Voltage (volts) |
Deposition Appereance |
Thickness (µm) |
Deposition weight (g) |
|
1 |
0.3 |
Bright |
4.58 |
0.04 |
|
2 |
0.4 |
Bright |
4.96 |
0.05 |
|
3 |
0.5 |
Dark(Black) |
5.15 |
0.06 |
|
4 |
0.6 |
Burnt |
6.18 |
0.08 |
|
5 |
0.7 |
Dark(Black) |
8.19 |
0.10 |
|
6 |
0.8 |
Burnt |
12.0 |
0.15 |
Table 6 shows the weight, thickness and physical appearance of deposited nickel on low carbon steel for varying bath volume. It was seen that despite the fact that nickel deposit increased with increasing bath solution volume, only bath volumes of 200 cm3 to 400 cm3 gave bright nickel deposit appearance. Using bath solution volumes from 500 to 700 cm3 gave blackened deposits.
Table 6. Weight, Thickness and Physical Appearance of Deposited Nickel on Low Carbon Steel for Varying Bath Volume
|
S/N |
Concentration (g/cm3) |
Deposition Appeareance |
Thickness (µm) |
Deposition weight (g) |
|
1 |
200 |
Dull bright |
4.78 |
0.04 |
|
2 |
300 |
Bright |
4.81 |
0.05 |
|
3 |
400 |
Very bright |
4.99 |
0.05 |
|
4 |
500 |
Black |
5.21 |
0.06 |
|
5 |
600 |
Black |
5.29 |
0.07 |
|
6 |
700 |
Black |
5.31 |
0.08 |
The results from the tables were used to plot the graphs shown in Figure 1-8.
Figures 1 and 2 are the plots of thickness and weight respectively of nickel deposited at varying concentration. The figures showed that at a bath concentration of 0.89 Mol/dm3, nickel deposited was highest.
Figure 1. Plot of thickness (µm) of nickel deposited against varying composition at experimental condition of 15min, 50±5°C and 0.5V
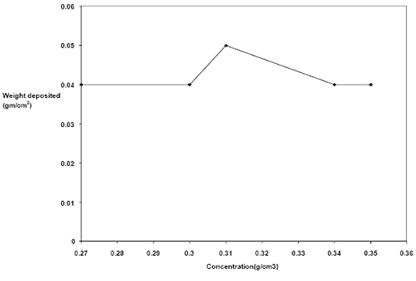
Figure 2. Plot of weight (g) of nickel deposited against concentration at experimental condition of 15min, 45-55°C and 0.5 V
Figures 3 and 4 are the plots of thickness and weight respectively of nickel deposited against time. The figures showed a continued increase in nickel deposit with increasing electroplating time.
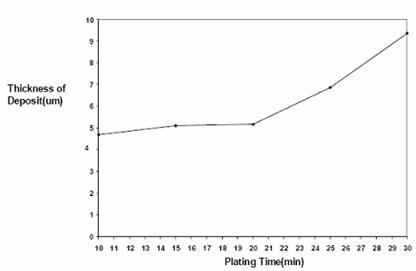
Figure 3. Plot of thickness (µm) of nickel deposited against time of deposition at 45-55° C,0.5 V and 0.89 mol/dm3
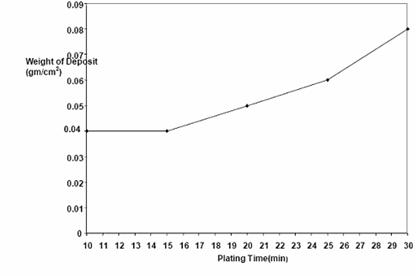
Figure 4. Plot of weight (g) of nickel deposited against time at 45-55°C, 0.5V and 0.89 mol/dm3
Figures 5 and 6 are the plot of thickness and weight respectively of nickel deposited on low carbon steel against voltage. The figures showed an increase in nickel deposit with increasing electroplating voltage.
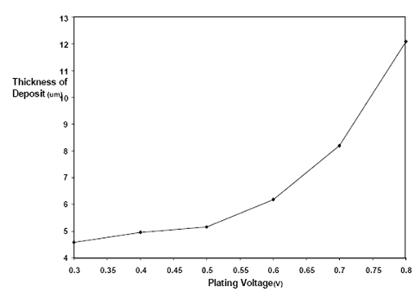
Figure 5. Plot of thickness (µm) of nickel deposited against voltage for 0.31 g/cm3 (0.89mol/dm3) concentration at 45-55°C
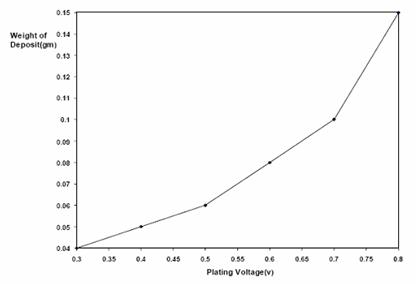
Figure 6. Plot of weight (g) of nickel deposited against voltage at 45-55°C and 0.89 mol/dm3
Figures 7 and 8 are the plots of thickness and weight respectively of nickel deposited on low carbon steel with increasing bath solution volume. The figures also showed increasing nickel deposition with increasing bath solution volume.
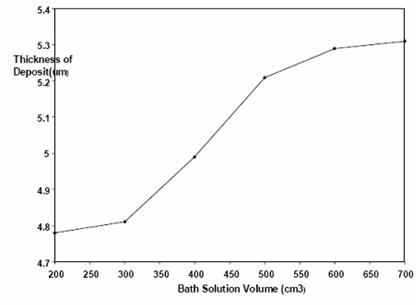
Figure 7. Plot of thickness of nickel deposited against volume at 45-55°C, 0.5V, 0.89 mol/dm3 and electroplating time of 15 min
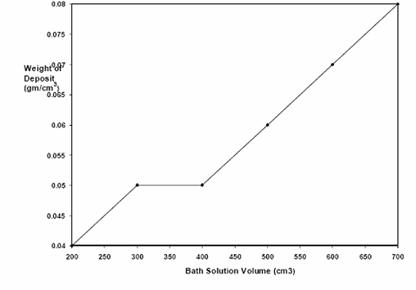
Figure 8. Plot of weight of nickel deposited against volume at 45-55°C,0.5V, 0.89 mol/dm3 and electroplating time of 15 min
Figures 9-12 show photomacrographs of deposited nickel on low carbon steel for 0.3, 0.4, 0.5 and 0.6 voltages respectively at constant deposition time of 15 minutes. The figures show increasing deposition on the low carbon steel substrate with increasing plating voltage. Figure 13 shows the sample plated at 0.5V for 20 minutes. This shows very thick nickel plating on the steel substrate but non-uniform nickel deposition.
Figure 9. Photomacrograph of electrodeposited nickel on low carbon steel for 15 min,
45-55°C, 0.3 V at 0.89 mol/dm3 bath concentration ×100

Figure 10. Photomacrograph of electrodeposited nickel on low carbon steel for 15 min,
45-55°C, 0.4 V at 0.89 mol/dm3 bath concentration ×100

Figure 11. Photomacrograph of electrodeposited nickel on low carbon steel for 15 minutes,
45–55°C, 0.5V in 0.89 Mol/dm3
Figure 12. Photomacrograph of electrodeposited nickel on low carbon steel for 15 min,
45-55°C, 0.6 V at 0.89 mol/dm3 bath concentration ×100
Figure 13. Photomacrograph of electrodeposited nickel on low carbon steel for 20 min,
45-55°C, 0.5 V at 0.89 mol/dm3 bath concentration ×100
Discussions
Effect of Concentration on Plating
Generally, nickel plating, observed to be affected by the concentration of the nickel electroplating solution as shown in Figures 1 and 2 can be attributed to the rate of ionic activity in the bath solution. It was observed that at concentration of 0.31 g/cm3 (0.89 Mol/dm3), the nickel deposition per unit area was at the highest value, while between 0.27 - 0.30 g/cm3 and 0.34 – 0.35 g/cm3 the deposition per unit area is constant. This showed that despite the fact that all the concentrations were well within Watt’s solution ratio [6], with the exception of the 0.78 Mol/dm3 solutions, the 0.89 Mol/dm3 solution gave the best uniform nickel deposition on the steel substrate (Figure 11). This is in line with literature that at certain concentration of electroplating solution, there is a good uniform deposition [6].
Effect of Time on Plating
Time effect on electroplating as shown in Table 4 and in Figures 3 and 4 revealed that plating thickness increased with increasing time and time did not seem to have a deleterious effect on plating. This is in line with Faraday’s second law of electrolysis [6]. Coating brightness was not affected by time as well. However, surface topography seemed to roughen with high plating time as was observed in figures 14 and 15.
Effect of Current density on Plating
Increased voltage (potential difference) was also observed to aid faster deposition of nickel which is expected from the power equation, P= ivt, where i is the current flow, v is the voltage and t is time. However, as expected also the excess heat generated at high voltage without adequate heat extraction route could be attributed to the burnt or darkening of the nickel deposit at 0.8 V at least for a bath volume of 600 cm3.
Effect of Bath Solution Volume on Plating
Volume of electroplating solution observed to result in increase rate of nickel deposition (Figures 7 and 8) can be adduced to higher bath ionic activity. However, with high bath volume: sample ratio there was a resultant blackening of the deposited nickel which was still a result of power generated.
Conclusions
The effect of current density, concentration, time and plating solution volume on nickel deposition on low carbon steel was studied and from the result obtained, the following conclusion are drawn:
· 0.31 g/cm3 (0.89Mol/dm3) concentration gave the best nickel deposit at 0.5V for 15 minutes. This would correspond to a Watt solution of composition nickel sulphate-230 g/l, nickel chloride-46.5g/l and boric acid-30.8g/l with a pH of 4.18
· Increase in voltage hence current density led to increase in deposition per unit area.
· Increase in time led to increase in deposition per unit area.
· Higher voltage (hence current density) above 0.6V led to the burning of the electroplating samples.
· The effect of temperature variation on nickel deposition on low carbon steel substrate at low-voltage deposition was not covered in this work. Also, the quality and composition of materials deposited on the substrate after electroplating was not analysed.
· Effect of variation of volume of brightener on low-voltage nickel electrodepositing on low carbon steel substrate was not covered in this work as well.
· Neither was sample size effect on low-voltage nickel electrodepositing covered as well.
References
1. Schlesinger M., Fundamentals of Electrochemical Deposition, Wiley, New York, 1998.
2. Paunovic V., Modern electroplating (4th Edition), Wiley, New York, 2000.
3. Dini J.W., Electrodeposition; The material science of coatings and substrate, CBS Publishers and distributors, Delhi, 1993.
4. Durney L.J., Graham electroplating Handbook, (4th edition), CBS Publishers and distributors, Delhi, 1984.
5. Lowenhein F., Guide to the selection and use of electroplated and related finishes, 1982, McGraw Hill, USA, p. 761-762.
6. Varghese C.D., Electroplating and other surface treatment; A practical guide, McGraw Hill Publishing, New York, 1993.
7. Wild P.W., Modern analysis for Electroplating, (2nd Edition), McGraw Hill Publishing, New Delhi, 1991.
8. Scavetta E., StipaS., Tonelli D., Electrodeposition of a nickel-based hydrotalcite on Pt nanoparticles for ethanol and glucose sensing, Electrochemistry Communications. 2007, 9(12), p. 2838-2842.
9. Jinxing J, Cooper W.C., ‘Nickel speciation in aqueous chloride solutions’, Electrochimica Acta, 1996, 41(9), p. 1549-1560.
10. Korolczuk M., Tyszczuk K., Grabarczyk M., ‘Adsorptive stripping voltammetry of nickel and cobalt at in situ plated lead film electrode’, Electrochemistry Communications, 2005, 7(12), p. 1185-1189.
11. Qingfeng Y., Huang W., Zhang J., Liu X., Li L., ‘A novel titanium-supported nickel electrocatalyst for cyclohexanol oxidation in alkaline solutions’, Journal of Electroanalytical Chemistry, 2007, 610(2), p. 163-170.