Design and Fabrication of a Wear Testing Machine
Amal Ebrahim NASSAR* and Eman Ebrahim NASSAR
Department of Mechanical Engineering, Higher Technological Institute Tenth of Ramadan City, Egypt.
E-mail(s): amalolo704@yahoo.com, amal.nasser@hti.edu.eg
* Corresponding author: Phone: +201006414107; Fax: +20224924319
Abstract
This study was carried out to design and fabricate a cost effective and efficient wear tester (pin on disc) used in the metallurgy research field. Design and calculations were established and the machine was fabricated with well selected materials and components all sourced locally. The performance of the fabricated machine was finally evaluated against a standard wear machine in the Standards Organization using statistical methods and the result showed that the locally fabricated machine is 97% effective.
Keywords
Wear; Fabricated; Design; A356 alloy.
Introduction
Wear testing is a method for assessing erosion or sideways displacement of material from its "derivative" and original position on a solid surface performed by the action of another surface. This test is commonly used as a simple measure of workability of material in service. Materials behave differently in friction state so it may be important to perform mechanical tests which simulate the condition the material will experience in actual use. Wear testing is typically carried out on the A356 alloy. Wear tests of the selected alloy is a critical parameter for determining the quality of these materials. The loads and forces acting on these materials while in service are compressive in nature and their ability to withstand such loads and forces without failure is a measure of their reliability. The availability of a wear testing machine for materials is the first step to effective quality control and good manufacturing practice. The establishment of quality control facilities by manufacturers for continuous assessment of product quality is a necessary requirement for ensuring compliance with relevant standard and maintaining product quality that will continue to meet the needs of the uninformed users.
In Egypt today, there is no effective locally fabricated wear testing equipment that is readily available and affordable for the researchers in the metallurgy filed. The foreign wear machines are expensive, rarely available and beyond the reach of the researchers. In line with the need to evolve a dual purpose effective wear machine with 100% locally sourced materials and components which will be cheap and readily available to surface study and will improve productivity, quality control, good manufacturing practice in the building material industry and also spur National economic growth, the design and fabrication of a wear testing machine is carried out. Pin on disc wear test machines were designed and constructed.
Pin on disc wear tests are carried out by applying a constant normal load in the contact while rotating the disc at constant speed. The weight loss is continuously measured and stored to calculate the wear rate.
The aim of this study was to evaluate the effect of changing the load on the rate of wear, by design a device to find out the rate of material removed under the effect of different loads.
Material and Method
Determination of Torque Required to be Supplied by Electric Motor
The electric motor is expected to provide the torque required for the rotation of the disc [1]:
|
HP = Torque × RPM ÷ 5252 |
(1) |
where RPM = the Revolutions per minute, HP = Horsepower.
Determination of Shaft Diameter
Most motor shafts are keyed, which increases the shear stress exerted on the shaft. Considering this, motor shaft designs typically use no more than 75 percent of the maximum recommended stress for a non-keyed shaft .Electric motor is giving 2 Hp with speed equal to 1400 rpm, so shaft diameter can be determined from the following equation [2]:
|
D= [(60 * HP)/N] 0.5 |
(2) |
where: N =1400; HP =2; D=0.29 in, by metric unit D= 8 mm.
Since the calculated shaft diameter for 2-hp motor is designed to withstand three times the rated torque, the shaft diameter of 0.5 in (13 mm).
Determination of Flexible Arm
Flexible Arm (Figure 1) is clamped from the center to the main support, and it is free to move up or down. The arm had 14 holes (with diameter equal 0.5 mm) in it, and the distance between each hole was 1 cm.
L1= the required length to attach the sample holder (drill chuck).
The Major diameter of the thread Screws top of the drill chuck is M16.
L2= (0.5*14) + (1*13) =20 cm.
L3 = the required length to attach the Flexible Arm to the main support. The width of main support is equal to 5 cm.
Figure 1. Flexible Arm
Table 1 illustrates the available loads in the device by changing the location of the Loads in the flexible arm holes.
Table 1. Loads at each hole in the flexible arm
|
Available Loads In The Machine (N) (Weigh × Distance × 9.8) |
Hole |
||||||||||||||||
|
4900 |
4410 |
3920 |
3332 |
3136 |
2940 |
2352 |
1960 |
1666 |
1568 |
1470 |
1176 |
1078 |
980 |
490 |
196 |
98 |
1 |
|
96040 |
86436 |
76832 |
65307 |
61466 |
57624 |
46099 |
38416 |
32654 |
30733 |
28812 |
23050 |
21129 |
19208 |
9604 |
3841.6 |
1920.8 |
2 |
|
3E+06 |
3E+06 |
2E+06 |
2E+06 |
2E+06 |
2E+06 |
1E+06 |
1E+06 |
960016 |
903544 |
847073 |
677658 |
621187 |
564715 |
282358 |
112943 |
56472 |
3 |
|
1E+08 |
1E+08 |
9E+07 |
8E+07 |
7E+07 |
7E+07 |
5E+07 |
4E+07 |
4E+07 |
4E+07 |
3E+07 |
3E+07 |
2E+07 |
2E+07 |
1E+07 |
4E+06 |
2E+06 |
4 |
|
5E+09 |
5E+09 |
4E+09 |
4E+09 |
3E+09 |
3E+09 |
3E+09 |
2E+09 |
2E+09 |
2E+09 |
2E+09 |
1E+09 |
1E+09 |
1E+09 |
5E+08 |
2E+08 |
1E+08 |
5 |
|
3E+11 |
3E+11 |
3E+11 |
2E+11 |
2E+11 |
2E+11 |
2E+11 |
1E+11 |
1E+11 |
1E+11 |
1E+11 |
8E+10 |
7E+10 |
6E+10 |
3E+10 |
1E+10 |
6E+09 |
6 |
|
2E+13 |
2E+13 |
2E+13 |
1E+13 |
1E+13 |
1E+13 |
1E+13 |
9E+12 |
7E+12 |
7E+12 |
7E+12 |
5E+12 |
5E+12 |
4E+12 |
2E+12 |
9E+11 |
4E+11 |
7 |
|
2E+15 |
2E+15 |
1E+15 |
1E+15 |
1E+15 |
1E+15 |
8E+14 |
7E+14 |
6E+14 |
5E+14 |
5E+14 |
4E+14 |
4E+14 |
3E+14 |
2E+14 |
7E+13 |
3E+13 |
8 |
|
2E+17 |
1E+17 |
1E+17 |
1E+17 |
1E+17 |
9E+16 |
7E+16 |
6E+16 |
5E+16 |
5E+16 |
5E+16 |
4E+16 |
3E+16 |
3E+16 |
2E+16 |
6E+15 |
3E+15 |
9 |
|
1E+19 |
1E+19 |
1E+19 |
1E+19 |
9E+18 |
9E+18 |
7E+18 |
6E+18 |
5E+18 |
5E+18 |
4E+18 |
4E+18 |
3E+18 |
3E+18 |
1E+18 |
6E+17 |
3E+17 |
10 |
|
2E+21 |
1E+21 |
1E+21 |
1E+21 |
1E+21 |
1E+21 |
8E+20 |
6E+20 |
5E+20 |
5E+20 |
5E+20 |
4E+20 |
4E+20 |
3E+20 |
2E+20 |
6E+19 |
3E+19 |
11 |
|
2E+23 |
2E+23 |
2E+23 |
1E+23 |
1E+23 |
1E+23 |
9E+22 |
8E+22 |
6E+22 |
6E+22 |
6E+22 |
5E+22 |
4E+22 |
4E+22 |
2E+22 |
8E+21 |
4E+21 |
12 |
|
2E+25 |
2E+25 |
2E+25 |
2E+25 |
2E+25 |
1E+25 |
1E+25 |
1E+25 |
8E+24 |
8E+24 |
7E+24 |
6E+24 |
5E+24 |
5E+24 |
2E+24 |
1E+24 |
5E+23 |
13 |
|
3E+27 |
3E+27 |
3E+27 |
2E+27 |
2E+27 |
2E+27 |
2E+27 |
1E+27 |
1E+27 |
1E+27 |
1E+27 |
8E+26 |
7E+26 |
7E+26 |
3E+26 |
1E+26 |
7E+25 |
14 |
Determination of Weight of Whole Assembly
The weight of the whole assembly is needed in order to determine the size of wheel axle. So the weight is given by the expression:
|
W= WS+ Wa+ We |
(3) |
where: WS= weight of structure, Wa= total weight of arm and its components, We= weight of electric motor.
Determination of Size of Wheel Axle
The wheels are acted upon by the weight of the entire assembly calculated in previous section. This is felt by the axles of the wheels. The size (diameter) of the each of the axles is determined thus: [3]
|
d= (4W/2πτ)0.5 |
(4) |
where: d = diameter of each axle, A = Area of cross section of axle.
Description of the Machine
The wear machine consists of a load frame and an electric motor with control unit as illustrated in Figure 2.
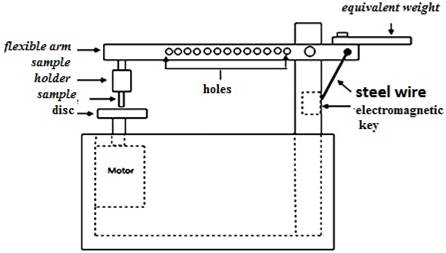
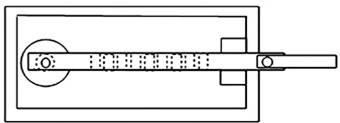
Figure 2. Fabricated wear testing machine
The flexible arm is connected to electromagnetic key (center lock) by means of a steel wire, which worked as a brake to stop the experiment at required time and the time was controlled by digital timer. The load varies by changing the location of weight and the size of weight (10 gm to 500 gm).
Wear Test
The wear test was performed on Pin-on-Disc apparatus shown in figure 1. In this test the flat end of cylindrical specimen 8 mm in diameter and 12 mm length was fixed in chuck jaws to prevent specimens from rotation during the test. Axial load was applied to the pins against the plane surface of the rotating disc. The specimen's ends were polished with 1200 grit SiC emery paper and cleaned with acetone. The wear test reported is the average of two readings and was carried out at room temperatures. The standard disc used for testing was made of hard steel ASE 1045 with hardness of 263BHN whose surface roughness was 0.2 µm.
The materials chosen for the present study was A356 having the chemical composition shown in Table 2. The material was received in the form of bar. Each specimen was weighed before the experiment and after it by a digital balance having sensitivity of 0.001gm. The duration of the experiment was controlled by digital timer.
Table 2. Chemical composition of A356
|
From
|
Chemical compositions (wt %) |
||||||||
|
Si |
Fe |
Cu |
Mg |
Mn |
Ni |
Zn |
Ti |
Al |
|
|
Value |
6.72 |
0.25 |
0.11 |
0.27 |
0.002 |
0.001 |
0.04 |
0.043 |
Balance |
The average value of the weight loss percentage as a function of test time was calculated. From weight loss of the specimens (∆m) it is possible to evaluate a dimensionless parameter known as w, "wear rate" define by Archard's equation [4]:
|
|
|
where: ∆m = weight loss (g), ρ = average density of material, t = test time (s) and A = apparent contact area (mm2).
Results and Discussion
The objectives of this investigation was to find out the accuracy of the fabricated tester, by comparing the results which obtained by other researchers and the results by the fabricated machine figure 3 shows the wear rate results by the investigators and by fabricated machine . Table 3 shows the variables combination that used in the investigation. Two of Statistic methods were used in the analysis:
First: The correlation coefficient. It allows researchers to determine if there is a possible linear relationship between two variables measured. The correlation coefficient is close to +1 (or –1), it means that there is a strong correlation.
Second: t-test, the result is a P value, where P is the probability that there is no difference between the two samples.
If P > 5% then the two sets are the same. If P < 5% then the two sets are different.
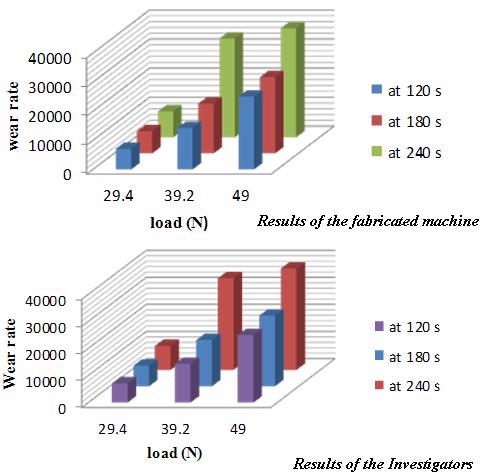
Figure 3. Wear rate results by the investigators and by fabricated machine.
Table 3. The Variables combination that used in the investigation
|
Hight |
Diameter |
Unit |
Parameter |
|
15 |
8 |
mm |
Pin |
|
20 |
95 |
mm |
Disc |
|
1400 |
RPM |
Disc Rotation |
|
|
9.8,19.6 and 29.4 |
N |
Normal Load |
|
|
27 |
mm |
Track Radius |
|
The statistical values obtained from the Statistical analysis table 4 showed that the correlation coefficient between results was between the interval [1,-1] that means there is a strong correlation between the results. Statistical analysis showed also, that the P value was more than 5% that means the two sets are the same. It can therefore infer that the sensitivity of the two machines is almost the same.
Table 4. Results of the Statistic methods
|
Statistic Method |
Value |
|
Correlation Coefficient |
0.986604 |
|
t-test |
P=0.595427 |
Table 5 reveals that increasing the applied pressure increases wear rate for all investigated alloys, at room temperature the conditions of wear are seems to be mild wear. The 'mild wear' conditions are distinguished by low wear rate. The sever wear conditions were clearly seen.
Table 5. Wear rate and weight loss results
|
Weight loss |
Wear rate |
Load (N) |
Time (s) |
|
0.02 |
7151.318 |
29.4 |
120 |
|
0.032 |
7628.072 |
180 |
|
|
0.05 |
8939.147 |
240 |
|
|
0.04 |
14302.64 |
39.2 |
120 |
|
0.072 |
17163.16 |
180 |
|
|
0.19 |
33968.76 |
240 |
|
|
0.07 |
25029.61 |
49 |
120 |
|
0.11 |
26221.5 |
180 |
|
|
0.21 |
37544.42 |
240 |
The noticed trend is consistent with that noticed by Williams et al [5]. They suggested that the wear rate increases gradually with applied load in the mild wear region. However, at a ‘critical load’ that depends on sliding velocity, the wear rate abruptly increases to reflect the condition termed ‘severe’ wear. Surappa et al [6], Y. Yalcin et al [7] and Jung et al [8] have studied the abrasive wear properties of A356. They observed that the abrasive wear resistances of A356 alloy decreasing with the increases in load.
Conclusion
The values of the Statistic methods showed the range of accuracy of the locally fabricated tester. The locally fabricated wear tester can be applied to attest the quality of alloy, in accordance to the requirements of the Standards Organization, and will give values which would compare well with those from the standard (foreign) wear tester for alloy under the same test conditions. The wear rate decreases as the load decreases from 29.4-49 N also, the wear rate decreases as the time increases from 240 to 120 second. Considerable saving in terms of cost and time could be obtained from using the locally fabricated tester. It is successful analytical tools which can be used to measure the wear behaviour of materials.
References
1. Yung C., Nyberg C., Relationship of Torque and Shaft Size. EASA Article Index, Pumps & System, 2008, p. 2-3.
2. Eugene A., Marks T.B., Standard Handbook for Mechanical Engineers, 11th Edition, The McGraw-Hill Companies. 2007, p. 34-36.
3. Richard G. B., Keith J.N. , Shigley's Mechanical Engineering Design, 9th edition, The McGraw-Hill Companies, 2011, p. 121-145.
4. John M.T., A Proposal for the Calculation of Wear, 2007, p. 2-3, Available at: http://www.mkthompson.net/wp-content/uploads/2012/02/ansys-paper-2006-2.pdf
5. Williams, Wear and wear Particles- Some fundamentals. Tribology International 2005, 38(10): p. 863-870.
6. Sudarshan M.K., Surappa, Dry sliding wear of fly ash particle reinforced A356 Al composites, Wear, 2008, p. 265, 349-360.
7. Yalcina Y., Akbulut H., Dry wear properties of A356-SiC particle reinforced MMCs produced by two melting routes, Materials & Design, 2006, 27(10), p. 873-874.
8. Jung L., Suk K., Jian M., Effects of Surface Coating on Wear Properties of A356-20vol.%SiCp Composites, Solid State Phenomena, Advances in Nanomaterials and Processing. 2007, p.1410.