Stress Effects on Microstructure and Failure Morphology of Low Carbon Steel Sheet
Nathaniel Onyeka ONURISI* and Oluleke OLUWOLE
Mechanical Engineering Department, University of Ibadan, Ibadan, Oyo State, Nigeria.
E-mail(s): nathonurisi@yahoo.com; leke_oluwole@yahoo.co.uk
*Corresponding author: Phone: +2348038511175
Abstract
This paper presents experimental and simulation study of the effects of stress on microstructure and failure morphology of low carbon steel under plane stress conditions. The study has revealed large extension of grains at the point of fracture and, stress and strain looped around the pearlitic faces of the microstructure matrix. The stress and strain distributions in the microstructure have shown that concentration of stress and strain on the pearlite were instrumental to oblique fracture near the constrained region.
Keywords
Stress-loops; Low carbon steel; Pearlite; Oblique; Fracture; Morphology.
Introduction
Low carbon steel find wide application in automobile body components, structural shapes, sheets for pipeline manufacturing, buildings, bridges, tin cans and other components. They are machinable, weldable and less expensive to produce [1]. Engineering structures inevitably contain microscopic defects arising from the manufacturing and operational processes and these defects can grow and propagate in the material under combined loading and environmental conditions, leading to catastrophic failure [2], which is the separation of a part into two or more pieces [3, 4]. The final separation process usually proceeds very rapidly and is often facilitated by nucleation. Microscopically, ductile failure is characterised by three coupled mechanisms: void nucleation, void growth, and void coalescence [5, 6].
Attention has been paid to the experimental investigation and analysis of results using simulation packages to ascertain the mechanical response of material when exposed to complex loading conditions [7]. Mackenzie et al [8] studied the influence of stress state on ductile failure initiation and observed that critical plastic strain to initiate ductile failure is inversely proportional to the stress triaxiality. The fracture morphology in thin sheets of stainless steel, mild steel, 6082-O and NS4 aluminium alloys, brass, bronze, lead, and zinc deformed to over 50% thickness reduction have been observed to exhibit mode I ‘bath-tub’ failure fracture profile with limited shear lips and great localized necking [9]. He believed also, that the chemistry connecting the flow properties and void growth can cause the different behaviours noticed about fracture toughness and its dependence on thickness.
Nath and Uttam [10] observed that the introduction of notch in the material instigated brittle fracture in spite of carbon steel being a ductile metal. Shear stress loops with angular bearing of 45º to the tensile axis were observed to instigate both the failure site and shear morphology in mild steel materials [11]. Chang et al [12], proposed a new method to simulate ductile failure by using finite element analyses, based on the stress-modified fracture strain model also known as phenomenological model for ductile fracture.
This paper applies experimentation and finite element modelling in investigating stress effects on microstructure of low carbon steel and its failure morphology under plane stress condition.
Material and Method
Experimentation
Low carbon steel thin sheet whose composition is given in Table-1 below was used in the present investigation.
Table 1. Chemical composition of Low carbon steel used, wt%
|
C |
Si |
S |
P |
Mn |
Ni |
Cr |
Cu |
Al |
Fe |
|
0.05 |
0.02 |
0.01 |
0.02 |
0.21 |
0.01 |
0.02 |
0.02 |
0.05 |
99.58 |
The received thin sheets of low carbon steel were machined to tensile specimen to the following dimensions:
Thickness (t) 0.5mm
Specimen width (Do) 5mm
Gauge length (Lo) 45mm
The samples were subjected to simple tensile test on a Monsanto tensometer. Three samples were employed for each stage of the test.
Metallography
All the samples were prepared for optical microscopy using standard metallographic practice, 2% nital was used as etchant. Microstructure of low carbon steel as received was examined as well as the strained samples. Accu-scope microscope with attached camera was used to obtain the micrographs. The micrographs obtained from the Accu-scope microscope were examined.
Finite Element Modelling
The simulation of tensile stress concentration on microstructures of a low carbon steel sheet was carried out using COMSOL multiphysics software package. The sheet had a dimension of 45mm by 5mm, fixed at one end and free at the other end. The free end was subjected to average tensile loads of 127kg, 178kg and 229kg respectively. The grain size and microstructure were modelled as shown in figures 8, 9 and 10. Stress distribution on the microstructures and failure morphology were investigated.
The following assumptions were made in the simulation:
I. The thin sheet was considered to be isotropic.
II. The thin sheet was assumed to be two dimensional.
Three-node triangular elements were used in the meshing and the finite element equations applied to the elements were:
|
[ke]{de}={fe} |
(1) |
|
|
(2) |
|
|
(3) |
|
|
(4) |


where: [ke ] represent the element stiffness matrix, [B] and [D] are constant matrices, N1, N2 and N3 are the shape functions for three-node triangular elements, x and y are the directions in which the forces are acting, E denotes Young’s modulus of elasticity, υ denotes Poisson’s ratio, {fe } denotes the element force vector and {de } denotes element displacement vector.
Assembling of Element Equations into Global Equation
Solving for displacement we have:
|
{d}=[k]{f}1 |
(5) |
|
{d}={u1υ1 u2υ2 u3υ3}T |
(6) |
where {d}={u1υ1 u2υ2 u3υ3}T are the nodal displacement vectors.
Solving For Strains, Stress and Shear Stress and Strains
In solving for strains, kinematic equation relating strains to displacements shown below was used.
|
|
(7) |
|
{σ}=[D]{ε} |
(8) |

Equation (8) was used in obtaining the stresses and strain.
|
|
(9) |
|
|
(10) |
The equations of equilibrium of forces acting on two dimensional continuums were used. Where σx, σy, τxy are the stresses acting in the x, y directions and shear stress respectively, while fx and fy are the body forces.
The simulation was carried out on a Hewlett Packard Compaq 615 Laptop series having; AMD Atlon dual core processor 2.2GHz, 2.0GB RAM, and 320GB Hard disk.
Results and Discussion
Tensile test results are displayed in Tables 2.
Table 2. Summary of tensile test results
|
Test Stages |
Force (N) |
L0 (mm) |
L1 (mm) |
L1-L0 (mm) |
D0 (mm) |
D1 (mm) |
A0 (mm2) |
A1 (mm2) |
|
BYP |
1242.60 |
45.07 |
46.17 |
1.10 |
5.10 |
4.77 |
2.55 |
2.39 |
|
UTS |
1749.45 |
45.13 |
46.70 |
1.57 |
5.02 |
4.75 |
2.51 |
2.38 |
|
NP |
1618.65 |
44.93 |
45.90 |
0.97 |
5.07 |
4.84 |
2.54 |
2.42 |
|
FT |
2239.95 |
44.90 |
47.33 |
2.43 |
5.03 |
4.53 |
2.52 |
2.27 |
where: BYP = beyond yield point, UTS = at ultimate tensile strength, NP = at necking point, FT = at fracture point.
The micrographs of Low carbon steel were taken at x400 of magnification (figure 1 and 2). The Low carbon steel sheet fractured obliquely near the constrained region (figure 3).

Figure 1. Micrograph of a sample as received
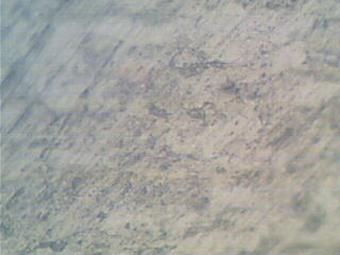
Figure 2. Micrograph of a sample stressed to fracture
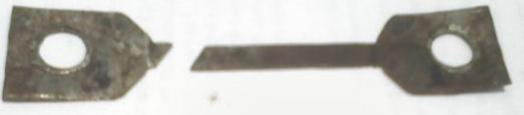
Figure 3. Oblique fractured Specimen
The grain size and Low carbon steel sheet microstructures were modelled as illustrated in figures 4 and 5 respectively.
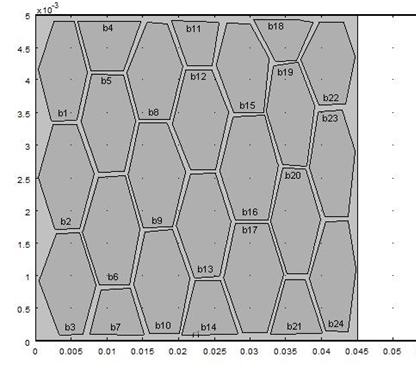
Figure 4. Grain size modelling
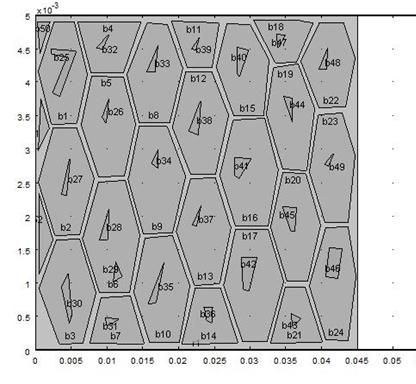
Figure 5. Modelled microstructure showing pearlite and ferrite phases
The results of the stress components in the x-direction are presented in figures 6 and 7. Strong stress fields were observed at the pearlite faces (bright greenish-yellow in figure 7) in the simulated microstructure of the low carbon steel, with greater intensity, transversely in the vicinity of the constrained region.
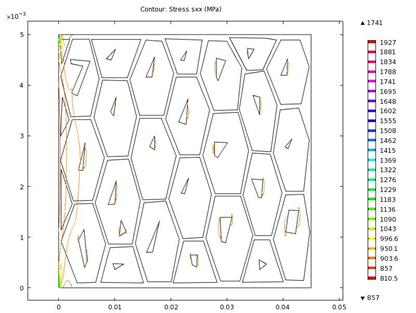
Figure 6. Contour plot of stress in x-direction
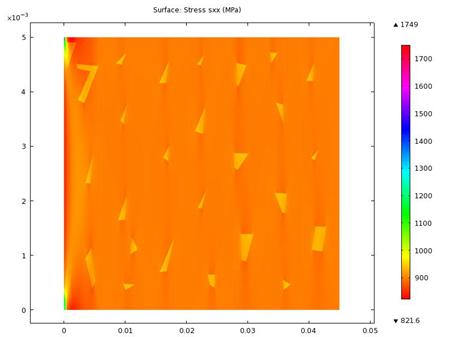
Figure 7. Stress in x-direction
The figures 8 and 9 displayed the strain components in the x-direction. Strain concentration was observed around the sides of the pearlites, more conspicuous at the edges at the fixed end.
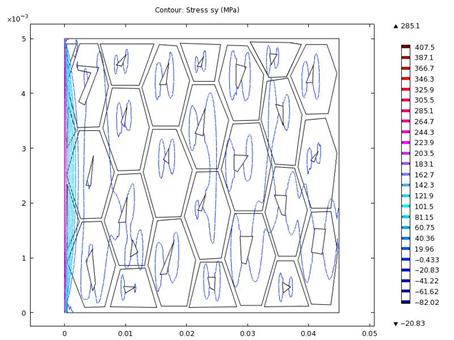
Figure 8. Contour plot of stress in y-direction
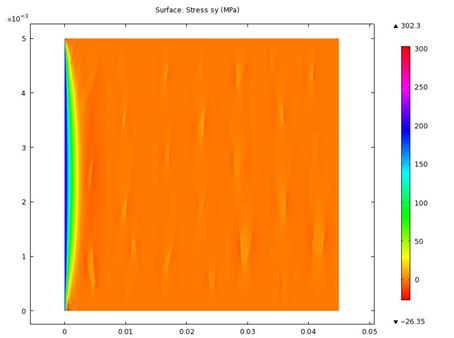
Figure 9. Stress in y component
The results of the stress components in the y-direction are presented in figures 10 and 11. High compressive stress loops were noticed to be prominent in the microstructure particularly around the pearlites, cutting across the ferrites, but became tensile as it approached the restrained end.
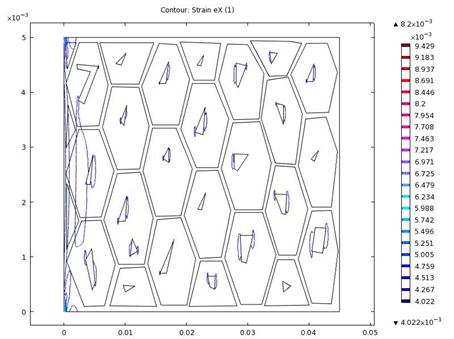
Figure 10. Contour plot of strain in x-direction
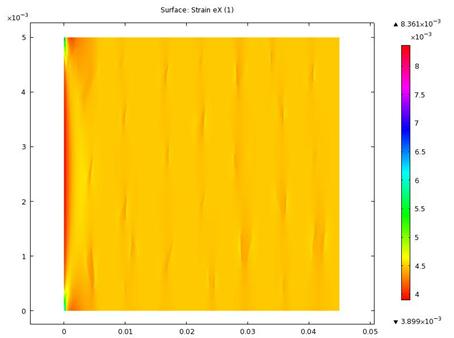
Figure 11. Strain in x component
Figures 12 and 13 showed strain constituents in the y-direction. It was observed that compressive strains were more concentrated on the pearlites in the microstructure pointing vertically on the faces. Strain was observed running across the matrix vertically around the fixed end. Combining the results in figures 6 and 8 suggested an oblique failure close to the fixed end.
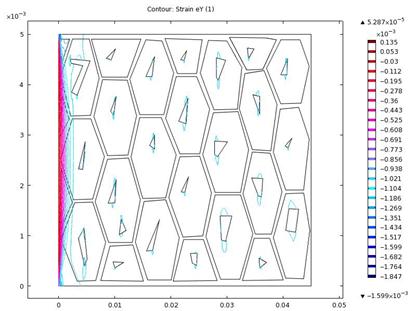
Figure 12. Contour plot of strain in y-direction
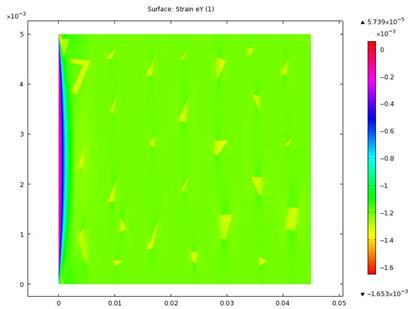
Figure 13. Strain in y component
The results of the shear stress and shear strain components in the xy-direction are presented in figures 14-15, and figures 16–17 respectively. We observed that the shearing stress and strain sloped down near the fixed end.
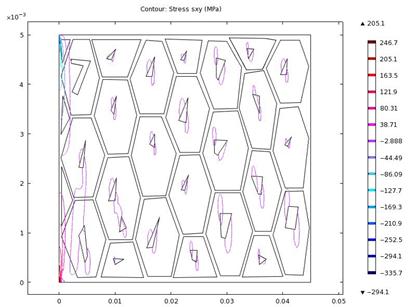
Figure 14. Contour plot of shear stress in xy-direction
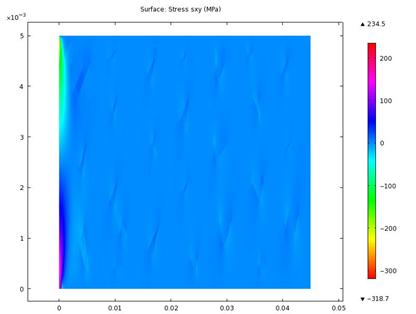
Figure 15. Shear stress in xy component
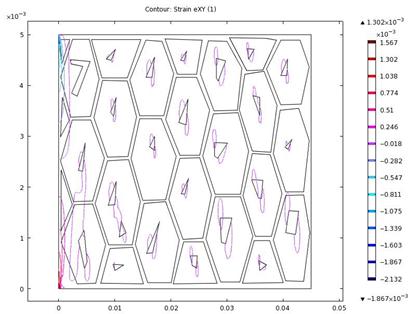
Figure 16. Contour plot of shear strain in xy-direction
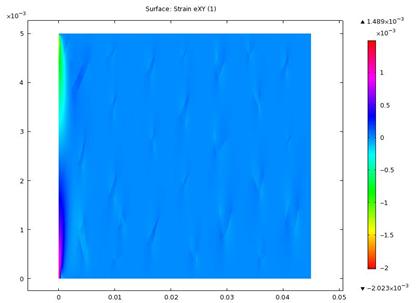
Figure 17. Shear strain in xy component
Further combination of the results in figures 10, 12, 14 and 16 predicted a shear failure morphology observed in figure 3.
Conclusion
The study has revealed large extension of grains at the point of fracture and, stress and strain looped around the pearlitic faces of the microstructure matrix. The stress, strain, shearing stress and strain distributions in the microstructure have shown that the concentration of stress and strain on the pearlitic region were instrumental to longitudinal Oblique fracture morphology near the constrained end.
References
1. William D., Callister Jr., Fundamental of Materials Science and Engineering, 5th ed., New York, John Wiley & Sons, Inc, 2001.
2. Jinkook K., Guihua Z., Xiaosheng Gao., Modelling of ductile fracture: Application of mechanism-based concepts, International Journal of Solids and Structures, 2007, vol. 44, pp.1844-1862.
3. Singh V., Physical Metallurgy, Standard Publishers Distributors, Delhi, 2005.
4. Kakani S.L., Kakani A., Material Science, New Delhi, New Age International Publishers, 2004.
5. Anderson T.L., Fracture Mechanics: Fundamentals and Application, 2nd ed., New York, CRC Press, 1995.
6. Liang X., Damage accumulation and fracture initiation in uncracked ductile solids subject to triaxial loading, International Journal of Solids and Structures, 2007, vol. 44, pp.5163-5181.
7. Meguid S.A., Malvern L. E., Campbell J.D., Plastic flow of mild steel under proportional and non-proportional straining at a controlled rate, Trans. ASME, 1979, vol. 101, pp. 284-253.
8. Mackenzie A.C., Hancock J.W., Brown D.K., On the influence of state of stress on ductile failure initiation in high strength steels, Engineering Fracture Mechanics, 1977, vol. 9, p.167-188.
9. Pardoen F., Hachez B., Marchioni P.H. Blyth, Atkins, Mode I fracture of sheet metal, Journal of the Mechanics and Physics of Solids, 2004, vol.52, pp.423-452.
10. Nath S.K., Uttam Kr. Das, Effect of microstructure and notches on the fracture toughness of medium carbon steel, Journal of Naval Architecture and Marine Engineering, 2004 vol.3, pp.15-22.
11. Oluwole O.O., Stress Loops Effect in Ductile Failure of Mild Steel, Journal of Minerals & Materials Characterization & Engineering, 2009, vol.8 no.4, pp. 293-302.
12. Chang-Sik Oh., Nak-Hyum Kim., Yun-Jea Kim., Jong-Hyun Baek., Young-Pyo., Kim et al., A finite element ductile failure simulation method using stress-modified fracture strain model, Engineering fracture Mechanics, 2011, vol. 78, pp. 124-13.