Managing Energy Resources: Case Study on Energy Consumption Pattern
Sunday IBRAHIM1 and John UKWENYA2
1 Department of Mechanical Engineering, University of Agriculture, Makurdi, Nigeria
2 Department of Mechanical Engineering, Benue State Polytechnic, Ugbokolo, Nigeria
E-mail: rovemmakurdi@yahoo.com
* Corresponding author: Phone: +234(0)8052958435
Abstract
An assessment of the available sources of energy in selected rural areas of Benue State, Nigeria was undertaken with a view to evaluate their consumption pattern. Systematic random sampling was used to sample 144 households. Well structured questionnaire and measuring equipments were used to obtain our data. The analysis on age, energy resources in the selected areas and consumption pattern were based on descriptive statistics. Analysis to determine effect of income and household size on quantities of fuel usage was done using models of regression and analysis of variance (ANOVA). The findings revealed that 92.4 % of the respondents were above 50 years old on average and about 37 % had a household size of 11 members. The rural populace rely more on fuel wood as their sources of energy. The estimated average daily fuel wood and kerosene consumption per household ranged between 9–20 kg and 0.02 - 0.1 litres respectively. The average annual income of the respondents range between 270 – 800 US dollar (#40,000 - #120,000 Nigeria currency), which shows that majority of these rural populace lives below poverty line. The correlation coefficients between household size and quantities of fuel wood and kerosene consumed by respondents are 0.914 and 0.812 respectively so their relationships are statistically significant at 5 % probability level. Relationships between their household income and quantities of kerosene and fuel wood used have correlation coefficients of 0.107 and 0.109 respectively, which are not statistically significant at 5 % probability level. Solar energy systems need be developed for use in the rural areas for efficient resources management and utilization.
Keywords
Managing Energy Consumption; Pattern; Evaluate; Rural; Benue; Assessment; Sources of Energy; Nigeria.
Introduction
Energy is a basic requirement in human life but most of the rural people in the north central region of Nigeria do not have enough access to it. Since efficient and affordable energy resources are rarely available, they depend on traditional fuels such as wood and crop residues. The technologies used mostly are primitive and inefficient which barely allows fulfilment of basic human needs. Energy serves as input into the production of goods and services in the nations industry, transport, agriculture, health, and education sectors and insufficient supply restricts social-economic growth and adversely affects the quality of life. Consumption of energy is increasing sharply Nigeria’s rural areas owing to increasing human population and better living standard with negative impact on the environment. The pattern of energy supply and usage in Nigeria is such that the choice of energy mix is very important in our energy scenario which indicate that more intensive exploitation of our energy resources is required if we must cope with future demand. Benue state of Nigeria is made up of three senatorial districts of 36 local government areas of which a total of 12 local government areas are chosen in this study.
Rural area in Nigeria is defined as “an area where agriculture is the major preoccupation of the people; there is absence of pipe borne water, electricity and General Hospital or Comprehensive Health Centre and to a lesser extent the absence of telecommunication; and a population seldom in excess of 4000 people” [1].
Benue State of Nigeria lies between longitude 7° 40’and 10° 00’ E and latitude 6° 30’ and 8° 24’ N and has a land area of about 31,400 square kilometres. The state is divided into twenty- three local government areas and grouped into three senatorial districts [2].
Benue state is richly endowed with different types of natural resources and is worked by an enterprising farming population of the area with abundant solar energy [3]. The State is made up of several ethnic groups which include: Tiv, Idoma, Igedde, Etulo, Nyifon, Abakwa and others. The average solar radiation received in Nigeria per day is as high as 20 MJ/m2 depending on the time of the year and location [5].
The pattern of household energy consumption represents the stage of welfare as well as the stage of economic development. As the economy develops, more and cleaner energy is consumed. It is natural for people to pursue a better life which often means increased mobility, proper heating and cooling and more equipment which are affected by the proportion of time and income spent on domestic energy sources. Nigerians are often confronted with inadequate energy generation and distribution, improper pricing of household fuels, constant increase in the price of available ones without a corresponding increase in average household income [6].
Households which were hitherto using fossil fuels now had to rely more on wood because of availability and its affordability [7]. Kerosene and gas are not readily available due to inadequate supply in most Nigerian rural areas. Studies have shown that in Nigeria, harvesting of fuel wood contributes to deforestation at a rate of about 400,000 hectares per year. If this trend continues, the country’s forest resources could be completely depleted by 2020 [9, 10].
Previous studies revealed a high dependence of Fakai district of Sokoto state and Oshogbo in Oshun state of Nigeria on fuel wood and kerosene with consumption of households in twelve villages to the range of 105.7–195.0kg and 2.50–12.73 litres respectively while in Bauchi State of Nigeria, fire wood was found to be the dominant fuel source, contributing between 52.45% and 88.62% of the household budget [11-14].
Energy efficiency means that we should use energy in a manner that will minimize the amount of energy needed to provide services. The behavioural approach entails changing the ways we do things [15].The negative environmental impacts associated with the generation of energy will also be reduced if we use energy efficiently [16,17].
Movements in one variable as related to the other may be given by a practical formulae given in equation 1, and the degrees of correlation are measured by two measures of correlation denoted by r and R which provides a measure of the strength of association between two variables:
|
|
(1) |

The t- test for which the test statistics is given by equation 2:
|
|
(2) |
Regression analysis is a statistical technique which can be used for medium term forecasting which seeks to establish the line of ‘best fit’ to the observed data. The general form of the equation for a straight line is given in equation 3:
|
Y=a+bx |
(3) |
where a and b are constants.
The two simultaneous equation known as the normal equation, equations 4 and 5 are solved for a and b.
|
|
(4) |
|
|
(5) |
where n = number of pair of figures.
The coefficient of determination tells what proportion
of the variation in the dependent variable, or regress and that is explained by
the explanatory variable, or regressor and measures “goodness of fit”. The
limits are ![]() [18].
[18].
The analysis of variance, ANOVA is a parametric statistic used in comparing the variation between the population means with the variation within the population. ANOVA is applied where the samples are more than two [18].
The aim of this study was to determine the energy consumption pattern of 36 villages of 12 Local Government Areas of Benue State of Nigeria in order to identify various source of energy available for domestic use, whether the existing energy consumption trends are eco-friendly and beneficial to the welfare of the rural community and to determine effect of some socio economic factors (household size and income) on quantities of fuels consumed in the rural areas.
Material and Method
The materials used in the study included “Hana analog” digital weighing machine (Cap. 120kg), Questionnaires, Measuring cylinders (graduated in ml), Microsoft Spreadsheet, Program (Microsoft Excel), Statistical Models; Regression and Correlation.
Guided interviews were administered on the respondents using research assistants who understood the native language of the predominantly illiterate and semi illiterate respondents. Fuel wood and kerosene were respectively measured to confirm the quantities claimed to be consumed by the respondents.
The population for the study consisted of all the local government areas of Benue State. A random sample of four local government areas was selected from each of the three senatorial districts of the State to ensure adequate representation. Simple random sampling method was adopted in order to select three rural settlements from the sampled local government areas. A sample of four household was chosen from each rural settlements making a total of 144 households.
Descriptive statistics such as frequency distribution, percentages was used to analyze the level of availability of energy source(s), problems associated with energy usage by the household. The computation of energy use was done using Microsoft spreadsheet program on Microsoft excel. The quantities of energy resources consumed per household in relation to the factors that determine fuel consumption such as income and house hold sizes were analyzed using ANOVA, correlation and regression models. F-Test was used to confirm the significance at 5% probability level of the relationship of the variables using regression model.
Results
Table 1 show the results of the field survey of the available energy sources (wood fuel and kerosene) within the study areas, also represented graphically in figures 1 and 2 for percentage available conventional and renewable energy within the local government areas studied. Figures 3-6 are the percentage energy (wood fuel and kerosene) consumed as against household size and income. Tables 2-4 are the summary of data analysis and other related factors, collected in the 36 villages.
Table 1. Available conventional and renewable energy resources
|
L G A |
Village Area |
No of Res |
Conventional Energy (Kerosene) |
Renewable Energy( Wood) |
||||||||||
|
S |
% |
MA |
% |
Ab |
% |
S |
% |
M A |
% |
Ab |
% |
|||
|
Otukpo |
Oduda |
4 |
4 |
100 |
- |
- |
- |
- |
- |
- |
- |
- |
4 |
100 |
|
Onyuwei |
4 |
3 |
75 |
1 |
25 |
- |
- |
- |
- |
- |
- |
4 |
100 |
|
|
Abache |
4 |
4 |
100 |
- |
- |
- |
- |
- |
- |
- |
- |
4 |
100 |
|
|
Ohimini |
Omutele |
4 |
4 |
100 |
- |
- |
- |
- |
4 |
100 |
- |
- |
- |
- |
|
Adankali |
4 |
4 |
100 |
- |
- |
- |
- |
- |
- |
- |
- |
4 |
100 |
|
|
Ikikila |
4 |
4 |
100 |
- |
- |
- |
- |
- |
- |
- |
- |
4 |
100 |
|
|
Okpokwu |
Eboya |
4 |
4 |
100 |
- |
- |
- |
- |
3 |
75 |
1 |
25 |
- |
- |
|
Idiri |
4 |
3 |
75 |
1 |
25 |
- |
- |
- |
- |
- |
- |
4 |
100 |
|
|
Opialu |
4 |
4 |
100 |
- |
- |
- |
- |
- |
- |
- |
- |
4 |
100 |
|
|
Oju |
Ukpa |
4 |
4 |
100 |
- |
- |
- |
- |
- |
- |
- |
- |
4 |
100 |
|
Ameka |
4 |
4 |
100 |
- |
- |
- |
- |
- |
- |
- |
- |
4 |
100 |
|
|
Okileme |
4 |
4 |
100 |
- |
- |
- |
- |
- |
- |
- |
- |
4 |
100 |
|
|
Gwer West |
Jimba |
4 |
4 |
100 |
- |
- |
- |
- |
- |
- |
- |
- |
4 |
100 |
|
Ikula |
4 |
4 |
100 |
- |
- |
- |
- |
- |
- |
- |
- |
4 |
100 |
|
|
Mbage |
4 |
4 |
100 |
- |
- |
- |
- |
- |
- |
- |
- |
4 |
100 |
|
|
Gwer |
Mbalim |
4 |
4 |
100 |
- |
- |
- |
- |
- |
- |
- |
- |
4 |
100 |
|
Mbadohol |
4 |
4 |
100 |
- |
- |
- |
- |
- |
- |
- |
- |
4 |
100 |
|
|
Mbabe |
4 |
4 |
100 |
- |
- |
- |
- |
- |
- |
- |
- |
4 |
100 |
|
|
Gboko |
Mbawuan |
4 |
3 |
75 |
1 |
25 |
- |
- |
- |
- |
- |
- |
4 |
100 |
|
Anum |
4 |
4 |
100 |
- |
- |
- |
- |
- |
- |
- |
- |
4 |
100 |
|
|
Mbatiav |
4 |
4 |
100 |
- |
- |
- |
- |
- |
- |
- |
- |
4 |
100 |
|
|
Guma |
Tseuyina |
4 |
4 |
100 |
- |
- |
- |
- |
- |
- |
- |
- |
4 |
100 |
|
Ortese |
4 |
4 |
100 |
- |
- |
- |
- |
- |
- |
- |
- |
4 |
100 |
|
|
Hinyam |
4 |
3 |
75 |
1 |
25 |
- |
- |
- |
- |
- |
- |
4 |
100 |
|
|
Konshisha |
Wuese |
4 |
4 |
100 |
- |
- |
- |
- |
2 |
50 |
2 |
50 |
- |
- |
|
Ukehe |
4 |
4 |
100 |
- |
- |
- |
- |
- |
- |
- |
- |
4 |
100 |
|
|
Shiliki |
4 |
4 |
100 |
- |
- |
- |
- |
4 |
100 |
- |
- |
- |
- |
|
|
Ushongo |
Mbavende |
4 |
4 |
100 |
- |
- |
- |
- |
- |
- |
- |
- |
4 |
100 |
|
Mbaanyam |
4 |
3 |
75 |
1 |
25 |
- |
- |
- |
- |
- |
- |
4 |
100 |
|
|
Ge Mbayem |
4 |
4 |
100 |
- |
- |
- |
- |
- |
- |
- |
- |
4 |
100 |
|
|
Katshina Ala |
Igbabaka |
4 |
4 |
100 |
- |
- |
- |
- |
- |
- |
- |
- |
4 |
100 |
|
Ikawe |
4 |
4 |
100 |
- |
- |
- |
- |
- |
- |
- |
- |
4 |
100 |
|
|
Tor Donga |
4 |
4 |
100 |
- |
- |
- |
- |
- |
- |
- |
- |
4 |
100 |
|
|
Vandeikya |
Mbagbera |
4 |
4 |
100 |
- |
- |
- |
- |
- |
- |
- |
- |
4 |
100 |
|
Nyalor Mbabur |
4 |
3 |
75 |
1 |
25 |
- |
- |
- |
- |
- |
- |
4 |
100 |
|
|
Tse Ichangu |
4 |
4 |
100 |
- |
- |
- |
- |
- |
- |
- |
- |
4 |
100 |
|
|
|
TOTAL |
144 |
136 |
95.8 |
6 |
4.2 |
- |
- |
13 |
9.0 |
- |
- |
128 |
88.9 |
|
Source: (Field survey 2010) Key: S = Scarce; MA = Moderately available; Ab = Abundant |
||||||||||||||
|
|
|
Figure 1. Percentage available conventional energy (kerosene) within the local government areas |
|
|
|
Figure 2. Percentage Available Renewable Energy (Wood) within the Local Government Areas |
|
|
|
Figure 3. Percentage fuel consumption against household size |
|
|
|
Figure 4. Percentage kerosene consumption against household size |
|
|
|
Figure 5. Percentage fuel consumption against household income |
|
|
|
Figure 6. Percentage kerosene consumption against household income |
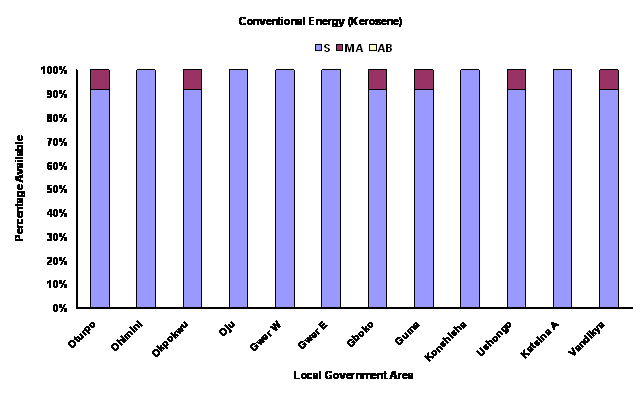
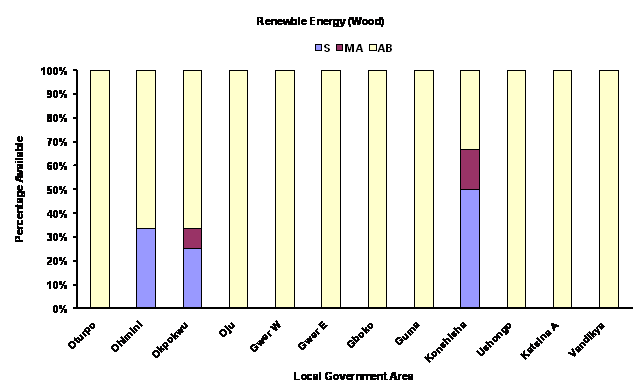
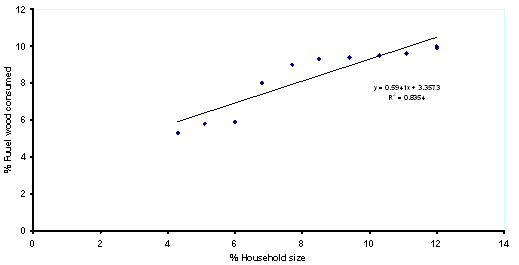
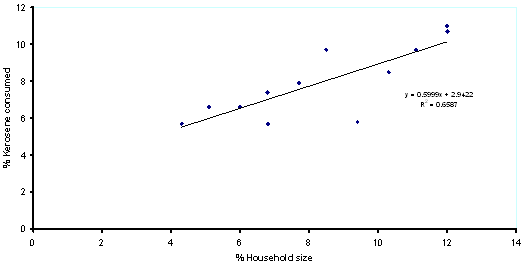
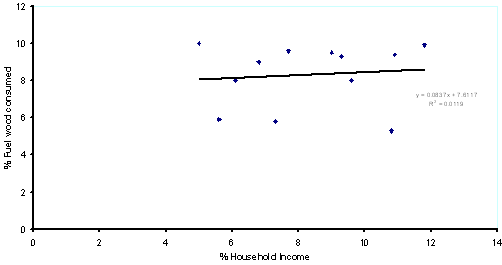
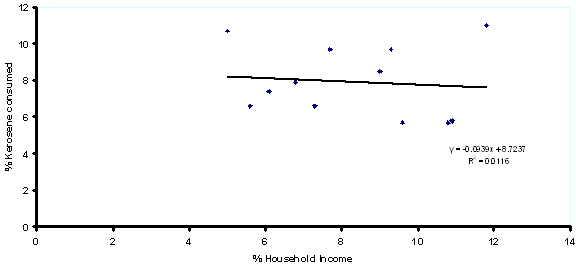
Table 2. Correlation of household size with the fuel options
|
|
House Hold Size |
% Fuel Wood |
% Kerosene |
|
House Hold Size |
1 |
|
|
|
% Fuel Wood |
0.914021 |
1 |
|
|
% Kerosene |
0.811617 |
0.705378 |
1 |
Table 3. Correlation of annual % income with the fuel options
|
|
% Annual Income |
% Fuel wood |
% Kerosene |
|
% Annual Income |
1 |
|
|
|
% Fuel wood |
0.108969 |
1 |
|
|
% Kerosene |
-0.10757 |
0.705398 |
1 |
Table 4. Regression model summary
|
Variables Equation |
R |
R2 |
Adj R2 |
Std Error |
Coeff |
Int |
F |
Fsig |
|
House hold size and Fuel wood y = 0.594x + 3.36 |
0.914 |
0.835 |
0.819 |
0.731 |
0.594 |
3.357 |
50.77 |
3.198 |
|
House hold size and Kerosene y = 0.600x + 2.94 |
0.812 |
0.659 |
0.625 |
1.197 |
0.600 |
2.942 |
19.30 |
0.001 |
|
Household Income and kerosene y = -0.094x + 8.72 |
0.107 |
0.012 |
-0.087 |
2.037 |
-0.094
|
8.724
|
0.117
|
0.739 |
|
Household Income and Fuel wood y = 0.084x + 7.61 |
0.109 |
0.012 |
-0.087 |
1.791 |
0.084 |
7.612 |
0.120 |
0.736 |
|
Ho: F ≤ Fsig; Ha: F > Fsig α = 0. Key R = Multiple R; R2 = R square; Adj R2 = Adjusted R square; Std = Standard; Coeff = Coefficient; Int= Intercept; F = F calculated; Fsig= F significance |
||||||||
Four respondents were chosen from each village area and their ages range from 31 years and above. The data obtained on the ages range show that the highest percentage which was 92.4% was 51years and above whiles those between 31 and 40years were the least with 1.4%. Most of the respondents indicated that their major occupation is farming, while few are engaged in carpentry, retail trading, milling, frying of bean cakes , rope and basket weaving, pottery, wood carving, and local blacksmith. The energy source for the farming activities was muscle power using crude implements.
Discussions
The major occupation of respondents in the study area is farming using primitive and inefficient technologies. This finding confirms the report of the survey by Sambo (1991) and Masekoameng et al (2005), that human and animal power provides the bulk of the energy requirements for agricultural production in Nigerian rural areas.
The largest household size was in the range of 10 to 12, (26.0%), while the least of 4.2% was in the range of 1 to 3. It is generally believed that large family size is an advantage in farming activities.
Five types of energy sources investigated (diesel, petrol, kerosene, wood and solar) shows that fuel wood accounted for 95.8% while kerosene was 4.2%.These agree with the survey conducted by Sambo (1991). The results indicate an accelerated evolvement of deforestation with its attendant’s problems of desertification and soil erosion.
Among the commercial fuels, kerosene is popularly used as supplement for fuel wood particularly during the rainy season.
The highest frequency of cooking is two times a day (66.0%) followed by those who cook three times a day (34.0%) with open fire stoves usually employed, which is an indication of the pattern of energy usage.
The respondents preference for the usage of available energy is in the order fuel wood > kerosene > LPG. This may be due to the educational levels of the respondents. Only those that are aware of other sources of energy and their advantages would want them as energy sources.
About 10% of the villages investigated use petroleum products for small petrol- engine driven electricity generators purely for lighting purpose, kerosene for lighting, heating, cooking and starting of wood fires, diesel for running engines which provide drive to grain milling machines, petrol for small petrol engines which provide drive for the small horse power electricity generator and air compressor, for domestic lighting, and petrol used to power motor cycles which serves as a means of transportation in these villages. Other renewable energy resources available apart from fuel wood include charcoal, agricultural residue, animal dung.
It is estimated that the average daily total consumption of fuel wood and kerosene is 2248kg and 8.42 litres respectively. It is however estimated that the daily consumption of fuel wood and kerosene per household range between 9 – 20kg, and 0 .02 – 0.1 litres respectively. The cost of kerosene in the areas ranges between one hundred and fifty to 200 naira (1- 1.5USD) per litre as at the time of report. The low level of annual income of forty to one hundred and twenty thousand naira (260 – 800 USD) of the respondents suggests their use of fuel wood mainly.
The regression equation connecting fuel wood consumption and household size is given as in table 4, shows that the correlation coefficient, (R = 0.914), is a strong positive relationship between the variables and therefore statistically significant; this means that fuel wood consumption of the respondents increases as the household size increases.
The coefficient of determination (R2= 0.835) means that 83.5% of variation in fuel wood consumption may be predicted by changes in the actual value of household size. Factors other than changes in the value of household size account for 16.5%. The result of the analysis confirms the significance of the relationship as the F – calculated value of 50.77 was greater than F- significance value of 3.198 at 5% probability level. The numerical evidence is strong enough to reject the null hypothesis and conclude that the relationship is linear.
Based on the results of these analyses it could be suggested that household size has significant influence on quantities of fuel wood consumed in rural areas of Benue State of Nigeria which confirms the position of Sanda et al (1991).
The regression equation relating kerosene consumption and household size indicated in table 5 show that the correlation coefficient of R = 0.812 exists between the relationship of household size and quantities of kerosene consumed. The coefficient of determination (R2= 0.659) means that 65.9% of variation in kerosene consumption may be predicted by changes in the actual values of household size. Factors other than changes in the actual values of household size accounted for 34.1%. F -test using 5% significance probability level was used to confirm the significance of the relationship and the numerical evidence is strong enough to reject the null hypothesis. Consequently household size has significance influence on kerosene consumption. Based on the results of these analyses it could be suggested that household size has influence on quantities of kerosene consumed in rural areas of Benue State of Nigeria.
The equation linking income and kerosene consumption give the correlation coefficient value of (R = 0.107) and coefficient of determination which is a weak positive linear association between income and kerosene consumed.
This result can also be interpreted that about 1.2% of the variation in kerosene consumed is caused by income, which is obviously a weak influence.
The result of the F- test (table 5), F-calculated value of 0.117 was less than F- significance value of 0.739 at 5% significance probability level was not significant. Based on this result the null hypothesis is accepted
From information gathered from respondents and the villagers interviewed, kerosene supply to the rural areas was erratic in supply due mostly to unusual high prices which sometimes goes to about 64% or more above government approved prices per litre. This view is also shared by Alabe (1994) when he stated that kerosene and gas are not readily available in most Nigerian rural areas due to inadequate supply
The regression equation (table 5) linking income and fuel wood consumption shows that the correlation coefficient is 0.109 which indicates a weak positive linear association. The coefficient of determination means that about 1.2% of the variation in fuel wood consumed is caused by income which obviously is a weak influence. Factors other than changes in actual value of income accounted for 98.8%. The value of F- test obtained showed that the calculated F- value was less than the significance F- value at 5% probability level (table 5). With this result the null hypothesis is accepted hence the relationship between fuel wood consumed and income is not statistically significant.
The results of these analyses suggest that house hold income has little or no influence on the quantities of fuel wood consumed. It is observed that majority of the rural people collect fuel wood freely from nearby bushes, hence its level of consumption may not be influenced by level of income of respondents.
Conclusions
The findings of this study show that household size had significant impact on the quantities of fuel wood and kerosene consumed, while household income had little or no influence. Fuel wood seems the major source of fuel consumed in the rural areas because of its availability and affordability more than the other sources of energy and kerosene are not readily available due to inadequate supply. Other sources of energy like biogas are not known. The increasing use of fuel wood is having a devastating toll on the forest thus causing soil erosion and desertification on the environment. Energy consumption pattern is characterized by wastage and poor conservation mostly due to ignorance and application of inefficient systems/equipment.
Recommendations
Since our energy requirements would continue to grow with increase in living standard, industrialization and other socio-economic factors, the villagers should be enlightened on the need to discourage the indiscriminate cutting of trees for fuel wood, which has been accused by the international community of contributing towards deforestation with consequent desertification and soil erosion. Government will have to be involved if renewable energy systems are to be adopted as alternatives or complementary fuels for the rural dwellers. This is due to the enormous financial requirements for conducting popularization and demonstration projects which will introduce the new systems to the rural dwellers. These systems should be developed for use for efficient energy resources management and utilization
Rural dwellers in the state should be encouraged by increased educational awareness of the use of renewable energy sources and improved ways of using firewood, charcoal and saw dust for better energy utilization.
References
1. Sambo A. S (Ed), Report of the Rural Energy Survey in Selected local government Areas of Kano, Katsina, Niger and Sokoto states as well as in the Federal Capital Territory, Abuja, 1991.
2. Bureau of Land and Survey Data, Geography of Benue State of Nigeria, Makurdi, 2010.
3. Kwanga, Kereku, Languages and the People of the Benue Region, a descriptive survey, Makurdi, Aboki Publishers, 2007, p.6-8.
4. Okonta A. D, Akinwumi I .O., Siyanbola W .O, A Policy Framework for the Adoption of Solar Water Pumping Technology in Nigeria, Nigeria Journal of Solar Energy, 2008, 19(2), p. 64-85.
5. William M., Pinto F., Energy supply demand integrations, Workshop on alternative energy strategies, Mit Press, Cambridge, 2000, p. 230-257.
6. Alabe M., Household Energy Consumption Pattern in Northern Nigeria, Bayero University Kano, 1994.
7. Daniel P., Edward R., Environmental Science: Earth as living planet, John Willey and Sons, UK, 1998, p. 264-265, 308-310.
8. Sanda A. U., Sambo A. S., Mika Ilu A. S., Fuel wood consumption pattern in Fakai district , A lesson for Rural Energy Planning and Policy in Nigeria, Nigerian Journal of Renewable Energy, 1991, 2(1), p. 54-59.
9. Alli S., Sambo A.S., Asere, A.A., Household Energy Consumption around Bauchi Metropolis and Environs, Nigerian Journal of Tropical Engineering, 2001, 2(1), p 37-48.
10. Obueh J., Using a house hold energy technology to promote small- scale enterprises in rural communities in Nigeria, HEDON Conference on Household Energy Network, 2007, p. 12–17.
11. Ewah O.E., Concept Note for a Proposed Programme on Solar Energy for Rural Development, Proceedings of a National Workshop on “Energizing Rural Transformation in Nigeria: Scaling up Electricity Access and Renewable Energy Market Development”, Federal Ministry of Power and Steel, ICEED, Abuja, Nigeria, 2001, p.180.
12. Energy Commission of Nigeria, Assessment of Energy Options and Strategies for Nigeria: Energy Demand, Supply and Environmental Analysis for Sustainable Energy Development (2000-2030), Report No ECN/EPA/2008/01, 2008.
13. Adeyemi K.O., Asere A.A., Household energy consumption in Bauchi, Journal of Solar Energy, Solar Energy Society of Nigeria, Deepspring Printing Press, Nsukka, 2007, 18, p. 27–35.
14. Adentuji M.O., Adesiyan I.O., Sanusi W.A., House hold energy consumption pattern, in Oshogbo Local Government Area of Osun State, Pakistan Journal of Social Sciences 2007, 4(1), p. 9–13.
15. Etiosa U., Energy Efficiency Survey in Nigeria: A guide for Developing Policy and Legislation, Community Research and Development Centre Benin City - Nigeria, 2009.
16. Obueh J., Using a house hold energy technology to promote small- scale enterprises in rural communities in Nigeria, HEDON Conference on Household Energy Network, 2007, p. 12–17.
17. Ugwu H., Enibe S., Iloeje O., Structure of Energy Consumption in Manufacturing Industries in Nigeria, The Nigerian Journal of Solar Energy, 2005, 15, p 1–13.
18. Agburu J.I., Modern Research methodology, Makurdi, The Solid printing and Publishing Company, 2001.