Effects of Particle Size Distribution on the Burn Ability of Limestone
Ismaila E. SULE
1
Department
of Chemical Engineering,
2Department of Civil Engineering,
3National Agency for Science &
Engineering Infrastructure, P.M.B. 391, Idu,
4Department of Physics,
E-mails: i.suleiman@yahoo.com; aaavazi@yahoo.com; hassanotuoze@yahoo.com*; abdulmajid2015@yahoo.com; omuyar2002@yahoo.com; sadaliyu@yahoo.com
* Corresponding author: Phone: +2348032895989
Abstract
The effect of particle size reduction on the burn ability of Limestone was investigated using the limestone obtained from Obajana Cement Mines. Limestone samples were grinded and were classified into following particles size distribution: 90µm, 200µm, 250µm and 500µm graduated in different sieve sizes. The decomposition rates of these samples were monitored under the same temperature condition in a pre-heated furnace of 1000°C and at constant time interval of 0-35 minutes. From the results of the investigation, the material with particle size distribution of 90µm has the fastest reaction rate of 0.1369g/min and highest lime conversion of 52.0 weight percent; loss on ignition being 48 weight percent. This reaction rate increases as the particle size decreases from 500µm to 90µm.
Keywords
Particle Size Distribution; Decomposition; Reaction Rate; Limestone; Calcinations; Lime.
Introduction
The production of cement is increasing about 3% annually [1] and contribution of Portland cement production worldwide to the greenhouse gas emission is estimated to be about 7% of the total greenhouse gas emissions to the earth’s atmosphere [2]. Calcinations process of cement is heat dependent and contributes to rising global temperature [3]. The production of one ton of cement liberates about one ton of CO2 to the atmosphere, as the result of de-carbonation of limestone in the kiln during manufacturing of cement and the combustion of fossil fuels [4]. The catastrophic effects of global warming are self evident in melting polar ice, flooding, drought and changing flora and fauna of natural habitat for both plants and animals. In slightly over a century, both marine air temperatures and sea surface air temperatures have increased between 0.4°C and 0.8°C [5].
Cement is also among the most energy-intensive construction materials, after aluminium and steel [6], thermal consumption of the order of 3.3 GJ/tonne of clinker produced. Electrical energy consumption is about 90-120 kWh/tonne of cement [7, 8].
Materials are rarely found in the size range required. It is often necessary either to decrease or increase the particle size [9]. When, for example, the starting material is too coarse, and possibly in the form of large rocks, and the final product needs to be a fine powder, the particle size will have to be progressively reduced in stages [10]. The most appropriate type of machine at each stage of the process depends, not only on the size of the feed and of the product, but also on such properties as compressive strength, brittleness and stickiness [11, 12].
Another major challenge of material grinding, especially limestone, is high quartz and calcite rich-material. These are basically siliceous materials, which are glassy and are hard to grind resulting in the high burn ability, poor quality of the product, increase in production cost and adversely increase in the green house effect due to excess emission to the atmosphere.
The aim of this research was to investigating the relative effect of this particle size distribution on the reaction rate for lime conversion.
Material and Method
Generally, the burn ability of any material mainly depends on the chemical composition of the material, Mineralogical characteristics and Particle size.
In [13] was studied the breakage of single particles and discovered that all large lumps of material contain cracks and size reduction which occurs as a result of crack propagation above a critical parameter, F, where:
|
F=τ2·a/Y |
(1) |
where: τ = stress, a = crack length, Y = Young’s modulus.
It is needful to achieve the right particle size for easy burning of limestone, reduction in global warming due to emission from burning, reduction in fuel consumption, reduction in excessive heat radiation, good quality lime and decrease in production cost. Generally speaking, raw mix residue is also one of the factors responsible for a good lime quality. The role of the process is to reduce the particle size of the limestone, get benefit in low heat of calcinations.
In the materials processing industry, size reduction or comminution is usually carried out in order to increase the surface area because, in most reactions involving solid particles, the rate of reactions is directly proportional to the area of contact with a second phase. Thus the rate of combustion of solid particles is proportional to the area presented to the gas, though a number of secondary factors may also be involved. For example, the free flow of gas may be impeded because of the higher resistance to flow of a bed of small particles.
Since it is impossible to estimate accurately the amount of energy required in order to effect a size reduction of a given material, an empirical proposition by [14] and [15] were the earliest precedence. The rate change of energy (dE) to the effect a small change (dL) in the size of unit mass of material is the differential equation:
|
dE/dL = -CLP |
(2) |
This states that the energy required to effect a small change dL in the size of unit mass of material is a simple power function of the size. If p = −2, then integration gives:
|
E = C(1/L2-1/L1) |
(3) |
Writing C = KRfc, where fC is the crushing strength of the material, then:
|
E = KRfc(1/L2-1/L1) |
(4) |
Since the surface of unit mass of material is proportional to 1/L, the interpretation of this law is that the energy required for size reduction is directly proportional to the increase in surface. If p = −1, then:
|
E = Cln(L1/L2) |
(5) |
and, replacing C = KKfC:
|
E = KRfcln(L1/L2) |
(6) |
Equations 4 and 6 were respectively called Rittinger and Kick’s laws. Supposes that the energy required is directly related to the reduction ratio L1/L2 which means that the energy required crushing a given amount of material from a 50 mm to a 25 mm size is the same as that required reducing the size from 12 mm to 6 mm. In equations above, KR and KK are known respectively as Rittinger’s constant and Kick’s constant. Neither of these two laws permits an accurate calculation of the energy requirements; a further improvement by [16] put p = −3/2 in equation 2 gave rise to:
|
|
(7) |
|
|
(8) |


where: q = L1/L2.
If the reduction ratio is written as C = 5Ei, then:
|
|
(9) |

In [16], the terms Ei is the work index, and expresses the resistance of the material to crushing and grinding; and is expressed as the amount of energy required to reduce unit mass of material from an infinite particle size to a size L2 of 100μm, that is q = ∞. However, the general form of Bond’s equation is as follows:
|
|
(10) |

where: E = the work input (kWh/t); Ei = the work index (kWh/t), F80 and P80 are the 80% passing size of the feed and the product (m) respectively.
The work index for a ball mill, Ei, is then calculated from the following equation:
|
|
(11) |

where: P is the closing sieve size (m), Gbp is the grind ability (net gram/rev.).
Quicklime [CaO], is produced from limestone [CaCO3] by calcining (burning) at high temperatures to decompose the limestone to quicklime. Because of this calcination, the product is sometimes called burnt lime or the name is abbreviated to lime. It is an alkaline (basic) product with pH > 12 and is usually a powder or granule with a density greater than 1000 kg/m3. The process of the progressive change of limestone to lime is shown in equation 12 and figure 1.
|
|
(12) |
|
|
|
Figure 1. Limestone dissociation process [Boateng, 2008] |
Heat and mass transport phenomenon govern the calcinations of limestone and depicts the individual steps of calcium carbonate calcinations. [17] and [18] showed that calcinations time increases with increasing particle size distribution. The surface area of the calcium oxide has been found to be directly proportional to the extent of calcium oxide reactivity towards CO2 [19].
Loss of reactivity of lime is caused by over burning, or by holding lime in the kiln at too high a temperature for too long. When lime is calcined, the release of carbon dioxide leaves pores in the lime, creating extra surface area on which the reaction can occur. Excessive burning beyond the required temperature range results in the collapse of these pores, thereby reducing hydration potential of lime with water. Over burning will also result in the impurities in the lime (mainly silica, alumina and iron) forming cement clinker minerals, further reducing the calcium content available for reaction with water [20].
In [21] was studied the calcinations of limestone and concluded that limestone calcinations is limited by heat transfer from the surface of the particle to the reaction front and mass transfer out of the reaction zone (interface). In [17] was related the Arrhenius type of reaction kinetics for reactant limited elementary reaction gave the parameters for reaction rate constant as equation 13:
|
|
(13) |
where: A = Frequency factor, EA = Activation Energy, R = Gas constant, T = Temperature.
In [22], was modelled limestone calcinations as a shrinking core process with surface reaction control according to equation 14:
|
|
(14) |

where: rp = the mean particle radius, Np = the total number of limestone particles, MCaCO3 = the limestone molecular weight, Tp = the particle temperature.
Calcinations process according to [23] starts only if the partial pressure of carbon dioxide in the gas surrounding the limestone surface is less than the decomposition pressure of limestone. The chemical reaction rate Kch of the calcinations process is determined by:
|
|
(15) |
where: PCO2 = the partial pressure of carbon dioxide at the reaction surface of limestone, Peq = the equilibrium partial pressure, KD = the decomposition rate.
|
|
(16) |
|
|
(17) |
|
|
(18) |

where: Apor = the overall reaction surface (representing the surface of internal pores and the outer surface of the sphere) and Ageometry = the surface of the particle (sphere).
Setting porosity to unity, Apore/Ageometry=1; equation 17 becomes:
|
|
(19) |
Higher temperatures and lower CO2 partial pressure favors faster rate of change of the reaction rate than the reverse; the physical reaction rate Kph of the calcinations process is determined from:
|
|
(20) |
where: D = the diffusion coefficient, dpart = the particle diameter, Sh = the Sherwood dimensionless number, RCO2 = the CO2 gas constant and pref = the referent pressure.
According to [24], the overall reaction rate (K`) of the calcinations process is the component of both the physical and chemical reaction rates is related in equation 21:
|
|
(21) |

where: η = the effect of pore efficiency on the chemical reaction rate of calcinations process.
The mass transfer rate of CaCO3, CaO and CO2 are in equations 22 to 24:
|
|
(22) |
|
|
(23) |
|
|
(24) |


where: m`CaCO3 = mass transfer of CaCO3, m`CaO = mass transfer of CaO, m`CO2 = mass transfer of CO2, MCaCO3 = molecular weight of CaCO3 mass, MCO = molecular weight of CO mass, MCO2 = molecular weight of CO2 mass.
Material Preparation
100g lumps of limestone
were obtained from the quarry yard in Obajana Cement
Company,
Sample Preparation / Limestone Characterization
The dried limestone lumps were fed into the Blake jaw crusher for particle size reduction to about 30µm to 750µm. The crushed material was classified and re-classified with the aid of the automatic vibrating sieves of 90µm, 200µm, 250µm and 500µm arranged vertically such in descending order of magnitude and system set in vibration to the tune of amplitude 50m and for 10 minutes. The various proportions retained on the series correspond to the particle size respectively: 10g each of 90µm, 200µm, 250µm and 500µm was weighed into the pre-weighed empty platinum foil crucibles as above and clearly labelled. Another separate10g of 90µm PSD was weighed and re-milled in the milling machine. Five tablets of grinding aids were added to enhance the compatibility of the milled limestone material for better elemental analyses. The re-milled sample was analyzed in the XRF and XRD equipments and the results were obtained.
Samples for Combustion
Pre-weighed 10g samples were kept in the furnace at a constant temperature of 1000°C and the respective weights and weight losses at equal time interval were determined after cooling the samples down to ambient temperature (20-25°C) and transferred into the desiccators for half an hour before weights were taken in each case. The same procedure as above was repeated for other specimens of the various particle size distributions used.
Cementation Index
The relative proportions of other elements will determine the state of purity of the final lime product. This is determined by Cementation index (CI) given by the following equation:
|
|
(25) |
Results and Discussion
Chemical Composition and Molecular Structure
The results generated from the XRF&XRD analysis of limestone ores as well as detail mass balance taken into account of the loss on ignition by the volatiles as a result of combustion. Table 1 present the result of elemental composition carried out using XRF and analysis of crystal structure or molecular structure was carried out using XRD.
Table 1. Percentage Composition of limestone (XRF Analysis)
|
Elements |
Units |
Average |
|
SiO2 |
% |
1.7938 |
|
AI2O3 |
% |
0.3420 |
|
Fe |
% |
0.2210 |
|
CaO |
% |
52.4857 |
|
MgO |
% |
0.4157 |
|
K2O |
% |
0.0771 |
|
Na2O |
% |
0.0055 |
|
SO3 |
% |
0.2053 |
|
Lime Saturation Factor (LSF) |
% |
942.312 |
|
Alumina Moduli (ALM) |
% |
1.5473 |
|
Silica Moduli (SIM) |
% |
5.4666 |
|
Cementation Index (CI) |
- |
0.1059 |
Limestone Combustion
Tables 2-6 show the general trend of weight loss after subjecting the limestone material 90μm, 200μm, 250μm and 500μm particle size distribution to the same thermal condition of 1000°C at equal time interval. The significant weight loss accounts for the presence of volatiles components present, largely carbon (IV) oxide throughout the duration of the combustion process. This phenomenon is termed as loss on ignition (LOI), consequent upon the thermal effect.
Table 2. Combustion Rate of 90µm Particle Size Distribution
|
Runs |
Time, [Minutes] |
Weight of Limestone after combustion [g] |
Weight Loss after combustion [g] |
Rate of decomposition [g/min] |
|
1. |
5 |
8.96 |
1.04 |
0.208 |
|
2. |
10 |
7.94 |
1.02 |
0.204 |
|
3. |
15 |
6.93 |
1.01 |
0.202 |
|
4. |
20 |
6.10 |
0.83 |
0.166 |
|
5. |
25 |
5.69 |
0.41 |
0.082 |
|
6. |
30 |
5.41 |
0.28 |
0.056 |
|
7. |
35 |
5.21 |
0.20 |
0.040 |
Table 3. Combustion Rate of 200µm Particle Size Distribution
|
Runs |
Time, [Minutes] |
Weight of Limestone after combustion [g] |
Weight Loss after combustion [g] |
Rate of decomposition [g/min] |
|
1. |
5 |
9.24 |
0.76 |
0.152 |
|
2. |
10 |
8.53 |
0.71 |
0.142 |
|
3. |
15 |
7.83 |
0.70 |
0.140 |
|
4. |
20 |
7.16 |
0.67 |
0.134 |
|
5. |
25 |
6.53 |
0.63 |
0.126 |
|
6. |
30 |
5.91 |
0.62 |
0.124 |
|
7. |
35 |
5.30 |
0.61 |
0.122 |
Table 4. Combustion Rate of 250µm Particle Size Distribution
|
Runs |
Time, [Minutes] |
Weight of Limestone after combustion [g] |
Weight Loss after combustion [g] |
Rate of decomposition [g/min] |
|
1. |
5 |
9.38 |
0.62 |
0.124 |
|
2. |
10 |
8.79 |
0.59 |
0.118 |
|
3. |
15 |
8.21 |
0.58 |
0.116 |
|
4. |
20 |
7.64 |
0.57 |
0.114 |
|
5. |
25 |
7.08 |
0.56 |
0.112 |
|
6. |
30 |
6.53 |
0.55 |
0.110 |
|
7. |
35 |
6.00 |
0.53 |
0.106 |
Table 5. Summary of Combustion Rate of 500µm Particle Size Distribution
|
Runs |
Time, [Minutes] |
Weight of Limestone after combustion [g] |
Weight Loss after combustion [g] |
Rate of decomposition [g/min] |
|
1. |
5 |
9.61 |
0.39 |
0.078 |
|
2. |
10 |
9.25 |
0.36 |
0.072 |
|
3. |
15 |
8.93 |
0.32 |
0.064 |
|
4. |
20 |
8.63 |
0.30 |
0.060 |
|
5. |
25 |
8.37 |
0.26 |
0.052 |
|
6. |
30 |
8.14 |
0.23 |
0.046 |
|
7. |
35 |
7.93 |
0.21 |
0.042 |
Table 6. Rate of Decomposition of limestone at PSD
|
Time, [Minutes] |
Rate of Decomposition (g/min) |
|||
|
I |
II |
III |
IV |
|
|
5 |
0.208 |
0.152 |
0.124 |
0.078 |
|
10 |
0.204 |
0.142 |
0.118 |
0.072 |
|
15 |
0.202 |
0.140 |
0.116 |
0.064 |
|
20 |
0.166 |
0.134 |
0.114 |
0.060 |
|
25 |
0.082 |
0.126 |
0.112 |
0.052 |
|
30 |
0.056 |
0.124 |
0.110 |
0.046 |
|
35 |
0.040 |
0.122 |
0.106 |
0.042 |
Chemical and Molecular Compositions
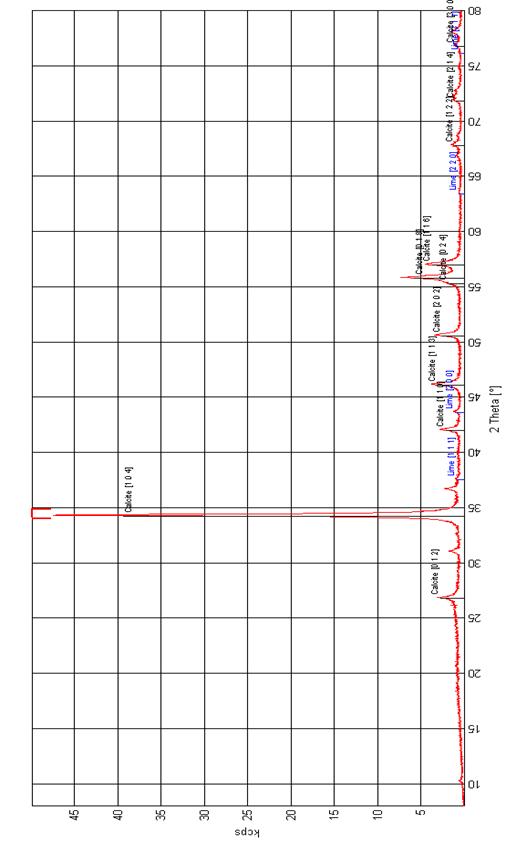
X-ray diffraction pattern of CaCO3 is shown in Figure 2. The characteristic peaks of 2θ = 67.78°, 71.81° and 76.77° in the XRD patterns show that these are single diffraction apexes without noise interference and since having uniform grain sizes, are suitable for use in grain size calculations.
|
|
|
Figure 2. XRD of Obajana Limestone Raw Mix |
CaO accounts for 52.4857% which meets 50-56% recommended by [25]. The C.I. of the limestone is 0.1059 and the amount of impurities, expressed as the oxides of magnesium, silicon, aluminium and iron, is less than 5%; the lime is named as fat lime, rich lime or high calcium lime as contained in Appendix 1 [26].
Limestone Combustion Rate
From Table 6, the 90μm particle size distribution shows that as the decomposition reaction proceeds, there is as well sharp decreasing trend in the reaction rates than expected with the 200μm, 250μm and 500μm particle size distribution respectively. The 90μm PSD has the overall average decomposition rate of PSD of 0.1343g/min, while that of 200μm, 250μm and 500μm PSDs have 0.1369g/min, 0.088 g/min and 0.046 g/min respectively. From the graphs of average rate of decomposition against time in figure 3, it showed that the 90μm PSD has its gradient steeper than any of the 200μm, 250μm and 500μm PSD respectively.
|
|
|
Figure 3. Decomposition Rate of Limestone with Time |
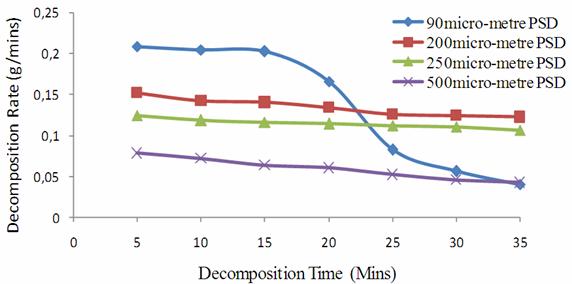
The gradient which is the decomposition rate, justified that 90μm PSD is the fastest in its decomposition rate and hence the need to maintain particle size distribution below 90μm to achieve the desired promptness in lime conversion.
From the result of the residual materials left after combustion, 90μm PSD yielded 52.10%, 200μm PSD yielded 47.00%, 250μm PSD yielded 40.00% and 500μm PSD yielded 21.30% lime. The result presented above on the lime analyses carried out in each investigation clearly indicates 90μm PSD has all its lime content almost converted to 100% yield. While the 200μm, 250μm and 500μm PSD are partially converted which requires further calcinations due to the effect of the unreacted carbonates present in the limestone material.
Generally, the decomposition rate of limestone to produce lime largely depends on the oven temperature even though it was maintained constant all through the process. Hence, maximizing the lime production, the particle size distribution of the limestone should be appreciably reduced since decomposition rate for limestone material at various particle size distribution increases as the particle size decreases.
Conclusions
The following conclusions could be drawn from samples analysis and material balance for the entire combustion processes:
¸ The elemental composition of Obajana limestone deposit has 52.5% lime (CaO) constituent and within 50-56% range for high quality lime while other elements or compounds present are in minor traces or less than 5% [25]. The proportion of CO2 present in CaCO3 raw mix is 44. 5% while the remaining 3.0% accounts for impurities.
¸ Furthermore, the Cementation Index called which is another measured of purity was determined to be 0.1059 which falls under the category of good quality lime called ‘fat lime’ [26].
¸ Finally, it can be generalized that the particle granulometry has an active role to play in the rate of the decomposition of the limestone to produce lime. That is evident in the reaction rate decreases as the particle size decreased from 500µm to 90µm.
Acknowledgements
The Authors sincerely appreciation the Management and Staff of Dangote Cement Company, Obajana, Kogi State, Nigeria; for carrying the basic tests necessary for the research.
Appendix
Appendix 1. Cementation Index for Various Limes Types [26]
|
Lime Description |
Cementation Index |
Active Siliceous Compounds |
|
Fat Limes |
Close to Zero |
Very Little |
|
Slightly (or weakly) Hydraulic Limes |
0.3 to 0.5 |
Around 8% |
|
Moderately Hydraulic Limes |
0.5 to 0.7 |
Around 15% |
|
Eminently Hydraulic Limes |
0.7 to 1.1 |
Around 25% |
|
Natural Cements |
1.7 |
Up to 45% |
References
1. McCaffrey R., Climate Change and the Cement Industry, Global Cement and Lime Magazine, Environmental Special Issue, 2002, 15(19), p. 15-19.
2. Malhotra V.M., Introduction: Sustainable Development and Concrete Technology, ACI Concrete International, 2002, 24(7), p. 22.
3.
IPCC, IPCC Special
Report on Carbon Dioxide Capture and Storage, Prepared by Working Group III
of the Intergovernmental Panel on Climate Change [Metz, B., O. Davidson, H. C.
de Coninck, M. Loos, and L. A. Meyer (eds.)].
4.
5. Sheppard M.C.; Socolow R.H., Sustaining Fossil Fuel Use in a Carbon-Constrained World by Rapid Commercialization of Carbon Capture and Sequestration, AIChE. 2007, 53, p. 3022-3028.
6. Mehta P.K., Burrows R.W., Building Durable Structures in the 21st Century, ACI Concrete International, 2001; 23(03), p. 57-63.
7. Giddings D., Eastwick C.N., Pickering S.J., Simmons K., Computational Fluid Dynamics Applied to a Cement Precalciner, Proc. Instn. Mech. Engrs., 2000, 214(A), European Commission.
8. European Commission (EC), Integrated Pollution Prevention and Control. Reference Document on Best Available Techniques in the Cement and Lime Manufacturing Industries, 2001.
9. Morrel S., Rock Characterisation for high pressure grinding rolls circuit design, equation, Proceedings of International Autogenous and Semi Autogenous Grinding technology, Vancouver, 2006, IV, p. 267-278.
10. Pasikatan M.C., Milliken G.A. Steele J.L., Haque E., Spillman C.K., Modelling the Energy Requirements of First–Break Grinding. American Society of Agricultural Engineers, 2001, 44(6), p. 1737-1744.
11. Jankovic H.D., Mehta R., Relationships between Comminution Energy and Product Size for A Magnetite Ore, The Journal of the Southern African Institute of Mining and Metallurgy, 2010, 110, p.141-164.
12. Kano J., Mio H., Saito F., Correlation of grinding rate of gibbsite with impact energy balls, A.I.CH.E.JL., 2000, 46(8), p. 1694-1697.
13. Bemrose C.R., Bridgwater J., A Review of Attrition and Attrition Test Methods, Powder Technology, 1987, 49(2), p. 97-126.
14.
Kick F., Das Gesetz der proportionalen Widerstande und seine anwendung felix,
15.
Rittinger R.P., Lehrbuch
der Aufbereitungskunde,
Ernst and
16.
Bond F.C., Crushing
and grinding calculations, Part I-II. Br. Chem.
17. Boateng A.A., Rotary Kilns-Transport Phenomena and Transport Processes, Butterworth- Heinemann Elsevier, 2008.
18. Kumar G.S., Ramakrishnan A., Hung Y.T., Lime Calcination, In Handbook of Environmental Engineering, volume 5: Advanced Physicochemical Treatment Technologies, Wang, Lawrence K., Hung, Yung-Tse, Eds. Humana Press, Totowa, NJ, 2007.
19. Sakadjian B.B., Iyer M.V., Gupta H., Fan L., Kinetics and Structural Characterization of Calcium-Based Sorbents Calcined under Subatmospheric Conditions for the High-Temperature CO2 Capture Process, Ind. Eng. Chem. Res., 2007, 46, p. 35-42.
20.
Auststab (online), Available at: www.auststab.com.au, (accessed
21. Dennis J.S., Hayhurst A.N., The effect of CO2 on the Kinetics and Extent of Calcination of Limestone and Dolomite Particles in Fluidized Beds, Chemical Engineering Science, 1987, 42(10), p. 2361-2372.
22. Mujumdar K.S., Ganesh K.V., Kulkarni S.B., Ranade V.V., Rotary cement kiln simulator (rocks): Integrated modeling of pre-heater, calciner, kiln and clinker cooler, Chemical Engineering Science, 2007, 62, p.2590-2607.
23. Stanmore B.R., Gilot P., Review- A Calcination and carbonation of limestone during thermal cycling for CO2 sequestration, Fuel Process. Technology, 2005, 86, p. 1707-1743.
24.
Levenspiel O., Chemical Reaction
Engineering, Second ed. J. Wiley and Sons,
25.
Evin C., Archaeometrical
Investigation of Some Seljuk Plasters, MSc Thesis Submitted to the
26.
Holmes S., Wingate M., Building
with Lime: A Practical Introduction, Intermediate Technology Publications,