Complex Low Cost Data Acquisition System for the Study of Dust Deposition on PV Collectors
Andrei BUTUZA
Technical University of Cluj-Napoca; Faculty of Mechanical Engineering; Dept. of Mechanical Engineering; Bd. Muncii 103-105, Cluj-Napoca; Romania
E-mail: Andrei.Butuza@termo.utcluj.ro
Corresponding author: (+) 40 264 401605; Fax: (+) 40 264 592 055
Abstract
The study presents original design, the main components and some samples of results following the implementation of a complex dedicated data acquisition system, designed for experimental investigation of soiling effects on the performances of solar photovoltaic collectors. The large number of parameters involved in this study, leaded to the use of two independent data acquisition systems: a weather station and a new original dedicated acquisition system based on low cost components. Data provided by the two systems were combined and synchronised after testing two variants of algorithms and software. The obtained results proved that the acquisition performed correctly and the system can support future analyses concerning the studied phenomena. It was found that results of monitoring the density of particulate matter in the air, for Cluj-Napoca, seems to be presented for the first time in this study.
Keywords
Dust; Soiling; Photovoltaic; Data Acquisition; Data Synchronising; Particulate Matter.
Introduction
The study presents data acquisition system, specially developed for an exploratory experiment concerning the impact of dust deposition on the solar photovoltaic (PV) collectors.
This experiment is continuing previous studies concerning the renewable energies, at the Technical University of Cluj-Napoca [1-3].
When the design and construction of photovoltaic plants is taken into consideration, all major factors affecting the energy performances should be considered and availability of solar radiation is the most important one [4-5]. The soiling is considered one of the most important secondary causes of efficiency drop in operational solar photovoltaic plants, together with temperature [5-7], angle of incidence, partial shading, etc. [5]. Different factors affecting the energy performances of photovoltaic systems are presented in many previous studies [8-10].
The dust influence on performances of photovoltaic systems, have been considered an important issue and have been investigated [11-12].
Several studies concerning data acquisition systems for monitoring renewable energy equipment were identified in the literature review [1, 5, 13].
This study is presenting original data acquisition design, based on two integrated independent systems: a commercial weather station and a complex dedicated low cost data acquisition equipment, manufactured in the frame of this study. Both components were connected to the same computer. The data synchronisation and concatenation was between the most important requirements of data processing phase of the study.
The exploratory character of the experiment is derived from the limited resources involved. It were used mainly components of low cost type. In this category are classified both the weather station and the major components of the manufactured data acquisition system: motherboard, sensors, etc.
The aim of the study was to present the design, the data processing methods and some preliminary results of the complex low cost data acquisition system, specially designed for the study of soiling effects on photovoltaic collectors.
Material and Method
The study was realised at the Technical University of Cluj-Napoca, on the roof of a new wing building. In the experiment were used four identical solar photovoltaic collectors, facing south and inclined at a fixed 37° angle, representing the optimum solar tilt angle for Cluj-Napoca [4].
The experiment was conceived to investigate on one side the process of dust deposition on the glazed surfaces of the collectors and on other side the efficiency of a passive method for limiting the dust deposition on collectors and of an active method for cleaning the collectors. In order to limit the soiling was used a nanometric hydrophobic coating layer of the "nanoShell for Solar PV" solution that facilitate the self-cleaning process under natural rainfall. In order to clean the dust from the collectors surfaces, was used a water film based cleaning system for which a patent was requested.
The four photovoltaic collectors were equipped as follows: one collector was considered as reference and was used as it was manufactured (PV1); one collector was equipped with the water film based cleaning system (PV2); one collector was treated with hydrophobic solution and was also equipped with the water film based cleaning system (PV3); one collector was only treated with hydrophobic solution (PV4).
The water film used for cleaning the photovoltaic collectors was realised on the top side of the collectors by using a perforated distributor and was collected on the bottom side of the collector by an eave. A rendering of the experimental setup, including the four photovoltaic collectors, the distributors mounted on the top side and the eaves mounted on the bottom side, is presented in Figure 1.
The water is continuously circulated by a pump that suck from an insulated water tank and discharge into the upside distributor. From the bottom eave the water is flowing back into the tank by gravity through a filter. Each of the two water film based cleaning systems is operating independent, when solar radiation became enough great to start up the pumps, powered directly from the corresponding photovoltaic collectors.
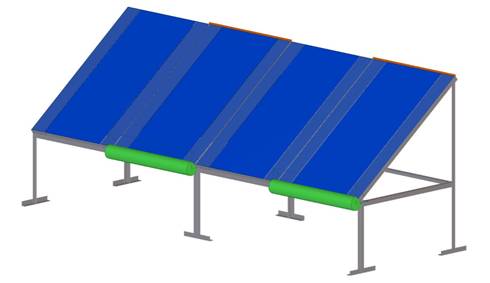
Figure 1. Experimental setup front view rendering
The photography of the four photovoltaic collector of the experimental setup is presented in Figure 2.
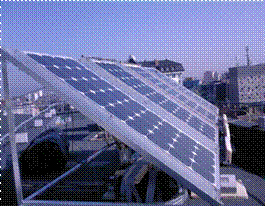
Figure 2. The photovoltaic collectors of the experimental setup
The photovoltaic collectors are of STP075S-12/Bc type, manufactured by the company Suntech [14]. All the photovoltaic collectors were connected to identical resistive loads of SR Pasives R80W-4R7 type [15]. The water pumps are of Phobya DC12-220 type [16].
The experimental study of dust deposition and its influences on the photovoltaic collector's performances was based on a complex data acquisition system with two major subsystems: a weather station and dedicated data acquisition equipment, manufactured mainly by low cost components. The two independent data acquisition equipment are connected to the same computer and data are recorded in different files according to each system particularities.
The weather station data acquisition started at 04.07.2013 and the dedicated data acquisition started at 10.08.2013. The experimental setup was completed at 21.10.2103 when the resistive loads were connected. The experiment ended at 21.11.2013, when the outside temperatures decreased with regularity in the vicinity of 0°C, and the decision to interrupt the experiment for the winter period was taken.
The schematic diagram of the data acquisition system is presented in Figure 3.

Figure 3. Schematic diagram of the experimental setup
The weather station is of TFA Primus WS-2800 type [17] and is provided with a built in data acquisition system, that was set to record all the parameters with the time step of 1 minute, representing the lower possible value. The main parameters measured by the weather station and important for the experiment are: air temperature, relative humidity, wind speed, wind direction and rainfall.
The weather station characteristics are indicated in Table 1 and photography of the weather station used in the experiment is presented in Figure 4.
Table 1. TFA Primus WS-2800 weather station characteristics
|
Parameter |
Value |
|
Outside Temperature |
-40...+59.9°C |
|
Outside Relative Humidity |
1...99 % |
|
Wind Speed |
0...180 km/h |
|
Wind Direction |
0 360° (22.5° steps) |
|
Rain fall |
0...9999.5 mm |

Figure 4. TFA Primus WS-2800 weather station used in the experiment
The weather station storage capacity of the monitored parameters is of 1750 sets of values. To achieve a continuous monitoring, daily measured data are downloaded to the computer, to minimise the breaks in data acquisition.
The dedicated and "home-made" manufactured data acquisition system was developed based on an Arduino Mega 2560 board [18] and its open-source software platform. The parameters important for the study, measured by the dedicated data acquisition system are: global solar radiation in the plane of the photovoltaic collectors, the density of particulate matter in the air, current, voltage, photovoltaic collector's temperatures, water temperatures and water levels in the tanks.
The electric parameters of the photovoltaic collectors, current and voltage were measured using an Attopilot 90A complex sensor [19], of which technical characteristic are presented in Table 2.
Table 2. Attopilot 90A current and voltage sensor characteristics
|
Parameter |
Value |
|
Voltage |
3.3/ 5 V |
|
Sensitivity at 3.3 V supply |
-0.3 51.8 V |
|
Sensitivity at 5 V supply |
-0.3...60 V |
|
Maximum Measured Current |
89.4 A |
|
Operating Temperature |
-55 +125°C |
The connection of the current and voltage sensors, on the wiring diagram of the experimental setup, is presented in Figure 5.
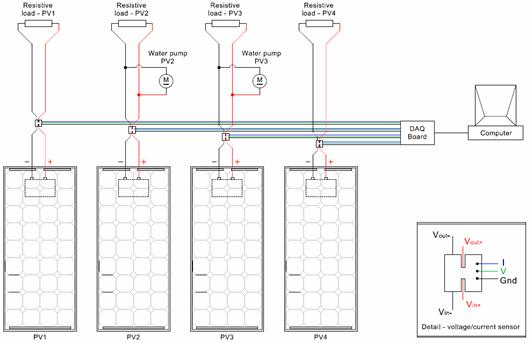
Figure 5. Wiring diagram of the of the current and voltage sensors
The temperatures of the photovoltaic collectors and of the water in the tanks were measured using DS18B20+ temperature sensors [20]. The main characteristics of the temperatures sensor are listed in Table 3.
Table 3. DS18B20+ temperature sensor technical data
|
Parameter |
Value |
|
Voltage |
3 5.5 V |
|
Sensitivity |
-55...+125°C |
|
Accuracy |
±0.5°C (-10...+85°C) |
|
Resolution |
9 12 bit (0.5°C/0.25°C/0.125°C/0.0625°C) |
The global solar radiation in the plane of the collectors was measured using a pyranometer of Davis 6450 type [21]. The characteristics of the pyranometer are indicated in Table 4 and photography of the actual device used in the experiment is presented in Figure 6.
Table 4. Davis 6450 pyranometer technical data
|
Parameter |
Value |
|
WMO* Rating |
Second class |
|
Spectrum |
400 1100 nm |
|
Angle of view |
180° |
|
Range |
0 1800 W/m2 |
|
Resolution |
1 W/m2 |
|
Accuracy |
±5 % +45 W/m2 for each 30 m of cable |
|
Sensitivity |
1.67 mV/W/m2 |
|
Temperature dependency |
±0.12 % /°C against 25°C |
|
Response time |
50 60 s |
|
Operating temperature |
-40 +65°C |

Figure 6. Davis 6450 pyranometer used in the experiment
The density of particulate matter in the air was measured with a sensor of GP2Y1010AU0F type, manufactured by the company SHARP [22] that provides an analogue output voltage proportional to the amount of particles in the air. The characteristics of the sensor are indicated in Table 5 and photography of the sensor mounted in the solar radiation shell is presented in Figure 7.
Table 5. SHARP GP2Y1010AU0F airborne dust density sensor technical data
|
Parameter |
Value |
|
Voltage (Vcc) |
4.5...5.5 V (5 V optimum) |
|
LED Voltage (VLED) |
−0.3...Vcc |
|
Operating Temperature |
−10...+65°C |
|
Sensitivity |
0.35/0.5/0.65 V/0.1mg/m3 (min./typical/max. value) |
|
Current consumption |
-/11/20 mA (min./typical/max. value) |
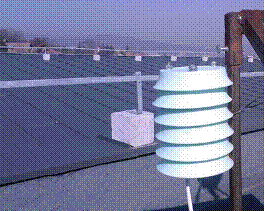
Figure 7. GP2Y1010AU0F particulate matter sensor
The dedicated data acquisition system was designed and implemented with a data recording time step of 6 seconds.
For the recorded data processing, the first problem was determined by the coexistence of two independent data acquisition systems:
- A weather station that records data with a time step of 1 minute (minimum configurable) in the file Data.txt;
- A dedicated data acquisition system configured to record data with a time step of 6 seconds (to increase the accuracy of the experiment) in the file Dataout.xlsb.
Data from the two files with different time step were combined and synchronised in a single file Sensordata.xlsb with the time step of 1 minute, with dedicated software. The software was tested for data sample, in two versions for selecting the data recorded by dedicated acquisition system:
- In the first version were selected the first values recorded in each minute (the simplest option);
- In the second version for each record was calculated the average between all the values registered in each minute (the most precise option);
After comparing the results it was observed that differences between the obtained data were insignificant (less than 5%) and was continued with the selection of the first data recorded in each minute (the simplest option).
The data file provided by the weather station, of .txt type, was previously converted into Excel Binary Workbook (.xlsb) type and then all the columns corresponding to measured parameters not used in the study were deleted.
Results
Some examples of the recorded data, by the two independent data acquisition systems are presented as follows, together with results concerning the application of described data processing methodology.
As example of results obtained from data recorded by the weather station acquisition system, the outside temperature variation, in the period 4.07.2013 - 21.11.2013 is presented in Figure 8.
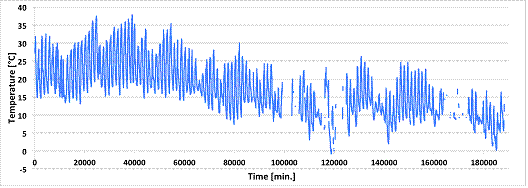
Figure 8. Outside temperature variation 4.07.2013 - 21.11.2013
As example of results obtained from data recorded by the dedicated acquisition system, are presented the global solar radiation in the plane of the collectors, the voltage variation, and the density of particulate matter in the air. These parameters are presented in Figures 9, 10 and 11.
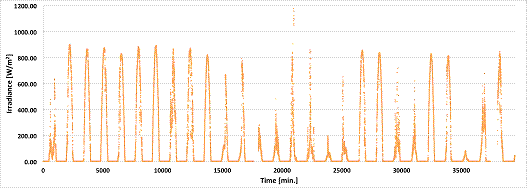
Figure 9. Global solar radiation in the collector's plane, between 21.10 - 16.11.2013
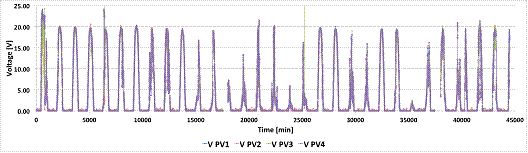
Figure 10. Voltage variation measured between 21.10 - 21.11.2013
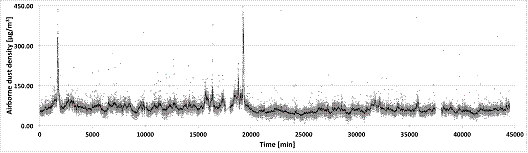
Figure 11. Density of particulate matter in the air between 21.10 - 21.11.2013
As results of the data combining and methodology are presented the comparative values provided by the two variants of algorithms and software. For testing the two data synchronising options, was used data sample from 27.10.2013.
Voltage recorded with a time step of 6 seconds and voltage selected for synchronising with weather station are presented in Figure 12.
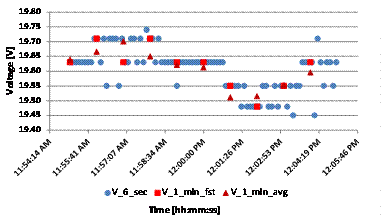
Figure 12. Voltage measured and selected for synchronising with weather station
(V_6_sec) - Voltage measured with time step of 6 seconds;
(V_1_min_fst) - Voltage selected with time step of 1 minute as the first value in the minute;
(V_1_min_avg) - Voltage selected with time step of 1 minute as average between all values of each minute.
Electrical current, recorded with a time step of 6 seconds and current selected for synchronising with weather station are presented in Figure 13.
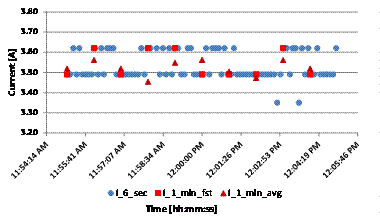
Figure 13. Current measured and selected for synchronising with weather station
(I_6_sec) - Current measured with time step of 6 seconds;
(I_1_min_fst) - Current selected with time step of 1 minute as the first value in the minute;
(I_1_min_avg) - Current selected with time step of 1 minute as average between all values of each minute.
The relative differences (errors) between the values selected with the two methods are presented in Figure 14.

Figure 14. Relative differences (errors) between the values selected with the two methods
(Er_V_1_min) - Relative differences (errors) between selected values of voltage;
(Er_I_1_min) - Relative differences (errors) between selected values of current.
Discussion
The results provided by the weather station data acquisition system are covering the largest period of time, between 4.07.2013 - 21.11.2013, because this was the first system put into operation. Curve of variation are available for all measured parameters and the outside temperature variation is presented only as example. From the analysis of Figure 8 it can be observed that the general trend of outside temperature variation is of decrease, as expected. On the chart can be identified the periods of summer (the first part of interval), of early autumn (the middle part of the interval) and of late autumn (the last part of interval). Such data are provided for all the measured weather parameters.
The results provided by the dedicated data acquisition system are covering the period of time, between 21.10.2013 - 21.11.2013. The monitored parameters allow complex analyses concerning dust depositions and effects on the solar photovoltaic collector's parameters of performance. The originally expected qualitative character of the results, according to the exploratory character of the study, was exceeded by a multitude of quantitative results and conclusions that could be obtained. These analyses are beyond the aim of this study. The solar radiation and the voltage, presented in Figures 9 and 10 are presented only as examples. It can be observed that voltage is depending by solar radiation, as expected.
Extended discussion is presented for the results provided by the density of particulate matter in the air sensor. It was found that such results for the location in Cluj-Napoca, seems to be presented for the first time.
The graph in Figure 11 presents some peaks, with very high amount of particles in suspension. These values are corresponding to periods of fog and it seems that sensor could not make the difference between particulate matter and water particles in the fog.
Neglecting the mentioned peaks, the density of particles was situated in the first third part of the experiment in the range of (50...100)) μg/m3, and in the last two thirds of the experiment around 50 μg/m3.
The measured values, presented in Figure 11, can be compared with the reference values indicted by regulations limiting the amount of particles in the air, due to health reasons. The particles below 10µm can settle in the bronchi and lungs and cause health problems. The particles below 2.5μm tend to penetrate into the gas exchange regions of the lung.
Extended information concerning the dimensions of different types of particulate matter is presented in public documents [23, 24]. The majority of particles in the air like: spores, house dust, bacteria, cat allergens, viruses, settling dust, suspended atmospheric dust, cement dust, ash, oil smoke, smog, tobacco smoke, soot, gaseous contaminants, etc., presents dimensions lower than 10µm, thus being dangerous for human health.
The regulation concerning the allowed amount of particulate matter (PM) with sizes below 10 µm is called PM10 or PM10 and the regulation concerning the allowed amount of airborne particulate matter (PM) with sizes below 2.5 µm is called PM2.5 or PM2.5.
As it was already mentioned, the majority of particulate matter enters under the incidence of PM10 or PM2.5.
Public informations about the air quality and about the limits admitted by PM10 and PM2.5 are presented in [24, 25]. A selection of admitted limits for particulate matter according to PM10 and PM2.5 regulations in different countries is presented in Table 6.
Table 6. Admitted limits for particulate matter according to PM10 and PM2.5
|
Zone |
Parameter |
PM10 |
PM2.5 |
|
European Union |
Yearly average |
40 µg/m3 |
25 µg/m3 |
|
Daily average (24 hours) |
50 µg/m3 |
- |
|
|
Allowed number of exceedances per year |
35 |
- |
|
|
Japan |
Yearly average |
- |
15 µg/m3 |
|
Daily average (24 hours) |
100 µg/m3 |
35 µg/m3 |
|
|
Allowed number of exceedances per year |
- |
- |
|
|
China |
Yearly average |
40 µg/m3 |
50 µg/m3 |
|
Daily average (24 hours) |
15 µg/m3 |
35 µg/m3 |
|
|
Allowed number of exceedances per year |
- |
- |
|
|
U.S.A. |
Yearly average |
- |
15 µg/m3 |
|
Daily average (24 hours) |
150 µg/m3 |
35 µg/m3 |
|
|
Allowed number of exceedances per year |
1 |
- |
The most recent public document of the European Commission, available on its web site, concerning the situation of emissions and particulate matter in all the EU countries [26], contains information dating from 2009. The situation concerning Romania is presented in Table 7.
Table 7. Situation of particulate matter for Romania (2009)
|
Locality |
PM10 (day) |
PM10 (year) |
|
Iaşi |
↑ |
↑ |
|
Iaşi NE |
↑ |
↓ |
|
Brăila |
↓ |
↓ |
|
Constanţa |
↓ |
↓ |
|
Galaţi |
↓ |
↓ |
|
Galaţi SE |
↓ |
↓ |
|
Piteşti |
↓ |
↓ |
|
Ploieşti |
↑ |
↓ |
|
Ploieşti S |
↓ |
↓ |
|
Craiova |
↑ |
↓ |
|
Craiova SV |
↑ |
↑ |
|
Timişoara |
↑ |
↑ |
|
Timişoara V |
↓ |
↓ |
|
Cluj-Napoca |
= |
= |
|
Baia Mare |
↑ |
↓ |
|
Baia Mare NV |
↓ |
↓ |
|
Brasov |
↑ |
↑ |
|
Copşa Mică Mediaş |
↓ |
↓ |
|
Copşa Mică Mediaş Centre |
↓ |
↓ |
|
Bucureşti |
↑ |
↑ |
|
Ilfov |
↑ |
↑ |
|
↑ - exceeding the limit; ↓ - below limit; = missing data |
||
Between all the localities from Romania listed in the EC situation, only for Cluj-Napoca are missing data concerning particulate matter. Based on this observation it seems that this study is presenting for the first time measured information concerning particulate matter for Cluj-Napoca.
It is mentioned that in the frame of the experiment, was measured the total quantity of particulate matter and not necessary the quantity of particulate matter with dimensions lower than 10µm, but in the context of missing any kind of data concerning this parameter, for Cluj-Napoca, the results presented in Figure 11 are important. According to the measurements, the admitted daily PM10 value was systematically exceeded for about one third of the study period and for the rest was in the vicinity of this limit with frequent exceeds.
The results of the two versions of synchronising and combining data provided by the two independent data acquisition systems, presented in Figures 12 and 13 are indicating that both version provide enough accuracy of data selection. The relative differences (errors) between the two versions, presented in Figure 14 are below 1% for voltage and below 5% for current. In these conditions it was justified to apply the simplest method of selecting the first values from each minute, from the data recorded at 6 seconds. Studies that dont need correlations with the weather parameters can be still realised based on original data recorded with the time step of 6 seconds.
Conclusions
A complex data acquisition system for the study of soiling impact on the performances of solar photovoltaic collectors was successfully designed and implemented at the Technical University of Cluj-Napoca by integrating a weather station data acquisition system and original dedicated data acquisition system.
Because of the low cost type of the most components, the experiment was conceived with explorative character, but the obtained results were capable not only to reveal the trend of studied phenomena but also to support quantitative analyses beyond the aim of the study.
The obtained results refer a very large number of different parameters: weather parameters, dust deposition parameters, operating conditions parameters, performances parameters, etc., justifying the complex character of the data acquisition system.
The synchronising and combining procedures and algorithms for values provided by the two independent data acquisition systems, were carefully analysed and compared before their implementation.
The provided data concerning the density of particulate matter in the air, for Cluj-Napoca seems to be presented for the first time in this study.
Acknowledgements
This paper was supported by the project "Improvement of the doctoral studies quality in engineering science for development of the knowledge based society-QDOC contract no. POSDRU/107/1.5/S/78534, project co-funded by the European Social Fund through the Sectorial Operational Program Human Resources 2007-2013.
References
1. Bălan M.C., Damian M., Jäntschi L., Preliminary Results on Design and Implementation of a Solar Radiation Monitoring System, Sensors, 2008, 8, p. 963-978.
2. Bălan M.C., Jäntschi L., Bolboacă S.D., Damian M., Thermal Solar Collectors Behaviour in Romania, Polish Journal of Environmental Studies, 2010, 19(1), p. 231-241.
3. Bălan M.C., Todoran T.P., Bolboacă S.D., Jäntschi L., Assessments about Soil Temperature Variation under Censored Data and Importance for Geothermal Energy Applications. Illustration with Romanian Data, Journal of Renewable and Sustainable Energy, 2013, 5, p. 1-13.
4. Duffie J.A., Beckman W.A., Solar Engineering of Thermal Processes, 2nd ed. Wiley-Interscience, 1991.
6. Caron J.R., Littmann B., Direct Monitoring of Energy Lost Due to Soiling on First Solar Modules in California, IEEE Journal of Photovoltaics, 3(1), 2013, p. 336-340.
7. Johansson T.B, Kelly H, Reddy A.K.N., Williams R.H., Renewable Energy-Sources for Fuels and Electricity, 1992, 1st ed. Washington: Island Pres.
8. Brinkworth B.J., Sandberg M., Design Procedure for Cooling Ducts to Minimise Efficiency Loss Due to Temperature Rise in PV Arrays. Solar Energy, 2006, 80(1), p. 89-103.
9. Nann S., Emery K., Spectral Effects on PV Device Rating. Solar Energy Materials and Solar Cells, 1992, 27, p. 189-216.
10. Gan G., Effect of Air Gap on the Performance of Building-Integrated Photovoltaics, Energy. 2009, 34(7), p. 13-21.
11. El-Shobokshy M.S., Hussein F.M., Effect of Dust With Different Physical Properties on the Performance of Photovoltaic Cells, Solar Energy, 1993, 51(6), p. 505-511.
12. Tian W., Wang Y., Ren J., Zhu L., Effect of Urban Climate on Building Integrated Photovoltaics Performance. Energy Conversion and Management, 2007, 48(1), p. 1-8.
13. Calzolari P.U., Cardinal, G.C., Garull, A., Nobil, D., Zan, A., Experiments on Combined Photovoltaic-Aeolian Electric Generation in a Residential Stand-Alone System, Commission of the European Communities, (Report) EUR, 1982, p. 106-111.
14. ***, High Efficiency, High Quality PV Module. Available at: http://www.energymatters.com.au/images/suntech/STP085S-12Bb.pdf (accessed 10/07/2013)
15. ***, Power (Ribbon) Wire Wound Resistors. Available at: http://www.tme.eu/en/Document/0ff7219a5068579357589fcbf949779b/QH_QL.pdf (accessed 10/07/2013)
16. ***, Comparative test of PHOBYA DC12-220, DC12-260 and DC12-400 Pumps. Available at: http://www.xtremehardware.com/eng-reviews/comparative-test-of-phobya-dc12-220-dc12-260-and-dc12-400-pumps-201107105434/ (accessed 10/07/2013)
17. ***, WS-2800 Wireless Professional Weather Centre. Available at: http://www.meteo.no/file/andre/engelsk-bruksanvisning-35.1099.pdf (accessed 10/07/2013)
18. ***, Arduino Mega 2560. Available at: http://arduino.cc/en/Main/arduinoBoardMega2560 (accessed 10/07/2013)
19. ***, Compact DC Voltage and Current Sense PCB with Analog Output. Available at: http://dlnmh9ip6v2uc.cloudfront.net/datasheets/Sensors/Current/DC%20Voltage%20and%20Current%20Sense%20PCB%20with%20Analog%20Output.pdf (accessed 10/07/2013)
20. ***, DS18B20 Programmable Resolution 1-Wire Digital Thermometer. Available at: http://neutrino.phys.ksu.edu/~gahs/doublechooz/DC_SlowMRS/DS/DS18B20.pdf (accessed 10/07/2013)
21. ***, Solar Radiation Sensor. Available at: http://www.davisnet.com/product_documents/weather/spec_sheets/6450_SS.pdf (accessed 10/07/2013)
22. ***, Compact Optical Dust Sensor. Available at: https://www.sparkfun.com/datasheets/Sensors/gp2y1010au_e.pdf (accessed 10/07/2013)
23. ***, Sizes of airborne particle as dust, pollen bacteria, virus and many more. Available at: http://www.engineeringtoolbox.com/particle-sizes-d_934.html (accessed 10/07/2013)
24. ***, Particulates. Available at: http://en.wikipedia.org/wiki/Particulates (accessed 10/07/2013)
25. ***, Air Quality. Available at: http://ec.europa.eu/environment/air/quality/ (accessed 10/07/2013)
26. ***, List of zones in EU Member States in relation to air quality thresholds. Available at: http://ec.europa.eu/environment/air/quality/legislation/pdf/2009_zones.xls (accessed 10/07/2013)