Ranking the types of intersections for assessing the safety of pedestrians using TOPSIS method
Călin ŞERBU1*, Dan OPRUŢA2 and Lavinia SOCACIU3
1, 2,3Department of Mechanical Engineering, Technical University of Cluj-Napoca, Romania
E-mails: 1calin.serbu@mail.utcluj.ro;2dan.opruta@mail.utcluj.ro;
3lavinia.socaciu@mail.utcluj.ro
* Corresponding author, Phone: +40264401605
Abstract
Every year, more than 1500 accidents with pedestrian occur in the intersections in Romania. The number of accidents involving pedestrians in roundabouts intersections type increased approximately three times in 2013 compared to 2009 in Romania. This alarming increase led to the need of assessing the safety of pedestrians in intersections with or without safety systems. The safety systems for pedestrians and drivers include: the road marking, the pedestrian crossings marking, signal intersections with road signs, traffic lights or pedestrian safety barriers. We propose to assess the types of intersections with TOPSIS method.
Keywords
Pedestrian safety; Intersections type; Road accident; TOPSIS method
Introduction
Accidents with pedestrians become a common problem due to continued growth of the number of vehicles in urban areas and the need to increase the mobility of pedestrians. In the cities of Romania, the road structure is not adapted to the current traffic conditions. To fluidise traffic in urban areas new roundabouts on old road location were built. Despite this solution, the pedestrian safety in intersections is still not solved.
Road safety in urban environments is a topic that has been growing in past years literature. Lately, this extensive literature has dealt with many issues ranging from data collection methods, data integration and modelling approaches. Despite all these efforts, multimodal safety approaches at the city level are missing in the literature [1].
Compared to other fields such as environment, economy, the development of a composite index for road safety performance is relatively new. This is because the traditional research focuses mainly on the road safety final outcomes in terms of fatalities per head of population, vehicle fleet or other measures of exposure [2]. They are mainly limited to the “worst case scenario” in the unsafe operational conditions of traffic systems, and are insufficient in explaining more detailed aspects of crash causation and injury prevention [3].
The progress of recent studies on the development of road and pedestrian safety index includes both objective methods (e.g. pedestrian behaviour, road security systems or factor analysis) and subjective methods (e.g. technique for order performance by similarity to ideal solution - TOPSIS, Analytical Hierarchy Process - AHP). In the specialized literature were identified only six research papers that study different aspects of traffic security using TOPSIS method summarized in the following.
In [2] the authors describe the subject of traffic safety as an extremely important one in preserving population health and preventing work accidents in the traffic domain. In this article, the critical factors of traffic safety were considered as criteria. Data was gathered through questionnaires with 39 items, based on 16 critical factors which were sent to 5 different departments. Their answers were evaluated on a scale from 1 to 5, where 1 represented the less desirable answer (less favourable) and 5 represented the best value (the most favourable). In order to evaluate the departments and the critical factors TOPSIS method was used. That clearly showed the real weighing, assesses and ranked the most important factors. They concluded that indentifying the factors that influence an accident represents a critical aspect that is always significant.
Lazim A. and Norhanadiah Z. ranked in their article [4] the type of vehicles involved in traffic accidents using the fuzzy approximation of TOPSIS. As alternatives, they chose the most important 4 types of vehicles involved in accidents in Malaysia, which are: motorcycles, cars, buses and trucks. They took into consideration 5 criteria: the age and behaviour of the driver, the technical status of the car, the road and the speed. For an accurate appreciation, they received support from 3 experts whom identified and proposed solutions based on the obtained data. The conclusions showed that accidents involving motorcycles have the largest share, followed by the accidents caused by buses. This study demonstrated the need of thoroughly investigating the 5 causes that influence traffic accidents, mainly with motorcycles. It was demonstrated that human and non-human factors are closely linked to accidents.
A similar research was published by the same authors [5], in which they suggest determining the share of each factor associated to accidents using Fuzzy TOPSIS method and their correlations. The three factors associated with accidents, that were compared and then ranked are the following: the population, the number of vehicles registered for traffic, the length of the roads. The conclusion of this study pointed out the correlation coefficients between the number of accidents and each of the three factors.
Nurnadiah Z. and Lazim A. in [6] used the TOPSIS 2- fuzzy method after Rasch model. This method was adapted to demonstrate the reliability of its application for ranking the most important causes that produce traffic accidents. The alternatives were changed with the criteria from [4] as follows: the age and behaviour of the driver, the technical status of the vehicle, the road status and the speed became alternatives and the 4 types of vehicles involved became criteria. The study illustrated that the factor “road” has the largest importance amongst the causes that produce accidents and the least important is the health condition of the driver. This paper paved the way to further research on the risk of accident using the TOPSIS method, eliminating the negligence of the experts.
In [7] using the Fuzzy TOPSIS method was studied how to improve the traffic safety. The article mainly highlights aspects linked to damage investigation and less the casualty links between the causes of accidents and the number of persons who were deceased or hurt. As a safety performance indicator (SPI) they correlate the number of accidents with their consequences. The study focused on evaluating the traffic safety performance in the 21 European countries. The criteria used in this study were: drugs and alcohol, speed, protection systems, the vehicle, the road, trauma management. The results of the study illustrate the efficiency of TOPSIS model that was proposed for evaluating traffic safety through the comparison of the results with the statistics on the deaths at 1 million inhabitants.
In [8] the authors applied three different multi-criteria decision-making methods to evaluate road safety in the 21 EU countries. The methods used in that study was: Simple Additive Weight method, Analytical Hierarchy Process (AHP) and fuzzy TOPSIS. The authors points out the need of implementing and evaluating management in traffic safety. The methods that offered the best results for this study were AHP and TOPSIS which could rank the performance for each country evaluated in traffic safety.
The aim of this research paper was to rank the types of intersections where most accidents occurred, for assessing the safety of pedestrians. To meet the purposes was used the TOPSIS method adapted for pedestrian safety.
TOPSIS method
TOPSIS method, known in the technical literature as Technique for Order Preference by Similarity to Ideal Solution (TOPSIS), represents a decisional method for prioritizing solutions that has been development since 1981 by C.L. Hwang and K. Yoon in [9].
In this paper TOPSIS method has been adapted for ranking the types of intersections where most accidents occurred, to increase the safety of vulnerable users. The proposed method allows us to determine the maximum admitted value (VMA) and the ideal value (VI) for the issue studied as well ranking the alternatives taking into account the global weights of alternatives. If the weight of alternative exceeds the perimeter VMA, then there must be proposed solutions to decrease the weights of alternative. The steps to be fallowed for the TOPSIS model are:
Step 1: Establishing the goal, identifying the criteria’s and the alternatives that will be analyzed.
Step 2: Building the hierarchical structure (Figure 1) taking into account the objective to be accomplished, the criteria and the alternatives that will be studied. We suppose that the studied issue (the objective) has m decisional criteria C1, C2, ..., Cm and n alternatives A1, A2,…, An-1, An.
Step 3: Construct the decisional matrix of the objective:
|
|
(1) |
where ci is the value associated to criterion Ci.
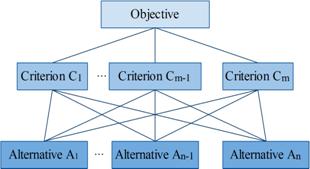
Figure 1. Hierarchical structure of the TOPSIS method
Step 4: Calculate the weights for each criterion:
|
|
(2) |

Step 5: Establish the value matrix for each criterion and each alternative so that:
|
|
(3) |

where vij is the value associated to alternative i with respect the criterion j (1≤i≤n for n alternatives, respectively 1≤j≤m for m criteria).
Step 6: Construct the normalized decision matrix [10]:
|
|
(4) |

Step 7: Calculate the weighted normalized decision matrix [11]:
|
|
(5) |
Step 8: Calculate the maximum admitted value (VMA) and the ideal value (VI):
|
|
(6) |
|
|
(7) |
where:
|
|
(8) |
|
|
(9) |
Step 9: Calculate the distance between alternative Ai and the VMA, respectively between alternative Ai and the VI:
|
|
(10) |
|
|
(11) |
Step 10: Calculate the relative closeness of each alternative to the ideal value [12]:
|
|
(12) |
for ![]() and
and ![]() resulting that
resulting that ![]() for any
for any ![]() .
.
Step 11: Establish the global weight for each alternatives [13]:
|
|
(13) |
where ![]() and
and ![]() .
.
Step 12: Ranking the alternatives using the global weights [14].
Case study
The objective of this case study is to rank the type of intersections where most accidents occurred, in Romania in 2008-2013. The criteria that have been studied are:
C1 – Accidents caused by pedestrians at road intersections not equipped with safety systems,
C2 – Accidents caused by pedestrians at road intersections equipped with safety systems,
C3 – Accidents caused by drivers at road intersections not equipped with safety systems,
C4 – Accidents caused by drivers at road intersections equipped with safety systems.
The safety systems for pedestrians and drivers include: the road marking, the pedestrian crossings marking, signal intersections with signs, traffic lights or pedestrian safety barriers.
The alternatives that have been studied are: A1 - T-Intersection, A2 - Cross Intersection (four legs), A3 - Five or more legs and not circular, A4 - Y- Intersection, A5 - Roundabout, A6 - Other type of intersection. In A6 are included: nonconventional intersection (e.g. median U-turn, displaced left turn) and other circular intersection (e.g. rotaries, neightborhood traffic circles).
In Figure 2 are illustrated the types of intersections considered as alternatives for this study and in Figure 3 is presented the hierarchical structure for the studied issue.
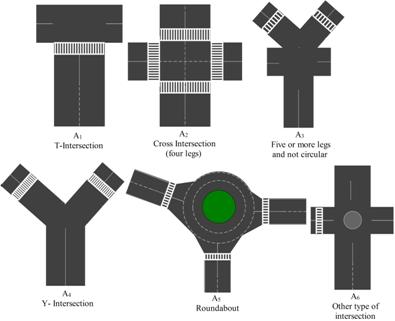
Figure 2. Different types of intersections
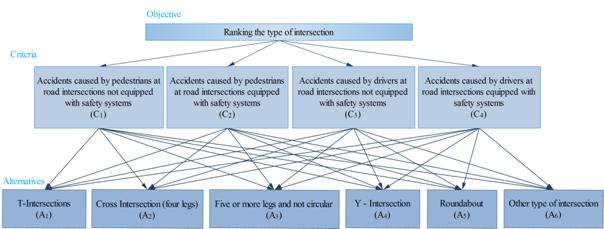
Figure 3. Hierarchical structure for the studied issue
The data used in this study have been processed from the database of Romanian Police, Traffic Department from Ministry of Internal Affairs of Romania. Table 1 presents the number of accidents with pedestrians in intersections that occurred in Romania in period 2008-2013 according to criteria and alternatives described above.
Table 1. Number of accidents with pedestrians in intersections that occurred in Romania in the period 2008-2013
|
Criteria |
C1 |
C2 |
C3 |
C4 |
Criteria |
C1 |
C2 |
C3 |
C4 |
|
Alternative |
Alternative |
||||||||
|
2008 |
2011 |
||||||||
|
A1 |
229 |
47 |
267 |
51 |
A1 |
185 |
23 |
266 |
38 |
|
A2 |
238 |
51 |
244 |
48 |
A2 |
141 |
17 |
394 |
42 |
|
A3 |
2 |
4 |
2 |
0 |
A3 |
2 |
0 |
2 |
1 |
|
A4 |
12 |
4 |
21 |
4 |
A4 |
17 |
3 |
17 |
4 |
|
A5 |
12 |
4 |
19 |
7 |
A5 |
14 |
2 |
35 |
9 |
|
A6 |
95 |
17 |
130 |
13 |
A6 |
51 |
7 |
89 |
13 |
|
2009 |
2012 |
||||||||
|
A1 |
228 |
33 |
292 |
62 |
A1 |
257 |
11 |
314 |
24 |
|
A2 |
205 |
36 |
290 |
53 |
A2 |
200 |
19 |
353 |
37 |
|
A3 |
9 |
0 |
6 |
4 |
A3 |
3 |
0 |
11 |
2 |
|
A4 |
17 |
0 |
14 |
6 |
A4 |
19 |
4 |
15 |
7 |
|
A5 |
11 |
5 |
17 |
5 |
A5 |
15 |
1 |
53 |
7 |
|
A6 |
83 |
11 |
131 |
24 |
A6 |
92 |
5 |
135 |
12 |
|
2010 |
2013 |
||||||||
|
A1 |
137 |
26 |
170 |
34 |
A1 |
259 |
5 |
344 |
26 |
|
A2 |
138 |
24 |
223 |
36 |
A2 |
198 |
15 |
381 |
35 |
|
A3 |
4 |
2 |
2 |
1 |
A3 |
4 |
0 |
12 |
1 |
|
A4 |
14 |
2 |
10 |
8 |
A4 |
14 |
2 |
28 |
6 |
|
A5 |
12 |
3 |
16 |
13 |
A5 |
11 |
0 |
90 |
8 |
|
A6 |
75 |
14 |
112 |
24 |
A6 |
93 |
5 |
120 |
9 |
C1 - Accidents caused by pedestrians at road intersections not equipped with safety systems; C2 - Accidents caused by pedestrians at road intersections equipped with safety systems; C3 - Accidents caused by drivers at road intersections not equipped with safety systems; C4 - Accidents caused by drivers at road intersections equipped with safety systems; A1 - T-Intersection; A2 - Cross Intersection (four legs); A3 - Five or more legs and not circular; A4 - Y- Intersection;A5 - Roundabout; A6 - Other type of intersection.
Results
In Table 2 are presented the results obtained after applying TOPSIS adapted method for road safety. Based on table 2 we represented graphic the weights of criteria compared with maximum VMA (Figure 4) and the global weight of alternatives (Figure 5).
Table 2. Study results
|
2008 |
2009 |
||||||||
|
C |
588 |
127 |
683 |
123 |
C |
553 |
85 |
750 |
154 |
|
pci |
0.387 |
0.083 |
0.449 |
0.081 |
pci |
0.359 |
0.055 |
0.486 |
0.100 |
|
VMA |
0.267 |
0.059 |
0.311 |
0.058 |
VMA |
0.257 |
0.039 |
0.328 |
0.072 |
|
VI |
0.002 |
0.005 |
0.002 |
0.000 |
VI |
0.010 |
0.000 |
0.007 |
0.005 |
|
DVMA |
DVI |
S |
w |
Ranking |
DVMA |
DVI |
S |
w |
Ranking |
|
0.365 |
0.411 |
0.530 |
0.371 |
A1 |
0.395 |
0.425 |
0.518 |
0.379 |
A1 |
|
0.363 |
0.398 |
0.523 |
0.366 |
A2 |
0.405 |
0.406 |
0.501 |
0.367 |
A2 |
|
0.618 |
0.006 |
0.009 |
0.006 |
A6 |
0.646 |
0.013 |
0.020 |
0.014 |
A6 |
|
0.599 |
0.029 |
0.046 |
0.032 |
A4 |
0.636 |
0.026 |
0.039 |
0.029 |
A5 |
|
0.598 |
0.027 |
0.044 |
0.031 |
A5 |
0.635 |
0.024 |
0.037 |
0.027 |
A4 |
|
0.490 |
0.187 |
0.276 |
0.193 |
A3 |
0.527 |
0.177 |
0.251 |
0.184 |
A3 |
|
2010 |
2011 |
||||||||
|
C |
380 |
71 |
533 |
116 |
C |
410 |
52 |
803 |
107 |
|
pci |
0.345 |
0.065 |
0.485 |
0.105 |
pci |
0.299 |
0.038 |
0.585 |
0.078 |
|
VMA |
0.228 |
0.044 |
0.357 |
0.066 |
VMA |
0.231 |
0.029 |
0.475 |
0.056 |
|
VI |
0.007 |
0.003 |
0.003 |
0.002 |
VI |
0.002 |
0.000 |
0.002 |
0.001 |
|
DVMA |
DVI |
S |
w |
Ranking |
DVMA |
DVI |
S |
w |
Ranking |
|
0.457 |
0.359 |
0.440 |
0.334 |
A2 |
0.680 |
0.400 |
0.370 |
0.366 |
A2 |
|
0.449 |
0.428 |
0.488 |
0.371 |
A1 |
0.686 |
0.510 |
0.426 |
0.422 |
A1 |
|
0.707 |
0.005 |
0.007 |
0.006 |
A6 |
0.947 |
0.004 |
0.004 |
0.004 |
A6 |
|
0.686 |
0.029 |
0.040 |
0.030 |
A5 |
0.925 |
0.030 |
0.032 |
0.031 |
A4 |
|
0.677 |
0.037 |
0.052 |
0.040 |
A4 |
0.914 |
0.047 |
0.049 |
0.049 |
A5 |
|
0.543 |
0.221 |
0.289 |
0.219 |
A3 |
0.856 |
0.126 |
0.129 |
0.127 |
A3 |
|
2012 |
2013 |
||||||||
|
C |
586 |
40 |
881 |
89 |
C |
579 |
27 |
975 |
85 |
|
pci |
0.367 |
0.025 |
0.552 |
0.056 |
pci |
0.348 |
0.016 |
0.585 |
0.051 |
|
VMA |
0.278 |
0.021 |
0.394 |
0.044 |
VMA |
0.265 |
0.015 |
0.416 |
0.039 |
|
VI |
0.003 |
0.000 |
0.012 |
0.002 |
VI |
0.004 |
0.000 |
0.013 |
0.001 |
|
DVMA |
DVI |
S |
w |
Ranking |
DVMA |
DVI |
S |
w |
Ranking |
|
0.543 |
0.448 |
0.452 |
0.362 |
A2 |
0.586 |
0.461 |
0.440 |
0.356 |
A2 |
|
0.542 |
0.452 |
0.455 |
0.364 |
A1 |
0.591 |
0.465 |
0.440 |
0.356 |
A1 |
|
0.779 |
0.013 |
0.016 |
0.013 |
A6 |
0.823 |
0.014 |
0.016 |
0.013 |
A6 |
|
0.763 |
0.028 |
0.036 |
0.028 |
A4 |
0.806 |
0.034 |
0.041 |
0.033 |
A5 |
|
0.747 |
0.062 |
0.077 |
0.061 |
A5 |
0.777 |
0.099 |
0.113 |
0.092 |
A4 |
|
0.664 |
0.181 |
0.214 |
0.171 |
A3 |
0.720 |
0.162 |
0.184 |
0.149 |
A3 |
|
C - The decisional matrix of the objective; pci - The weights for each criterion; VMA - The maximum admitted value; VI - The ideal value; DVMA - The distance between alternative Ai and the VMA; DVI - The distance between alternative Ai and the VI; S – The relative closeness of each alternative to the ideal value; w – The global weight for each alternatives. |
Figure 4. Weight of criteria compared with maximum VMA
Figure 5. Global weights of alternatives
Discussion
From Figure 4 we can observe that the highest weight corresponds to criterion C3 (accidents caused by drivers at road intersections not equipped with safety systems), followed by weight of C1 (accidents caused by pedestrians at road intersections not equipped with safety systems). The weight of C3 is greater than the maximum VMA in all years analyzed, and the alarming part is that this trend is growing. Based on these results is required the implementation of educational programs and accountability for traffic participants.
From Figure 5 we can observe that the highest weight corresponds to alternative A1 (T- Intersection) and to alternatives A2 (Cross Intersection (four legs)) for the entire period studied. In 2008-2010 the weights for A1 and A2 was higher than the maximum VMA. Since 2011, the weights of all alternatives are less than maximum VMA. We observe the weight of A5 (Roundabout) had a worrying increase from 2.68% in 2009 at 9.18% in 2013.
These results lead to the need of implementing pedestrian safety systems especially in roundabout and accountability pedestrians and drivers.
Conclusion
This research presented TOPSIS methodology adapted for ranking the types of intersections in order to increase the safety of vulnerable road users. The TOPSIS method allows identification of the main criteria that can influence road safety strategies and ranking the alternatives in order to propose solutions that have as a result the reduction of the number of accidents.
References
1. Strauss J., Miranda-Moreno L.F., Morency P., Multimodal injury risk analysis of road users at signalized and non-signalized intersections, Accident analysis and prevention, 2014, 71, p. 201_209.
2. Bao Q., Ruan D., Shen Y., Hermans E., Janssens D., Improved hierarchical fuzzy TOPSIS for road safety performance evaluation, Knowledge-based systems, 2012, 32, p. 84_90.
3. Hermans E., Wets G., Van der Bossche F., Describing the evolution in the number of highway deaths by decomposition in exposure, accident risk, and the fatality risk, Transportation research record, 2006, 1950, p. 1_8.
4. Lazim A., Norhanadiah Z., Fuzzy approach for ranking of motor vehicles involved in road accidents, Word academy of science, Engineering and technology, International journal of mathematical, Computational science and engineering, 2009, 3(6), p. 10_14.
5. Lazim A., Norhanadiah Z., Ranking of the factors associated with road accidents using correlation analysis and fuzzy TOPSIS, Australian journal of basic and applied sciences, 2010, 4(2), p. 314_320.
6. Nurnadiah Z., Lazim A., Weight of interval type-2 fuzzy Rach model in decision making approach: ranking causes lead of road accident occurrence, International journal of soft computing, 2012, 7(1), p. 1_11.
7. Hadi S., Mazdak K., Reza D., Prioritizing Critical Success Factors Influencing Safety, Using TOPSIS, International journal of business and social science, 2011, 2(20) p. 295_300.
8. Khorasani G., Mirmohammadi F., Motamed H., Fereidoon M., Tatari A., Reza M., Verki M., Khorasani M., Fazelpour S., Application of Multi Criteria Decision Making Tools in Road Safety Performance Indicators and Determine Appropriate Method with Average Concept, International journal of innovative technology and exploring engineering (IJITEE) 2013, 3(5), p. 173_177.
9. Hwang C.L., Yoon K., Multiple Attribute Decision Making, Springer-Verlag, Berlin, 1981.
10. Chamodrakas I., Leftheriotis I., Martakos D., In-depth analysis and simulation study of an innovative fuzzy approach for ranking alternatives in multiple attribute decision making problems based on TOPSIS, Applied soft computing, 2011, 11, p. 900_907.
11. Dagdeviren M., Yavuz S., Kilinc N., weapon selection using the AHP and TOPSIS methods under fuzzy environment, Expert systems with applications, 2009, 36, p. 8143_8151.
12. Yue Z., An extended TOPSIS for determining weights of decision makers with interval numbers, Knowledge-based systems, 2011, 24, p. 146_153.
13. Gumus A.T., Evaluation of hazardous waste transportation firms by using a two-step fuzzy-AHP and TOPSIS methodology, Expert systems with applications, 2009, 36, p. 4067_4074.
14. Roshandel J., Miri-Nargesi S.S., Hatami-Shirkouki L., Evaluating and selecting the supplier in detergent production industry using hierarchical fuzzy TOPSIS, Applied mathematical modelling, 2013, 37, p. 10170_10181.