Optimal and economic selection of turn ratio for unit transformer using generator capability curves of synchronous generators
Seyed M.H. NABAVI *, Somayeh HAJFOROOSH2, Sara SETAYESH3
1Department of
Electrical Engineering,
2 Department of
Electrical Engineering,
3 SAKOO
Consulting Engineers,
* E-mails: h_nabavi@iaut.ac.ir
* Corresponding author, phone: +61426446100
Abstract
One of the most important subjects in power systems is an optimal and
economic design of power transformers. In this paper, determination of turn
ratios for power transformers that are directly connected to generators is
evaluated considering reactive power generation and its impact on the optimal
turn ratio selection. A generator capability curve has been used to explain all
details. Three different methods have been examined and the simulation results
have been compared in a real test system, on Rudbar-Lorestan,
Keywords
Turn ratio; Generator capability curves; Optimal and economic designing
Introduction
Recently, all industrial countries prefer to have an uninterrupted operation and generation, and continuous transferring and distribution of power systems and increase the social welfare [1-6] and have reliable power [7]. Transformers are the most important devices to transfer and distribute in power systems. On the other hand, transformers are very expensive and their halt may stop all other related equipment, which incurs plentiful damages. Therefore, several optimization techniques have been studied in the literature.
Determination of optimal turn ratios of transformers that are directly connected to generators is one of the important issues to design a power transformer [8]. The study of designing power transformers using different methods was established on [9-12]. In 2006, S. Padma, R. Bhuvaneswari and S. Subramanian present a power transformer design methodology using Simulated Annealing Technique [9]. In 2012, A. Khatri, H. Malik and O.P. Rahi, used genetic algorithm to find the optimal design of power transformer [10]. Then, a novel method of ampere-turn distribution is presented in [11] to optimize the distributions of ampere-turns.
As mentioned in the above references the authors did not consider the
impact of the reactive power on the determination of the optimal turn ratios
selection in transformers that are directly connected to generators. This paper
presents a precise and optimal calculation strategy to calculate turn ratios
for power transformers based on IEEE Standards. The results of the presented
algorithm are compared with the actual results that already achieved in
In this paper, first the limits of reactive power generation in synchronous machines have been presented. Next, the studies of different methods to calculate power transformers turn ratios are discussed. Then, the results of the presented algorithm have been studied.
Material and method
Limits of reactive power generation in synchronous machines
In the study of voltage stability and long-term stability, limits of reactive power generation by synchronous machines are important [15]. Generator capability curves that usually submitted by manufacturers indicate the active and reactive powers of a generator towards a system. When a generator is in over exciting condition, it generates reactive power; and when it is in under exciting condition, it absorbs reactive power. This section studies generator capability curves of synchronous machine to calculate the minimum and maximum reactive power generation limits, which are the important parameters to select the optimal turn ratio for a power transformer.
A. Reactive power generation curves
Generally, nominal capacity of a synchronous machine can be indicated by MVA in a specific voltage and power factor (usually 85-90% of lead) in which the synchronous machine is able to work continuously without abnormal temperature increment. In addition, real output power of the synchronous machine depends on turbine ability and nominal MVA machine limits. Therefore, limitations of a generator should be known for the optimal utilization. Then, the continuous generation of the reactive power will be limited by three criteria including armature current limit, excitation current limit, and temperature limit at the end of the armature. In the following sections, performance limitations of synchronous generators will be presented [15].
B. Armature current limit
Armature current limit incurs RI 2 losses and the related energy must be dissipated to preserve conductors and environment temperature in limits (Figure 1- Curve #2).
In the selected generator, rated output power is 255000 kVA, rated voltage is 15750 V. In this figure, curves 1-6 are Maximum Field Current, Armature Current, Practical Stability, Theoretical Stability, Minimum Field Current and Reluctance Power, respectively.
For a synchronous machine, the power is:
|
S = P + jQ = 3|Et||It|(cos(φ) + jsin(φ)) |
(1) |
where, φ is power factor angle, Therefore in P-Q space the current limit of this armature will be as a circle with MVA radius and origin of coordinates. In details, one of the generator nominal capacity limitations is the maximum current that an armature can withstand without exiting from its temperature limits. This limitation is shown in (Figure 1- Curve #2).
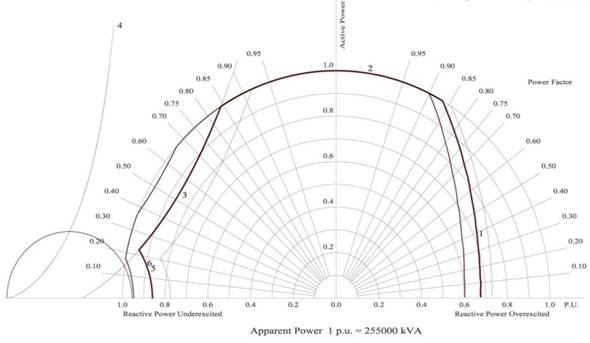
Figure 1. Armature temperature limits
C. Excitation current limit
The second limitation in operation of the synchronous machine can be due to the temperature losses of current (RfdIfd2). The geometrical place of fixed exciting current is obtained by using the steady state equivalent circuit in Figure 2. In addition, the equivalent circuit of Figure 2 expresses relation between IA, EA and Vt if Xd = Xq= Xs, where X is the leakage reactance; Xa is the armature reaction reactance, Xs = Xa + X is the synchronous reactance; Ra = armature resistance; Vt is the terminal voltages; IA = armature Current, and EA is the magnetizing voltage.
|
|
|
|
|
|

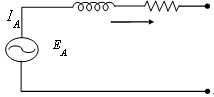
Figure 2. The equivalent circuit of steady state synchronous machine
According to equation (1), it can be seen that, for a given exciting current, relation between real and reactive powers is a circle with Q = -3Et/XS and P=0 as a centre and -3EtIf/XS as a radius. Therefore, the effect of maximum nominal current on power generation capability of this machine in P-Q space can be shown according to Figure 3. Regularly, the intersection of temperature limits curve of armature and excitation indicates MVA capacity and nominal power factor for generator. This point is indicated with “A” in Figure 3.
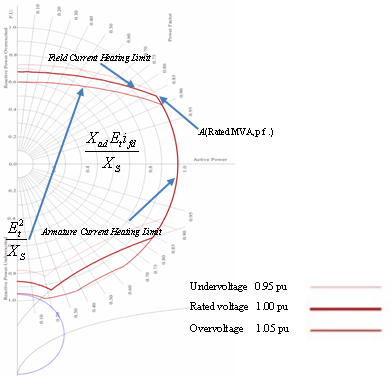
Figure 3. Excitation limits of T synchronous generator
D. Temperature limit at the end of armature
The third limitation of operation is the generated temperature at the end of the machine armature. This limitation usually affects power generation curve of the synchronous machine in under exciting condition of generator. More details about intersections of end area of a synchronous generator are presented in [15]. The flux of this area enters and exits perpendicular to stator sheets. This causes to generate eddy currents, which produces heat at the end of machine. In addition, strong exciting currents corresponding to over exciting condition keep the spacer ring in saturation state to limit the end leak flux in small amount.
However, in an under-excitation state, field current is low and the spacer ring will not be saturated. This increases leak flux of end area in armature. Also, in the under exciting condition state, the flux of armature currents is aggregated with flux of exciting currents [15]. Therefore, the end flux is bounded, which applies limitation on generation capability of synchronous machines with cylindrical rotors. This is shown in Figure 4, which includes the limit by temperature of armature current.
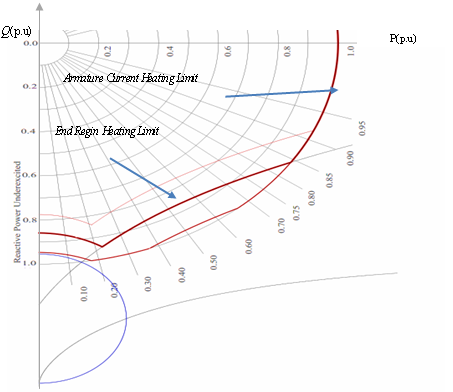
Figure 4. Temperature limits at the end of armature in a synchronous generator
It should be mentioned that the temperature limits of exciting current and armature current in P-Q space are depended on the armature voltage. Moreover, in terms of design point of view, the mentioned limitations are applied based on the machine operation capabilities. Thus, extra limitations may be applicable on the machine operation because of the power system stability [15].
E. Synchronous generator capability curves drawing steps:
1. Select an origin on a paper and determine P and Q scales on it.
2. Draw a circle around the origin with radiuses |S| = 3|Et||It| equal to nominal power of machine (KVA). This curve indicates temperature limit of the stator.
3. Draw a circle with a center of Q = -3Et/XS on Q axis and with radius of -3EtIf/XS. The curve indicates temperature limit of exciting current and intersection of this curve with temperature curve of armature shows MVA capacity and the nominal power of generator.
4. Draw a line from 60% point of maximum absorbable reactive power by the generator to 120% point of the maximum generation reactive power that multiply to 1 as a power factor value.
5. Draw a parallel line to Q from P = 3|Et||It|cos(φ). This line indicates the maximum generation active power of generator in overexciting condition [8].
Moreover, Figure 5 shows a typical capability curve for a synchronous generator in S space, in which P is the horizontal axis and Q is the vertical axis. If S is inside the curve, the machine neither is hot nor is out of its synchronous state.
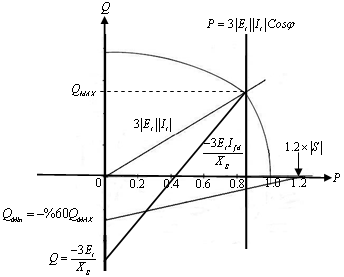
Figure 5. The performance capability curve for a synchronous generator in S plain
Study of different methods to calculate power transformers turn ratios
This section analyses and investigates different methods to calculate the power transformer turns ratios.
A. Method 1
In this method, turn ratios and the secondary voltage are obtained by using equation (2) as follows [12]:
|
Ua = |
(2) |
where,
|
Uφ = Uφ' + 1.2(Uφ2/100) |
(3) |
|
Uφ' = URrcos(φ) + UXrsin(φ) |
(4) |
|
Uφ'' = URrsin(φ) - UXrcos(φ) |
(5) |
where, cos(φ) is Nominal
power factor; Pkr is Total losses; Sr is
Nominal power; Ukr is Short-circuit voltage (%),
and
It should be noted that, in this method the limits to generate reactive power for the generator connected directly to the transformer are not considered which cause inaccurate results.
B. Method 2
Figure 6 shows different parameters, which are used, in input information. In this method, the turn ratio and the secondary voltage can be obtained by solving equations (6) and (7) simultaneously, as follow [13]:
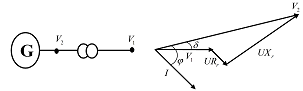
Figure 6: Parameters for input information
|
V2cos(δ) = 1 + RPU[cos(δ - φ)] + X[cos(δ + 90 - φ)] |
(6) |
|
V2sin(δ) = RPU[sin(δ - φ)]+X[sin(δ + 90 - φ)] |
(7) |
where,
SB: Nominal power (MVA)
VB: Per Unit voltage (kV)
IB: Per Unit nominal current (A)
ZB: Per Unit impedance, this is obtained from ZB=VB2/SB
PSCL: Short-circuit loss in full load (kW)
RP.U: Resistance per unit, which is obtained by RP.U=PSCL2/3IB2
cos(φ): Nominal power factor
It should be noted that this method is not also precise due to not-considering limitations of reactive power generation to calculate the turn ratio.
C. Method 3
To calculate an accurate and practical turn ratio, considering reactive power generation/absorbing limits by the system generators are important. Different steps to calculate an optimal turn ratio for a power transformer using presented algorithm are:
Step 1: Drawing VS - Q curve based on using equation
(8) [8]:
|
|
(8) |

where VS is the system voltage (kV); Vg is Generator voltage (per unit); VgBase is Nominal voltage (kV); VTHV is Maximum acceptable voltage of system; VTLV is Minimum acceptable voltage of system; Rr is Transformer resistance in nominal voltage and power; Xr is Transformer reactance in nominal voltage and power; cos(φ) is Generator’s power factor; QMIN is Maximum reactive power absorbed by generator; QMAX is Maximum reactive power produced by generator, and MVAT is Nominal output power of generator.
Step 2: Drawing the capability curve.
Step 3: Calculation of QMIN and QMAX by using the performance capability curve of generator Figure 6.
Step 4: Draw two parallel vertical lines starting from QMIN and QMAX.
Step 5: Find the intersections of the vertical lines (obtained from Step 4) with the VS - Q curve.
It should be noted that the obtained points from the intersection of parallel lines and VS - Q curve, represents the minimum and maximum system voltage when the reactive power is absorbed or generated. These points are shown in Figure 7.
Results
Analyzing the curves for the Rudbar-Lorestan hydro power station
The input parameters for Rudbar-Lorestan power station plant are shown in Table 1.
Table 1. Parameters for Rudbar-Lorestan power station plant
|
MVAT |
cos(φ) |
Xr % |
Rr |
VTLV |
VTHV |
VgBase |
Vg |
VS |
|
255 |
0.9 |
14 |
0 |
380kV |
420kV |
15.75kV |
1 pu |
400kV |
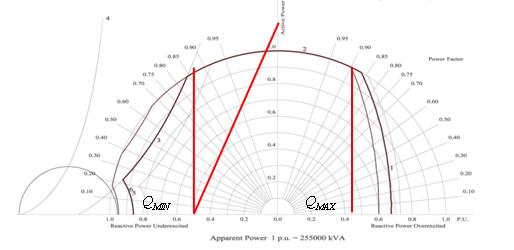
Figure 7. QMIN and QMAX for the Rudbar-Lorestan generator
Regarding to the input values and performance capability curve, QMIN and QMAX are equal to -122.4 and +121.1, respectively. These points are shown in Figure 8.
In following, equation 8 based on step 1 and in order to calculate the Rudbar-Lorestan Power Station plant is simulated by MATLAB software. The simulation results are shown in Figure 8.
Study of different assumable states for turn ratios to calculate the optimal value
With considering the obtained values of QMIN and QMAX, the VS - Q diagram will be as Figure 8. In addition, four steps for turn ratios of power transformers are considered in this diagram. In this Figure, lines A-E, B-F, C-G, D-H show the turn ratios of 410/15.75, 400/15.75, 390/15.75, and 380/15.75 respectively.
According to these lines, it seems that in turn ratios of 420/15.75, 380/15.75 the minimum voltage level which is happened in reactive power absorption state is lower than the standard level (380kV).
Also, in the turn ratios of 420/15.75 the minimum and maximum value of voltage levels have a large difference from standard values (380kV to 420kV) and the selection of this turn ratios causes increase in protective equipment expenses. Therefore, this ratio is not optimal economically. However, there will not be the economic and technical limitations by selecting 410/15.75 as a turn ratio.
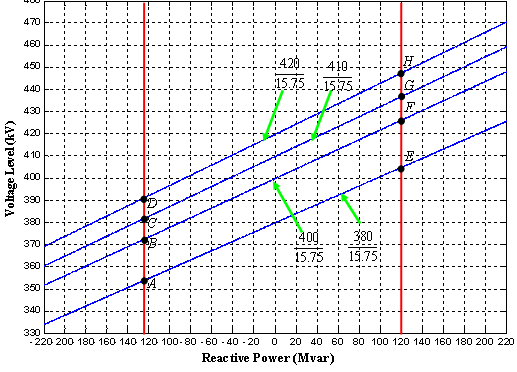
Figure 8. VS - Q curve for Rudbar-Lorestan power station plant
The reason is that voltage level in point C is higher than minimum voltage level (380kV), and it is higher than maximum voltage level in point G.
It should be noticed that in point C, the minimum voltage level is chosen more than 380kV; the reason is considering 10% error for the transformer impedance, which this error level is chosen based on IEC60076 standard.
IN addition, in order to show the correctness and accuracy of the
proposed algorithm, simulations have been done to calculate the turn ratios of
Table 2. Results of first and second method and their comparison with the results of the proposed algorithm
|
Plants name |
Method 1 |
Method 2 |
Proposed algorithm |
Implemented values |
|
|
423 |
421 |
411 |
410 |
|
Karoon 3 |
427 |
425 |
409 |
410 |
|
Masjed Soleyman |
427 |
423 |
409 |
410 |
|
Gotvand |
422 |
419 |
410 |
410 |
|
Rudbar-Lorestan |
427 |
417 |
410 |
410 |
Moreover, the results of the first and the second methods are presented to compare with. Studying of these three methods results show that not considering reactive power generation limitations for a generator connected to a transformer causes error in calculation of turn ratios.
Conclusions
Regarding to the importance of transformers in transmission systems, designing and selection of transformers’ parameters play an important role for optimal power transferring. Therefore, the optimal transformer turn ratios selection is essential and necessary. In this paper, different methods for optimal and economic designing of power transformers turn ratios are studied and the results are compared.
The investigation shows that not considering the reactive power generation limits in generator connected to the transformer cause arousing error in turn ratios calculation. In this paper, the impact of considering reactive power limits has been studied and tested for different real hydro power plants. Comparison between the obtained results based on the suggested algorithm and the real values shows the accuracy and precision of this method.
References
1. Nabavi S. M. H., Hajforoosh S., Hajforosh S., Karimi A., Using genetic algorithm for social welfare maximization in deregulated power markets by optimal locating and sizing of TCSC, Int Rev Model Simul, p.1447–53, 2010.
2. Masoum M. A. S., Nabavi S. M. H., Kazemi A., Social welfare maximization in double-sided auction market by placement and sizing of TCSC using fuzzy-based genetic algorithm, International Review of Electrical Engineering, 5(5), p. 2392- 2404, 2010.
3. Nabavi S. M. H., Kazemi A., Masoum M. A. S., Social Welfare Improvement by TCSC using Real Code Based Genetic Algorithm in Double-Sided Auction Market, Advances in Electrical and Computer Engineering, 2011, 11, no. 2, p. 99-106,.
4. Nabavi S. M. H., Hajforoosh S., Masoum M. A. S., Placement and sizing of distributed generation units for congestion management and improvement of voltage profile using particle swarm optimization, Innovative Smart Grid Technologies Asia (ISGT), p.1-6, 2011.
5. Hajforoosh S., Nabavi S. M. H., Masoum M.A.S., Coordinated aggregated-based particle swarm optimisation algorithm for congestion management in restructured power market by placement and sizing of unified power flow controller, Science, Measurement & Technology, IET, p.267-278, 2012.
6. Hajforoosh S., Nabavi S. M. H., Masoum M. A. S., Optimal Particle Swarm Based Placement and Sizing of Static Synchronous Series Compensator to Maximize Social Welfare, Journal of Electrical Engineering & Technology, p. 501-512, 2012.
7. Nabavi S. M. H., Gholami A., Kazemi A., Masoum M. A. S., Evaluation of leakage current measurement for site pollution severity assessment, Leonardo Electron. J. Pract. Technol, p. 39–54, 2007.
8. IEEE Guide for Transformers Directly Connected to Generators, Revision of IEEE Std C57.116-1989, p.1-48, 2014.
9. Padma S., Bhuvaneswari R., Subramanian S., Optimal Design of Power Transformer Using Simulated Annealing Technique, IEEE International Conference on Industrial Technology, p.1015-1019, 2006.
10. Khatri A., Malik H., Rahi O. P., Optimal Design of Power Transformer Using Genetic Algorithm, International Conference on Communication Systems and Network Technologies, 2012, p.830-833.
11. Feng B., Wang G.L., Liu H. D., Zhang H. J., Optimum Design of Ampere-turn Balance for Power Transformer, IEEE International Conference on Applied Superconductivity and Electromagnetic Devices (ASEMD), p.387-390, 2013.
12. Chapman, S., Electric machinery fundamentals. Tata McGraw-Hill Education, 2005.
13. Hawary M. E. El., Principles of electric machines with power electronic applications, IEEE Press, 2002.
14. Iran Water and Power Resources, Development Company, Technical specification for Rudbar-e-Lorestan Dam and Power Plant, 2011, URL: http://en.iwpco.ir/Rudbar/default.aspx.
15. Sauer P.W., “Power System Dynamics and Stability”, Handbook of Electrical Power System Dynamics: Modeling, Stability, and Control, 2013.
16. Iran Water and Power Resources, Development Company, Technical specification for Karoon 3 Dam and Power Plant, 2011, URL: http://en.iwpco.ir/IWPCO.aspx.
17. Iran Water and Power Resources, Development Company, Technical specification for Karkheh Dam and Power Plant, 2004, URL: http://jahadtossee.ir/company-manabeab-summary-completed-en.html.
18. Iran Water and Power Resources, Development Company, Technical specification for Gotvand Dam and Power Plant, 2006, URL: http://en.iwpco.ir/Gotvand/default.aspx.
19. Iran Water and Power Resources, Development Company, Technical specification for Masjed Soleyman Dam and Power Plant, 2001, URL: http://www.moshanir.co.ir/en/masjed.aspx.