Timeline of bio-hydrogen production by anaerobic digestion of biomass
Bernadette E. TELEKY1*, Mugur C. BĂLAN1, and Marcell NIKOLAUSZ2
1Department of Mechanics, Technical
2Helmholtz Centre for Environmental Research – UFZ Leipzig, Germany
E-mails: tbernadette@mail.utcluj.ro; mugur.balan@termo.utcluj.ro; marcell.nikolausz@ufz.de
Corresponding author: 1*tbernadette@mail.utcluj.ro
Abstract
Anaerobic digestion of biomass is a process capable to produce bio-hydrogen, a clean source of alternative energy. Lignocellulosic biomass from agricultural waste is considered a renewable energy source; therefore its utilization also contributes to the reduction of water, soil and air pollution. The study consists in five consecutive experiments designed to utilize anaerobic bacterial enrichment cultures originating from the Hungarian Lake, Hévíz. Wheat straw was used as complex substrate to produce hydrogen. The timeline evolution of hydrogen production was analyzed and modelled by two functions: Logistic and Boltzmann. The results proved that hydrogen production is significant, with a maximum of 0.24 mlN/ml and the highest hydrogen production occurs between the days 4-10 of the experiment.
Keywords
Anaerobic digestion; Hydrogen production; Wheat straw; Numerical modelling; Logistic; Boltzmann
Introduction
Technological development of the human society, the continuously growing energy consumption and demand for fossil fuels lead to the need of alternative energy resources that meet current and future energy requirements. These requirements are also in agreement with the growing energy needs of a population in expansion.
The production of biological hydrogen is a new and alternative source of energy which is clean and reaches potential [1], also direct conversion in thermal energy of hydrogen presents a very promising valorization [2]. Hydrogen cannot be found on Earth in gaseous form in considerable quantity, therefore it has to be separated from other elements. There are various hydrogen production methodologies, but the most common ones are thermal [3], electrolytic [4,5] and photolytic [6] hydrogen production techniques. An alternative way of hydrogen production is based on carbohydrate fermentation of substrates, with the help of bacterial consortia. This type of anaerobic fermentation of biomass can produce hydrogen in large amounts and at low costs [1,7].
The design of process using lignocellulosic biomass as substrate must consider its very compact crystalline structure [8]. Lignocellulose is composed of cellulose macrofibrils, surrounded by hemicellulose and protected by an outer layer of lignin [9] as presented in Figure 1.

Figure 1. Lignocellulose structure
Wheat (Triticum aestivum) straw is one of the major agricultural wastes which can be used for the production of bio-hydrogen [10], but it also has a high lignin content, which makes the degradation under anaerobic conditions difficult, and therefore various pretreatment methods are frequently used for this substrate [11].
In order to maintain the process of anaerobic fermentation, specific conditions and requirements must be ensured [12]. For example, the pH is considered to be optimal between 5 and 7 [13,14], but in some cases also higher [15,16] or lower pH is reported by other studies [17,18].
Predictive modelling has to be performed to describe the behaviour of microorganisms under various physical or chemical conditions, such as different temperature, pH and culture media types. These models help to detect critical aspects of process mechanisms, experimental designs and conditions [19,20].
The aim of this study was to model, from quantitative point of view, the hydrogen production through anaerobic digestion of straw with thermophilic anaerobic microorganisms. A series of five experiments were conducted and in each one the production of hydrogen was analyzed. The cumulative hydrogen production and the daily hydrogen production were also mathematically modelled.
Material and method
Samples of sediments, as source of microorganisms, were taken from Lake Hévíz [21] situated in Hungary, Europe.
The samples were collected on 18th of April 2011, when the water temperature was 29°C and the pH was between 7.1-7.2. Two locations were chosen for taking samples from the lake. From the first location (Typha), situated on the littoral zone vegetated with cattail (Typhaceae), sediments were collected from 0.5 m depths. From the second location (Sediment), situated on the middle of the lake, sediments were collected from 2 m depth.
The culture medium DSMZ 640 [22] was used in a modified formula presented in [23]. The degradation of cellulose was accompanied by measurements of biogas production, realized three times per week, usually at intervals of 2-3 days [24,25].
The composition of biogas was determined using a gas chromatograph of HP-2002P type, with the schematic diagram shown in Figure 2. The chromatograph was equipped with a thermal conductivity detector.
Figure 2. Gas chromatograph scheme
Chromatography is a separation method in which sample components are distributed between two phases: one stationary and one movable [26]. To determine the gas composition in the culture bottles a Gas Chromatograph HP-2002P was used, which was equipped with a thermal conductivity detector and argon was used as carrier gas.
The scheme of gas chromatography analysis procedure is shown in Figure 2.
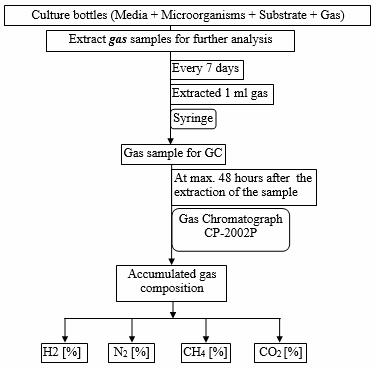
Figure 3. The scheme of gas chromatography measuring procedure
Gas samples were collected in 20 ml vials which were enclosed with grey rubber stoppers and aluminium rings. The vials were flushed for 30 minutes with argon which is carrier gas in the gas chromatography. All the manipulations were realized under anoxic conditions using the Hungate technique [27]. From the headspace of the culture bottles 1 ml of gas sample was taken and transferred into the vials prepared with argon, which reached a sample dilution of 1:20.
In each experiment 4 cultures of microorganisms were used namely, Typha A (Ta) and Typha B (Tb) were duplicates from the location Thypha and Sediment A (Sa) and Sediment B (Sb) were duplicates from the location Sediment of the lake Hévíz.
The experimental data mathematical model for the cumulated biogas production was reported in a previous study based on the same experiments [28].
The models for the share of hydrogen in biogas, was identified with the FindGraph software [29] and the best fit were found to be for the Logistic and Boltzmann models.
Logistic model is a nonlinear regression model that describes the kinetics of microorganism’s growth [30]:
![]()
where a - is the maximum point to which the mathematical model converges asymptotically, b – if it is a positive value then the function is continuously increasing, the higher the parameter value the greater the slope is, c – inflection point corresponding to the moment of reaching the value a/2, respectively when the slope of the function, the velocity of the process implementation begins to decrease.
Boltzmann model describes the distribution of gas molecules between which the only type of interaction is represented by the mechanical clashes (was proposed in 1868, to describe the distribution of gas molecules between which the only type of interaction is represented by the mechanical clashes [31]):
![]()
where y - the percentage of hydrogen in the biogas, a - the asymptote to infinity for negative time (the initial quantity of gas present in the culture bottle), b - the asymptote to infinity for positive time (the total gas produced), c - the mode of the distribution for which the Boltzmann model is the cumulative density function (the day with maximum gas production) and d - controls the width of the distribution (the production speed).
Results and discussions
For each of the 5 experiments, 4 or 5 gas analyses were performed resulting a total of 83 determinations, enough to allow the establishment of two global models that describe the share of hydrogen in the biogas.
In Table 1 the final hydrogen percentage in the biogas produced in the experiments is presented, and in Table 2 the final cumulative biogas production is shown.
Table 1. Hydrogen content [%]
|
Exp. |
Day |
Ta |
Tb |
Sa |
Sb |
|
1 |
25 |
23.98 |
22.27 |
24.83 |
25.64 |
|
2 |
28 |
25.13 |
16.75 |
21.32 |
20.78 |
|
3 |
22 |
25.98 |
20.17 |
24.54 |
23.57 |
|
4 |
22 |
25.75 |
19.65 |
26.36 |
20.65 |
|
5 |
30 |
17.44 |
11.31 |
21.12 |
18.45 |
Table 2. Final cumulative biogas production [mlN/ml]
|
Exp. |
Day |
Ta |
Tb |
Sa |
Sb |
|
1 |
25 |
1.12 |
1.26 |
1.12 |
1.19 |
|
2 |
28 |
1.10 |
0.69 |
1.23 |
1.23 |
|
3 |
22 |
1.20 |
0.73 |
1.04 |
1.28 |
|
4 |
22 |
1.10 |
0.68 |
0.93 |
1.14 |
|
5 |
30 |
1.25 |
0.63 |
0.98 |
1.20 |
The overall trend of the conducting of hydrogen production during the experiments is presented in Table 1 and 2.
The greatest cumulative biogas production was of 1.28 mlN/ml, recorded for the culture Typha A (Ta) in the experiment 3 and the largest hydrogen share was of 26.36%, observed for the culture Sediment A (Sa) in the experiment 4.
Figure 4 shows the dynamics of hydrogen share in the biogas, based on which the mathematical models were determined.
Figure 4. Final hydrogen share in the total biogas produced
The variation curve for the hydrogen share in the biogas, according to Logistic and Boltzmann model is presented in Figure 5:
Figure 5. The variation curve for the hydrogen share in the biogas
The parameters of the Logistic model for the share of hydrogen in the biogas produced by anaerobic digestion of biomass are presented in Table 3.
Table 3. Parameters of the models for the share of hydrogen in the biogas
|
Parameter |
Logistic |
Boltzmann |
|
a |
22.484854±5.06% |
7.963248±25.07% |
|
b |
0.361892±37.05% |
22.407504±4.69% |
|
c |
2.671734±38.28% |
6.512689±30.54% |
|
d |
- |
0.965707±16.3% |
In figures 6 and 7 are presented the graphs for the Logistic and Boltzmann models for the share of hydrogen in the biogas, together with the standard deviations.
Figure 6. Logistic model for the share of hydrogen in the biogas
Figure 7. Boltzmann model for the share of hydrogen in the biogas
It can be observed that the share of hydrogen in biogas grows slowly in the first 5 days, from approx. 8% to approx. 10%, after which there is a fast increase in the proportion of hydrogen in the biogas between days 5 to 10 to approx. 22- 23 %, after which the share of hydrogen remains relatively constant around 22 to 23 %.
By multiplying the values representing the accumulated biogas production, determined previously [31] with the values representing the percentage of hydrogen in the biogas, the curves of the cumulative hydrogen production corresponding to both Logistic and Boltzmann models were obtained as represented in Figure 8.
Figure 8. Cumulative hydrogen production corresponding to Logistic and Boltzmann models
The cumulated hydrogen production grows slowly in the first 5 days from approx. 0.01 mlN/ml to approx. 0.05 mlN/ml, after which in the days (5 … 10) a linear increase of the hydrogen production can be observed till 0.017 mlN/ml, followed by a slower growth of 0.24 mlN/ml.
Through the difference between the hydrogen productions from consecutive days, the curve of daily variation for hydrogen production corresponding to Logistic and Boltzmann models are determined and presented in Figure 9.
Figure 9. Daily variation of hydrogen production
The daily hydrogen production grows slowly in the first (3 or 4) days from 0.003 mlN/ml/day according to the Logistic model to 0.02 mlN/ml/day, respectively from 0.007 mlN/ml/day for to 0.09mlN/ml/day according to the Boltzmann model. The daily production of hydrogen between the days (5 to 8) is around 0.019 mlN/ml/day for the Logistic model and around 0.028 mlN/ml/day for the Boltzmann model. The maximum hydrogen production is reached at the Logistic function in day 7 with 0.0198 mlN/ml/day, respectively for the Boltzmann model is also in day 7 with 0.029 mlN/ml/day. Subsequently the daily hydrogen production decreases, and after day 15 is below 0.005 mlN/ml/day for both models.
It can be observed that regardless of the mathematical model used for the modeling of biogas production, the results are quite similar except the daily hydrogen production where the Boltzmann model is better than the Logistic model.
In order to establish which of the Logistic and Boltzmann models are more adequate to describe the hydrogen share in the biogas, the cummulated hydrogen production and the daily hydrogen production, more experiments, capable to provide more observations and experimental data, are needed.
Conclusions
It was found that the share of hydrogen in the biogas obtained by biomass digestion, the cumulated production of hydrogen and the daily production of hydrogen, can be modelled by two mathematical models: Logistic and Boltzmann.
The maximum share of hydrogen in the biogas was found to be of 26.36%.
The maximum daily production of hydrogen was found to be of 0.0198 mlN/ml/day based on the Logistic model and of 0.029 mlN/ml/day based on the Boltzmann model.
More experiments are needed to decide which of the Logistic and Boltzmann models is the most adequate to describe the daily hydrogen production.
Acknowledgement
This study is supported by the Sectoral Operational Programme for Human Resources Development POSDRU/159/1.5/S/137516 financed from the European Social Fund and by the Romanian Government.
The experimental part was supported by the German Federal Environmental Foundation and Helmholtz Centre for Environmental Research - UFZ Leipzig, Germany. Authors would also like to express their gratitude towards Birke Brumme for the technical help in the Gas Chromatography experiments.
References
1. Das D., Veziroğlu N., Hydrogen production by biological processes: a survey of literature, International Journal of Hydrogen Energy, 2001, 26, p. 13-28.
2.
Lipman T., An Overview of Hydrogen Production and Storage Systems with
Renewable Hydrogen Case Studies-A Clean Energy States
3. Sato S., Thermochemical hydrogen production, Solar-hydrogen energy systems, 1979, p. 81-114.
4. Dutta S., Technology assessment of advanced electrolytic hydrogen production, International Journal of Hydrogen Energy, 1990, 15(6), p. 379-386.
5. Turner J. A., Sustainable Hydrogen Production, Toward a Hydrogen Economy-Science, 2007, 305, p. 972-974.
6. Wang X., Maeda K., Thomas A., Takanabe K., Xin G., Carlsson J. M., Domen K., Antonietti M., A metal-free polymeric photocatalyst for hydrogen production from water under visible light, Nature Materials, 2009, 8, p. 76-80.
7. Wang X., Zhao Y.-C., A bench scale study of fermentative hydrogen and methane production from food waste in integrated two-stage process, International Journal of Hydrogen Energy, 2009, 34(1), p. 245-254.
8. McKendry, P., Energy production from biomass (part 1): overview of biomass, Bioresource Technology, 2002, 83(1), p.37-46.
9. Rubin E., Genomics of Cellulosic Biofuels, Nature, 2008, 454, p. 841-845.
10. Monlau F., Barakat A., Trably E., Dumas C., Steyer J.-P., Carrère H., Lignocellulosic materials into biohydrogen and biomethane: impact of structural features and pre-treatment, Critical Reviews in Environmental Science and Technology, 2011, 43(3), p.260-322.
11. Monlau F., Barakat A., Trably E., Dumas C., Steyer J.-P., Carrère H., Lignocellulosic materials into biohydrogen and biomethane: impact of structural features and pre-treatment, Critical Reviews in Environmental Science and Technology, 2011, 43(3), p. 260-322.
12. Teleky B. E., Bălan M. C., Actual Knowledge about Hydrogen Production by Anaerobic Digestion of Lignocellulosic Biomass, Fundamental Sciences and Applications, 2015, 21, p. 201-204.
13. Guo X. M. G., Trably E., Latrille E., Carrére H., Steyer J.-P., Hydrogen production from agricultural waste by dar fermentation: A review, International Journal of Hydrogen Energy, 2010, 35, p. 10660-10673.
14. Liu C.-Z., Cheng X.-Y., Improved hydrogen production via thermophilic fermentation of corn stover by microwave-assisted acid pretreatment, International Journal of Hydrogen Energy, 2010, 35, p.8945-8952.
15. Chou C.-H., Wang C.-W., Huang C.-C., Lay J.-J., Pilot study of the influence of stirring and pH on anaerobes converting high-solid organic wastes to hydrogen, International Journal of Hydrogen Energy, 2008, 33, p.1550-1558.
16. Kyazze G., Dinsdale R., Hawkes F. R., Guwy A. J., Premier G. C., Donnison I.S., Direct fermentation of fodder maize, chicory fructans and perennial ryegrass to hydrogen using mixed microflora, Bioresource Technology, 2008, 99, p. 8833-8839.
17. Pohl M., Heeg K., Mumme J., Anaerobic digestion of wheat straw – Performance of continuous solid-state digestion, Bioresource Technology, 2013, 146, p.408-415.
18. Wang W., Xie L., Luo G., Zhou Q., Enhanced fermentative hydrogen production from cassava stillage by co-digestion: The effects of different co-substrates, International Journal of Hydrogen Energy, 2013, 38, p.6980-6988.
19. Yu L., Wensel P. C., Ma J., Chen S., Mathematical Modeling in Anaerobic Digestion (AD), Bioremediation & Biodegradation, 2013, 4, p. 1-12.
20. Zwietering M. H., Jongenburger I., Rombouts F. M., Vant Riet K., Modeling of the Bacterial Growth Curve, Applied and Environmental Microbiology, 1990, 56(6), p.1875-1881.
21.
Puczkó L., Health, Wellness and Tourism: healthy tourists, healthy
business?,
Proceedings of the Travel and Tourism Research Association Europe 2010 Annual
Conference 1-3 September,
22. DSMZ 640, Caldicellulosiruptor Medium, Leibniz Institute DSMZ-German Collection of Microorganisms and Cell Cultures, (accessed 30.11.2015) Available URL : https://www.dsmz.de/microorganisms/medium/pdf/DSMZ_Medium640.pdf .
23. Teleky B. E., Bălan M. C., Jäntschi L., Anaerobic digestion of straw by lignocellulose degrading bacteria, Analele Universității din Oradea-Fascicula Chimie, 2013, XX, p. 15-21.
24. Rozzi A., Remigi E., Methods of assessing microbial activity and inhibition under anaerobic conditions: a literature review, Reviews in Environmental Science & BioTechnology, 2004, 3(2), p. 93-115.
25. Porsch K., Wirth B., Tóth E. M., Schattenberg F., Nikolausz M., Characterization of wheat straw-degrading anaerobic alkali-tolerant mixed cultures from soda lake sediments by molecular and cultivation techniques, Microbial Biotechnology, 2015, p.1-14.
26. Jäntschi
L., Naşcu H.
27. Macy J. M., Snellen J. E., Hungate R. E., Use of a syringe methods for anaerobiosis, The American Journal of Clinical Nutrition, 1972, 25, p. 1318-1323.
28. Teleky B. E., Bălan M. C., Timeline of gas production under anaerobic conditions, Bioprocessing and Biotechniques, 2015, 5(4), p. 1-6.
29. FindGraph, version 2.281, Copyright (C) UNIPHIZ Lab, 2002-2010, For Stefan Andreas R., www.uniphiz.com.
30. Berger R. D., Comparisson of the Gompertz and Logistic Equations to Describe Plant Disease Progress, Phytopathology, Ecology and Epidemology, 1981, 71, p. 716-719.
31. Boltzmann L., Studies on the balance of kinetic energy between moving material points (in German), Wiener Berichte, 1868, 58, p. 517-560.