Optimization of ash yield from the combustion of palm kernel shell and selected additives (Al2O3, CaO and MgO) using D-optimal design
Kamoru Olufemi OLADOSU1*, Buliaminu KAREEM2, Basil Olufemi AKINNULI2 and Abass Olanrewaju ALADE3
1 Dept. of Mechanical Engineering, Ladoke Akintola University of Technology Ogbomoso, Oyo State, Nigeria
2 Dept. of Mechanical Engineering, Federal University of Technology Akure, Ondo State, Nigeria
3 Dept. of Chemical Engineering, Ladoke Akintola University of Technology Ogbomoso, Nigeria
E-mails: oladosukamoru@lautech.edu.ng; karbil2002@yahoo.com;
ifembola@yahoo.com; abasslad@yahoo.com
*Corresponding Author, phone: +234 803 595 9872
Received: April 1, 2016 / Accepted: July 14, 2016 / Published: July 31, 2016
Abstract
This study aimed at optimizing the mixture of palm kernel shell (PKS) and selected additives (Al2O3, MgO, and CaO), on the yield of ash after combustion using D-optimal under the Mixture Methodology of the Design Expert (6.0.8). The samples were oven-dried at 105°C, then placed in furnace at 575°C and ashed to a constant weight based on the experimental design. Al2O3 (5.0%), MgO (5.0%), CaO (5.0%), PKS (85.0%) and Particle Size 1.0 mm gave the highest yield (1.39%) of ash while the combination of Al2O3 (2.5%), MgO (0.0%), CaO (5.0%), PKS (92.5%) and Particle Size (5.50 mm) gave the lowest yield (0.31%) of ash after combustion. The regression coefficient (R2) of the model equation obtained for the process is 0.2985, while the predicted R2 is 0.1673, which shows a reasonable agreement with the adjusted R2 (0.2902). The results of optimization indicate that mixed ratio of additive such as Al2O3, MgO, and CaO with PKS and particle size influenced the yield of ash after combustion and the essential additive are Al2O3 and CaO. This study has therefore indicated the efficacy of using additive mixed with PKS to achieve lowest ash yield and therefore reduce negative impacts of increased ash deposition on the efficiency and operation of a combusting unit.
Keywords
Additives; Ash; D-optimal design; Optimization; Palm Kernel Shell
Introduction
Oil palm has become one of the important raw materials in modern world. It generates high income for most of Asian countries such as Malaysia, Indonesia and Thailand [1].Various products such as palm oil fiber effluent, kernel shell and empty fruit bunch are regarded as wastes. In [2] and [3] is reported that some of these wastes are currently used in engineering applications such as concrete reinforcement in construction industry and production of activated carbon for industrial use [4].
Palm kernel Shell (PKS) which constitute significant percentage of solid waste from the oil palm processing has been the choice for fuelling boilers for power production due to its high energy value [5]. PKS can also be suitably mixed with additives to reduce ash deposition and thereby increase its potential for use in heat and power production [6]. PKS shows tendency of bed agglomeration in fluidized bed combustion due to elevated alkali content in it [7].
Wangs and Houshfa [8] showed that addition of sewage sludge significantly reduced ash deposition of the wheat straw and wood waste and consequently decrease corrosion potential of the reactor. In other study, Katsuya and Ichiro [9], reported a significantly reduced ash deposition in Mg based addition to upgraded brown coal.
Another research [10] presented negative impacts of increased ash deposition by oil palm wastes combustion on the efficiency and operation of combustion system include; the decrease in the combustor utilization efficiency, damage to the combustor as well as maintenance problems.
In order to obtain higher energy conversion efficiency in a combustor, it is imperative to investigate the optimal additive to be mixed with PKS. Design of Experiment is helpful in investigating and optimization of the mixture effect of several process variables influencing responses with a minimum number of experimental runs while varying the variables concurrently. In mixture experiments, the measured response is assumed to depend only on the relative ratio of the components in the mixture and not on the amount of the mixture, compared to Taguchi and factorial methods [11].
The aim of this study is to investigate the influence of optimizing the mixture of PKS and selected additives such as Al2O3, CaO and MgO on the yield of ash after combustion, with the view of developing an effective fuel blend for a typical boiler.
Material and method
Palm Kernel Shells were collected from a local palm oil processing mill in Ogbomosho, South-western Nigeria, The shell were crushed into smaller pieces by using granulator (SG-16 Series). The sizes of the pieces were further reduced with blender and subsequently sieved to various particle sizes (1 - 7 mm). All the additives (Al2O3, MgO and CaO) of analytical grades were obtained from manufacturer and all equipment were well calibrated before use.
Experimental design
D-optimal design under the Mixture Methodology was employed to optimize the mixture and process factor. The design was performed using a Design Expert Software (6.0.8). The minimum and maximum levels of the component (Al2O3, CaO, MgO and PKS) were in the range 0 - 100% while, the factor levels were in the range 1 – 7mm (Table 1). The software then gave 35 experimental Runs which mixed the additives and PKS in various percentages but all aggregated to 100% and at each experimental run for the various particle sizes.
Table 1. Component, factor and their levels for D-optimal design
|
Component |
Name |
Level (%) |
|
|
Low |
High |
||
|
A |
Al2O3 |
0.00 |
5.00 |
|
B |
CaO |
0.00 |
5.00 |
|
C |
MgO |
0.00 |
5.00 |
|
D |
PKS |
85.00 |
95.00 |
|
Factor |
Unit |
Low |
High |
|
Particle size |
Mm |
1.00 |
7.00 |
Determination of ash yield in the mixture of PKS and additives
The determination of ash yield in the mixture of PKS and selected additives (Al2O3, CaO, and MgO) and PKS were carried out using the ASTM E1755-01 [12]. Weighed amount (2%) of sample (mixture of PKS and additive) were put into 50 ml crucible and dried in an oven at 105°C to remove moisture content, then stored in desiccators to cool to determine oven-dry-weight (ODW). The samples were then placed on ashing burner over the flame until smoke appears. The samples were allowed to burn until no smoke or flame appears. Crucibles with the sample mix were placed in the muffle furnace at 575˚C for 24 hours. At this stage the samples were handled with care to avoid mechanical loss of the sample. The crucibles from the furnace were directly placed in the desiccators and allowed to cool for 1hr. Samples were later re-charged into the muffle furnace at 575˚C and ashed to constant weight. The ODW and the percentage ashed were determined according to equations 1 and 2.
|
|
(1) |
|
|
(2) |
Statistical analysis
The data (response) obtained from the mixed ratio of additives and PKS on the yield of ash experiments (Table 2) were analysed statistically using facilities embedded in the Design-Expert Software version 6.0.8 Stat-Ease Inc. [13], The quality of the fit of the model was evaluated using test of significant and Analysis of variance (ANOVA).
Optimization procedures of ash yield from the combustion of PKS and additives
Based on the process of investigating minimum ash yield from the combustion of PKS and selected additives, an algorithm was prepared and then translated to design expert software version 6.0.8 version. The flow chart upon which the algorithm was based is shown in Figure 1.
1. Collection of PKS from a local oil palm mill in Iresapa, Ogbomosho, Nigeria;
2. The shell were crushed to various particle sizes ranging from (1-7mm);
3. Additives such as (Al2O3, MgO, and CaO) of analytical grades were obtained from manufacturer and all equipment were well calibrated before use;
4. Click D-optimal design under mixture methodology using design expert software version 6.0.8;
5. Select the number of mix components and enter (Al2O3, MgO, and CaO),PKS and their corresponding levels (low and high) in the dialog box provided;
6. Select the numerical factor and enter particle sizes and its level;
7. Select number of response and type ash yield for design with both mixture and process factor and then click continue;
8. Enter the response data obtained in the design layout view;
9. Click on the ash yield under analysis and follow the steps displayed at buttons across the top of the view as follows:
10. Click on square root under transformation;
11. Click on fit summary to evaluate mixture process crossed model;
12. Click on model order and desired terms from list;
13. Click on analysis of variance ANOVA to analyse the chosen model and view results;
14. Click on diagnostic to evaluate model fit and transformation choice with graphs;
15. Click on model graph to interpret and evaluate the model.
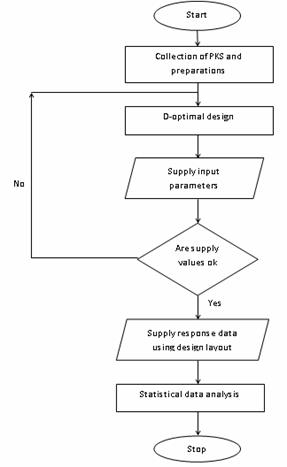
Figure 1. Flowchart showing operational procedure of the ash yield from the combustion of PKS and additives
Results and discussion
Thirty-five experimental runs using D-optimal design for mixture and factor study and the ash yield response (Table 2). Cross linear model was suggested for this experiment (Table 3).
Table 2. Results of D-optimal design for mixture and factor study and the ash yield response
|
Run |
(%) Composition of Components |
Factor |
Response |
|||
|
Al2O3 |
MgO |
CaO |
PKS |
Particle Size (mm) |
Ash Yield (%) |
|
|
1 |
5.00 |
5.00 |
0.00 |
90.00 |
7.00 |
0.99 |
|
2 |
0.00 |
5.00 |
5.00 |
90.00 |
7.00 |
1.07 |
|
3 |
5.00 |
5.00 |
2.50 |
87.5 |
5.50 |
0.69 |
|
4 |
0.00 |
2.50 |
2.50 |
95.00 |
4.00 |
0.35 |
|
5 |
0.00 |
5.00 |
0.00 |
95.00 |
4.00 |
0.95 |
|
6 |
5.00 |
0.00 |
0.00 |
95.00 |
7.00 |
0.95 |
|
7 |
0.00 |
5.00 |
0.00 |
95.00 |
1.00 |
0.80 |
|
8 |
5.00 |
0.00 |
5.00 |
90.00 |
1.00 |
0.90 |
|
9 |
5.00 |
5.00 |
0.00 |
90.00 |
4.00 |
0.66 |
|
10 |
0.00 |
0.00 |
5.00 |
95.00 |
4.00 |
0.69 |
|
11 |
0.00 |
5.00 |
5.00 |
90.00 |
1.00 |
0.47 |
|
12 |
5.00 |
0.00 |
0.00 |
95.00 |
1.00 |
0.75 |
|
13 |
2.50 |
0.00 |
2.50 |
95.00 |
7.00 |
0.70 |
|
14 |
5.00 |
5.00 |
2.50 |
87.50 |
1.00 |
1.38 |
|
15 |
5.00 |
0.00 |
5.00 |
90.00 |
7.00 |
1.03 |
|
16 |
5.00 |
2.50 |
0.00 |
92.50 |
1.00 |
0.70 |
|
17 |
2.50 |
2.50 |
5.00 |
90.00 |
4.00 |
0.63 |
|
18 |
2.50 |
0.00 |
5.00 |
92.50 |
5.50 |
0.31 |
|
19 |
0.00 |
5.00 |
0.00 |
95.00 |
7.00 |
0.35 |
|
20 |
5.00 |
5.00 |
5.00 |
85.00 |
1.00 |
1.39 |
|
21 |
2.50 |
5.00 |
5.00 |
87.50 |
2.50 |
0.63 |
|
22 |
5.00 |
0.00 |
2.50 |
92.50 |
2.50 |
0.41 |
|
23 |
0.00 |
5.00 |
5.00 |
90.00 |
4.00 |
0.64 |
|
24 |
2.50 |
5.00 |
2.50 |
90.00 |
4.00 |
0.55 |
|
25 |
5.00 |
2.50 |
2.50 |
90.00 |
7.00 |
0.41 |
|
26 |
2.50 |
2.50 |
0.00 |
95.00 |
7.00 |
0.48 |
|
27 |
0.00 |
0.00 |
5.00 |
95.00 |
7.00 |
0.31 |
|
28 |
2.26 |
2.26 |
2.26 |
93.21 |
1.00 |
0.62 |
|
29 |
5.00 |
0.00 |
5.00 |
90.00 |
4.00 |
0.70 |
|
30 |
0.00 |
0.00 |
5.00 |
95.00 |
1.00 |
0.66 |
|
31 |
5.00 |
0.00 |
0.00 |
95.00 |
4.00 |
1.04 |
|
32 |
5.00 |
5.00 |
5.00 |
85.00 |
7.00 |
0.99 |
|
33 |
0.00 |
5.00 |
0.00 |
95.00 |
2.50 |
0.35 |
|
34 |
2.50 |
5.00 |
0.00 |
92.50 |
1.00 |
0.41 |
|
35 |
5.00 |
5.00 |
5.00 |
85.00 |
4.00 |
1.03 |
Table 2 shows that Experimental Run 18 [Al2O3 (2.5%), MgO (0.0%), CaO (5.0%), PKS (92.5%) and Particle Size (5.50 mm)] and Experimental Run 27 [Al2O3 (0.0%), MgO (0.0%), CaO (5.0%), PKS (95.0%) and Particle Size (7.0 mm)] gave same lowest ash yield (0.31%) However, [14] reported optimization analysis of palm kernel shell combustion in a fluidized bed, that the best combustion and emission performance is achieved when burning with a mean particle size of about 5.0 mm and this favours the suggested Run 18. Similarly, [7] suggested 40% of Alumina sand and 60% dolomite as bed material when burning Palm kernel shell in fluidized bed combustion. Predominant component in alumina sand was Al2O3 while the major element in dolomite was CaO. This is also in good agreement with experimental Run 18 when compared with Run 27. Run 20 [Al2O3 (5.0%), MgO (5.0%), CaO (5.0%), PKS (85.0%) and particle size 1.0 mm] gave the highest yield (1.39%) of ash, and this is not desirable because the combination will decrease the combustor utilization efficiency and increase corrosion potential of the reactor [9]. Thus, Run 18 was considered for further studies in the experiments because it gave the lowest yield of ash after combustion.
Table 3. Analysis of Variance (ANOVA) for Mixture Crossed Linear-Mean Model
|
Source |
Sum of square |
D.F. |
Mean Square |
F-Value |
Prob.> F |
|
Model |
0.39 |
3 |
0.13 |
5.50 |
0.003* |
|
Linear Mix |
0.39 |
3 |
0.13 |
5.50 |
0.003* |
|
Residual |
0.71 |
30 |
0.024 |
|
|
|
Cor. Total |
1.11 |
33 |
|
|
|
|
* Significant |
|||||
Table 3 shows that the model F-value of 5.50 indicates that the condition in the model is significant as the value of “Prob> F” less than 0.05 indicated. There is only 0.39% chance that the Model F-value could occur due to noise. The entire coefficients were considered in the design and the predicted R2 (0.1673) is in reasonable agreement with the adjusted R2 (0.2902). The “Adequate Precision” measures the signal to noise ratio and a ratio greater than 4 is desirable, therefore the ratio (6.438) in the analysis indicates an adequate signal that facilitates the use of the model for navigation of design space.
The developed linear model describing the relationship between the ash and the coded as well as actual factors are shown in the equations 3 and 4 respectively.
|
|
(3) |
|
|
(4) |

where, X1 = Al2O3, X2 = MgO, X3 = CaO and X4 = PKS
The diagnostic plots of Residuals vs. Normal plot of Residual for all responses are illustrated in (Figure 2). The response surface plots representing the effects of additives mixture X1 (Al2O3), X2(CaO) and X3 (MgO) and their square root interaction ash yield (Figure 3). The diagnostic plots of Residuals vs. Normal plot of Residual (Figure 2) for all responses are illustrated to show the adequacy of the model.
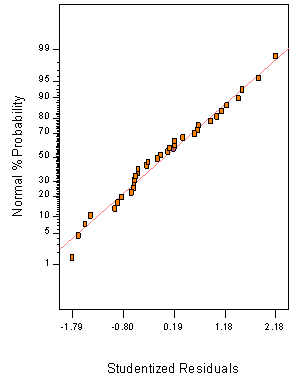
Figure 2. Normal plot of residual
 (a)
(a) (b)
(b)
 (c)
(c) 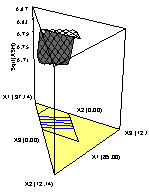 (d)
(d)
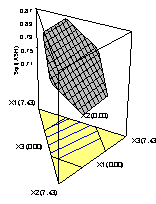
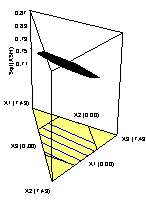
Figure 3. Response Surface Plots of the Effects of Additive Mixtures, Particle Size and their Square Root Interaction on PKS Ash. [a] X1 (Al2O3), X2 (CaO) and X3 (MgO), [b] X1 (CaO), X2 (Al2O3), and X3 (MgO), [c], X1 (MgO), X2 (Al2O3) and X3 (CaO), [d] X1 (PKS) X2 (Al2O3) and X3 (MgO)
Figure 3a shows the response surface plots representing the effects of additives mixture X1 (Al2O3), X2(CaO) and X3 (MgO) and their square root interaction ash while keeping X4 (PKS) at 92.57% and particle size at 5.54 mm.
The response surface plot in Figure 3b shows the effect of square root interaction of X1(CaO), X2(Al2O3), and X3(MgO) on percentage of ash while keeping X4 (PKS) at 92.57% and particle size 5.54 mm, on the other hand, Figure 3c illustrates the response surface plot of the effect of interaction of X1 (MgO), X2 (Al2O3) and X3 (CaO), while the actual component X4 (PKS) and particle size were kept at 92.57% and 5.54 mm, respectively.
Figure 3d illustrates the influence of interaction of X1 (PKS) X2 (Al2O3) and X3(MgO) while keeping X4 (CaO) at 2.86% and particle size at 5.54mm.
Conclusion
The result of the optimization indicates that the mixed ratios of the selected additives (Al2O3, MgO, and CaO) with PKS and particle size influence the yield of ash after combustion and essential additive are (Al2O3 and CaO). The model obtained has provided a basis for selecting optimum mixture of additives and PKS for the recovery of lowest ash in a typical combustor.
References
1. Okoroigwe E. C., Saffron C. M., Determination of Bio-energy potential of palm kernel shell by physicochemical characterization, Nigerian Journal of Technology, 2012, 31(3), p. 329-335.
2. Luanngkiattium T., Aangsathitkulachi C.M., Non-isothermal thermo gravimetric analysis of oil palm solid wastes, Bio-resource Technology, 2008, 99, p. 986-997.
3. Pansamut V., Pongrit V., Intarangis C., The oil palm department of alternative energy development and efficiency, Ministry of energy, Thailand, 2003.
4. Adewumi I. K., Ogedengbe M. O., Optimizing conditions for activated charcoal production from Palm kernel shells, Journal of Applied Science, 2005, 15(5), p. 1082-1087.
5. Dembiras A., Combustion characteristics of different fuel, Progress in Energy and Combustion Science, 2004, 30, p. 219-230.
6. Chungen A. Y., Rosendah L. A., Soren K. K., Firing of biomass for heat and power production, Progress in Energy and Combustion Science, 2008, 34, p.725-775.
7. Ninduangdee P., Kuprianov V. I., Fluidized-Bed Combustion of Biomass with Elevated Alkali Content:Study between Two Alternative Bed Materials, International Journal of Chemical, Nuclear, Metallurgical and Material Engineering, 2014, 8(4), p. 267-274.
8. Wangs T. L., Houshfa E., Effect of sewage sludge Addition on potassium release and ash transformation during wheat straw combustion, Chemical Engineering Transaction, 2014, 37, p. 7-12.
9. Katsuya K. H., Ichiro N., Effect of Mg based addition to upgraded brown coal on the ash deposition behaviour during combustion, Proc.7 th Combustion Institute, 2011, p. 5-7.
10. Yuanyuan S. J., Chuba O.C., Ash deposition in biomass combustion or cofiring for power and heat generation, Energies, 2012, 5. p. 5171-5189.
11. Anderson M. J., Whitcomb, P.J., Find the optimal formulation for mixture:Discover sweet spots where multiple product specification can be met in a most desirable way. Available at: www.statease.com/pubs/chem_2.pdf (accessed 07/2014)
12. ASTM standard method for determination of ash in biomass Natioanal renewable energy laboratory of the U.S Department of energy office of energy efficiency and renewable energy, 2005.
13. Vaughn N. A., et al, Design-Expert Software, Stat-Ease, Inc, Minneapolis, M N, USA, 2000.
14. Ninduangdee P., Kuprianov V. I., Combustion of palm kernel shell in a fludised bed: Optimization of biomass particle size and operating condition, Energy Convers Manage, 2014.