Faults detection approach using PCA and SOM algorithm in PMSG-WT system
Mohamed Lamine FADDA 1*, Abdelkrim MOUSSAOUI 2
1 Zerizer Center - W. Eltarf, 36230, Algeria
2 Electrical Engineering Laboratory of Guelma (LGEG), University 08 Mai 1945-Guelma, 24000, Algeria
E-mails: fadmamfad@yahoo.fr; akmoussaoui@yahoo.fr
* Corresponding author, phone: +213770408466
Received: March 22, 2016 / Accepted: July 17, 2016 / Published: July 31, 2016
Abstract
In this paper, a new approach for faults detection in observable data system wind turbine - permanent magnet synchronous generator (WT-PMSG), the studying objective, illustrate the combination (SOM-PCA) to build Multi-local-PCA models faults detection in system (WT-PMSG), the performance of the method suggested to faults detection in system data, finding good results in simulation experiment.
Keywords
Permanent magnet synchronous generator (PMSG); Diagnostic; Self Organized Map (SOM); Principal Component Analysis (PCA); Multi-PCA
Introduction
Wind energy is becoming an important consideration in the planning and development of the modern electric system. In the past decade, grew output of wind energy strongly, and was faster than the combination of all other forms of electrical energy, in this scientific boom, and the remarkable growth in wind turbines, in 2010 the wind energy industry installed more turbines than all previous years combined.
The wind energy tends to be one of the perfect renewable energy options, this is due to a number of factors, including the fact that wind stations are much quicker in design, construction, pollution, least expensive and permission than traditional stations [1].
Recently, the main objective of the wind energy is to be more economically, with increase profits and reduce costs, including costs associated with the maintenance of wind turbines, which it exploit the important weight of the costs [2,3].
The faults detection and isolation in wind turbines at an early stage is very important for the procedures maintenance and protection of the costly systems against faults, because these procedures can reduce outage time and can prevent errors greater can lead to damage in system.
Faults detection in WT-PMSG (Wind Turbine - Permanent Magnet Synchronous Generator) is a theme concerned by the research community, these methods are generally based on data exploration and analysis techniques, compression, data space transformation representation and neural network models.
In recent years, SOM (Self Organized Map) is one of the famous multivariate classification techniques used in fault detection. the idea is to define the projection of process data on a lower dimensional variable space, and extracting information without loss of useful information far noises, to greatly simplify the process monitoring procedure and acquire easily the faults detection steps after comparison between similar ideal systems. Where, the principal advantage of this method is in depending on historical and operational data without need for a thorough knowledge of the complicated process. The advantage of this technique can be in the remedy the problem posed by nonlinear relations in observable data, without need for a thorough knowledge of the complicated process, this method counter to old techniques, such as PCA (Principal Component Analysis) [4], we propose a new nonlinear process monitoring technique based on SOM Algorithm and PCA to solve the problem posed by nonlinear relation in observable data.
Material and method
Wind turbine modelling
The power extracted from the wind by a wind turbine is given by [5-7] the following formula:
|
|
(1) |
where ![]() is
the blade radius of the wind turbine,
is
the blade radius of the wind turbine, ![]() is the wind speed,
is the wind speed, ![]() is
the air density, and
is
the air density, and ![]() is the power
coefficient.
is the power
coefficient.
The torque that can be recovered on the turbine shaft is calculated by [6, 8] the following formula:
|
|
(2) |
where the torque
coefficient ![]() can
be approximated by the following sixth order polynomial function [6] as following:
can
be approximated by the following sixth order polynomial function [6] as following:
|
|
(3) |
The tip speed ratio is defined as:
|
|
(4) |
where, ![]() is
the mechanical angular velocity of the turbine rotor.
is
the mechanical angular velocity of the turbine rotor.
The ![]() equations is given by:
equations is given by:
|
|
(5) |
Synchronous generator modelling
This paper presents the model of permanent magnet synchronous generator based on wind energy conversion system. We use the park model. Then, the PMSG model is given as follows [8]:
|
|
(6) |
|
|
(7) |
|
|
(8) |
where vd, vq, id, iq
are respectively the magnitudes of stator voltages and
currents on the axes d, q, also, ![]() is the torque of PMSG,
is the torque of PMSG, ![]() is the rms of the flux generated by
the rotor and which passes through the armature windings, Lq is
q axis inductance, Ld is d axis inductance, Rs
is the resistance of a stator phase, ωr is the pulsation
of the rotor field, which is related to the rotation speed of the rotor Ω
by ωr = pΩ, and p is the quantity of poles pair.
is the rms of the flux generated by
the rotor and which passes through the armature windings, Lq is
q axis inductance, Ld is d axis inductance, Rs
is the resistance of a stator phase, ωr is the pulsation
of the rotor field, which is related to the rotation speed of the rotor Ω
by ωr = pΩ, and p is the quantity of poles pair.
The dynamic equations are given by:
|
|
(9) |
|
|
(10) |
where J is the inertia of rotor, Fr is the friction of rotor and rotor angular θr.
Synchronous generators play an important position due to their widely use in the field of wind energy. Hence, faults detection in synchronous generators is decisive to the reliability of wind turbines [9]. To help the preventive maintenance of these generators, the most important step is the early detection of defects, and without a stop or interruption in their operation.
Table 1. Simulation parameters PMSG WT System
|
Parameters PMSG WT |
||
|
Rp |
3 |
[m] |
|
Vw |
9 |
[m/s] |
|
ρ |
1.25 |
[kg/m3] |
|
Ld |
0.0273 |
[H] |
|
Lq |
0.0213 |
[H] |
|
Rs |
0.75 |
[Ω] |
|
p |
3 |
|
|
J |
0.2 |
[kg.m2] |
Principal Component Analysis (PCA)
PCA is a data analysis method based on a simple
transformation of collected data (observations
without fault), stored in a reduced and normalized matrix ![]() , to produce statistically independent score
variables, stored in
, to produce statistically independent score
variables, stored in ![]() [10-12].
[10-12].
|
|
(11) |
where, T and P are known as are the matrix of the principals components (PCs) and eigenvectors, respectively, from the spectral decomposition of the covariance
matrix ![]() of
of ![]() :
:
|
|
(12) |
|
|
(13) |
where ![]() is the diagonal matrix composed of m eigenvalues in descending order.
is the diagonal matrix composed of m eigenvalues in descending order.
By projecting the original information onto a lower dimensional space l<m, Xcan be decomposed as the following equation:
|
|
(14) |
where,
|
|
(15) |
and
|
|
(16) |
With
|
|
(17) |
the
residual matrix![]() can
as following :
can
as following :
|
|
(18) |
where ![]() and
and ![]() are the matrix of the principals components and eigenvectors,
respectively of the main sub-space,
are the matrix of the principals components and eigenvectors,
respectively of the main sub-space, ![]() and
and ![]() are the matrix of the principals components and eigenvectors, respectively of the residual sub-space.
are the matrix of the principals components and eigenvectors, respectively of the residual sub-space.
The number of proper principal components ![]() can
be determined by different methods, such as, the accumulated
contributions of the principal components, VNR (unreconstructed variable) or
cross validation [12].
can
be determined by different methods, such as, the accumulated
contributions of the principal components, VNR (unreconstructed variable) or
cross validation [12].
Process monitoring is based on the two
statistics called ![]() and
and ![]() respectively [12].
respectively [12].
The Hotelling ![]() statistic, based on the first
statistic, based on the first ![]() PCs, is defined as:
PCs, is defined as:
|
|
(19) |
The confidence limit for ![]() at
significance level
at
significance level ![]() are related to the F-distribution
is as follows:
are related to the F-distribution
is as follows:
|
|
(20) |

The squared prediction error SPE or Q statistic indicates the correspondence of each sample to the model, measured by the projection of the vector samples in the residual subspace. The prediction from the PCA model is given by [12]:
|
|
(21) |
The process is considered in normal situation if:
|
|
(22) |
where ![]() is the detection threshold of
is the detection threshold of ![]() significance
significance ![]() level.
level.
|
|
(23) |
|
|
(24) |

![]() is the confidence limits for the
(1-α) percentile in a standard normal
distribution. These confidence limits are calculated based on the assumptions
that the measurements are time independent and multivariate normally
distributed.
is the confidence limits for the
(1-α) percentile in a standard normal
distribution. These confidence limits are calculated based on the assumptions
that the measurements are time independent and multivariate normally
distributed.
Self-Organizing Maps (SOM)
Self-organizing maps provide an alternative to PCA that is accommodating nonlinear relationships in the dataset [13, 14].
SOM is a method data analysis to complement traditional linear techniques without replacement, although it provides additional power for nonlinear datasets [14].
As SOM algorithm is a method of nonlinear projection, it effectively classify data into different clusters, without any explicit modeling of the system [13, 14].
The formation of SOM is iterative time process that
converges to centroids of input vectors ![]() , the index of the winner class is defined
on the basis of the most widely
used distance, the Euclidean distance between
, the index of the winner class is defined
on the basis of the most widely
used distance, the Euclidean distance between![]() and
and ![]() , with calculation of the minimum
distance[4, 14-16].
, with calculation of the minimum
distance[4, 14-16].
|
|
(25) |
where ![]() is
the winner prototype and
is
the winner prototype and ![]() is
the index of the winner class.
is
the index of the winner class.
Through a similarity measure and update the values of the vectors of the winning prototype
|
|
(26) |

![]() is the learning rate and
is the learning rate and ![]() the
neighbors of class c.
the
neighbors of class c.
Equations of updated prototype can be as follow:
|
|
(27) |

After define the optimized vector, the classification of the input data (without faults) is obtained in model saint, this classification can be characterized by the distances between the input data and their prototypes. On this concept the proposed method fault detection was been based.
SOM fault detection
This paper presents the case of modeling used the SOM algorithm, where the input data corresponding to a normal data has been used to train the SOM. This data can be represented by normal model formed with different classes; this last is characterized by their prototypes and detection threshold. Once, the model is ready, it is exposed to the actual data from the system under unknown state. The data points are injected and classified onto the precedent model to describing the current state of the system. This information can be used for fault detection (Figure 1).
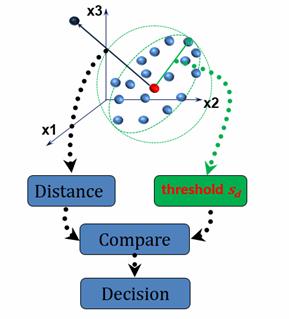
Figure 1. Fault detection with Kohonen (SOM) algorithm
For the detection of defective data, threshold is
used; it is a distance ![]() interval that defines the class
containment of data.
interval that defines the class
containment of data.
This data is abnormal if the distance between the prototype of class and the data exceeds the detection threshold.
|
|
(28) |
where
|
|
(29) |
Pc is the prototype of the class c.
The detection
threshold is defined by the maximum distance can cover
the class to contain data, consider
the actual data from the system![]()
|
If Else
|
(30) |
After determine the threshold
detection, this method can used in real time, where![]() can be a new data classified in
can be a new data classified in![]() ,
and
,
and![]() is the prototype of the class c.
is the prototype of the class c.
Multi-models PCA approach
The nonlinear PCA is an extension of the linear PCA [17]. While this latter seeks to identify linear relationships between the variables of the process, the purpose of the non-linear PCA is to extract both linear relationships and analyze nonlinear data [18].
Modeling with multi-models PCA
We propose in this work, a nonlinear model can be combining several PCA-linear models. The idea of this approach is to understand the nonlinear behavior of a system by a set of local models (PCA-linear).
The concept of multi-model introduces the definition of the use of the PCA in different operating zones. To determine the different local models [4], the Kohonen algorithm (SOM) is used for the classification of data, each class data supply the PCA to determine the sub-model and subsequently detect anomalies by different indices detection study in Figure 2.
Figure 2. The sketch map of the fault detection
Also, the proposed method can used in real time, with fixing the class correspond the new measure and examine it state if it normal or defected.
SOM-PCA fault detection algorithm
Step 1: Obtain data X without fault
Step 2: Data Modelling
SOM data classification in i classes ci
·
Fault
detection indices Di and threshold ![]()
PCA data model of ci
· Fault detection
indices SPE and threshold
![]()
Step 3: Obtain new data
Step 4: New Data test
Projection of new data in ci classes using SOM
·
Fault
detection indices Di and compare with threshold ![]()
PCA Fault detection
· Fault detection indices
SPE and compare with threshold
![]()
Step 5: Decision
If SPE < ![]()
![]() is normal else
is normal else ![]() is abnormal
is abnormal
Di < ![]()
![]() is normal else
is normal else ![]() is abnormal.
is abnormal.
Results and discussion
The feasibility of the proposed method is evaluated using signals derived from the modeling the system wind turbine and PMSG outputs (currents in three phases) in normal case, and with created faults.
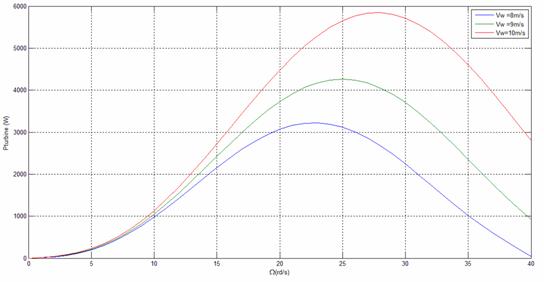
Figure 3. Wind Turbine Power coefficients versus tip speed ratio in different cases of wind speed
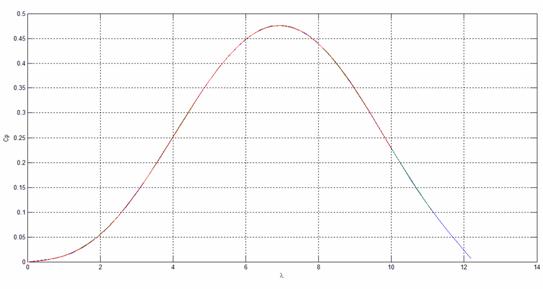
Figure 4. Power coefficients versus rotational speed in different cases of wind speed
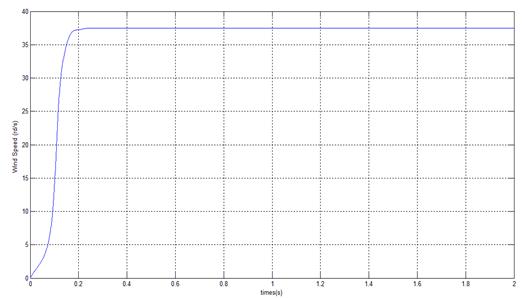
Figure 5. Time evolution of wind speed
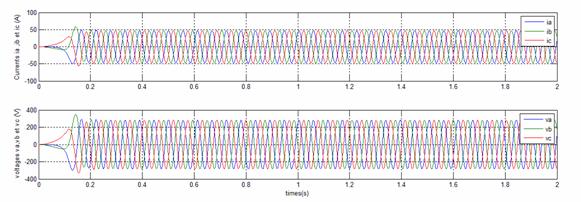
Figure 6. Time evolution of currents and voltages without fault
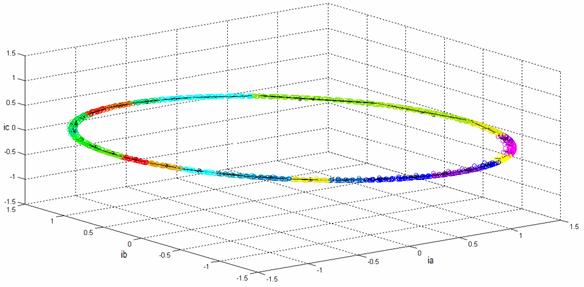
Figure 7. Estimation of the curve using the SOM-PCA
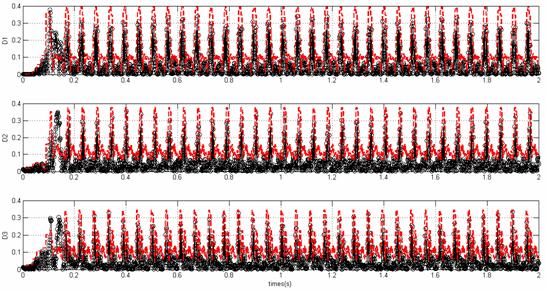
Figure
8. Time evolution of distances (![]() ) without fault
) without fault
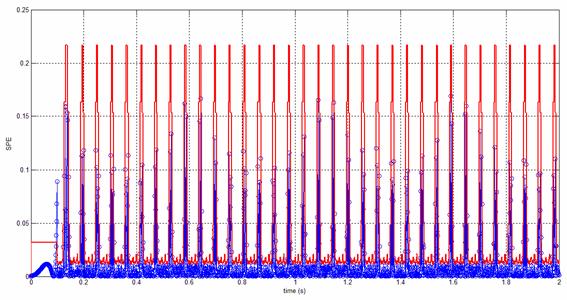
Figure 9. Time evolution of SPE without fault
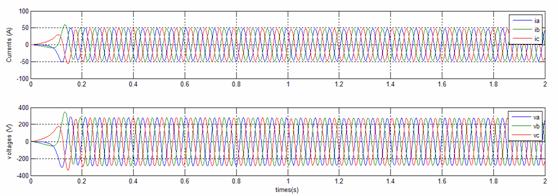
Figure 10. Time evolution of currents and voltages with fault
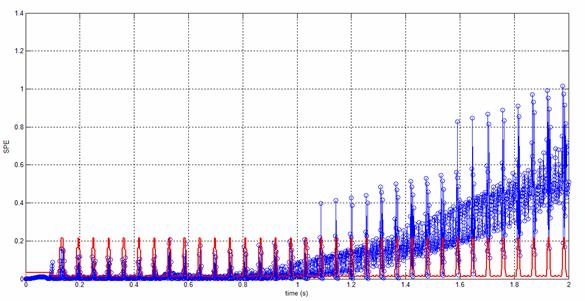
Figure 11. Time evolution of SPE with fault
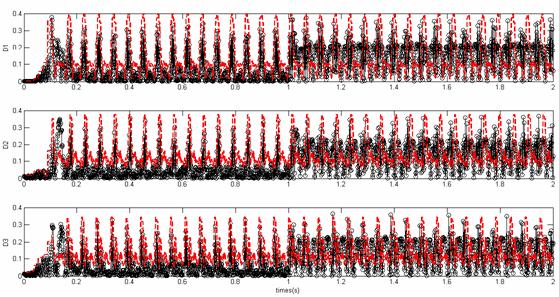
Figure 12.
Time evolution of distances (![]() )
with faults
)
with faults
Considered faults
In this paper, the simulated defects on resistance due to an increase in
temperature will be studied. Considered fault is increases by ![]() of the stator
resistance value
of the stator
resistance value![]() ,
the resistance versus the temperature is expressed as:
,
the resistance versus the temperature is expressed as:
|
|
(31) |
![]() is
the resistance value at
is
the resistance value at ![]() ,
, ![]() is the temperature coefficient of the resistance and
is the temperature coefficient of the resistance and ![]() is the temperature variation [19].
is the temperature variation [19].
Three observable signals output (currents) used in simulation, to offer good graphical representation of Multi-model-local PCA in modeling performance (Figure 3 and 4).
In Figure 5 and 6 typical quantities of the turbine system without faults, as wind speed, voltage and current of wind generator, the estimated curve of the stationary regime of the measured data (currents) in normal conditions of simulation of the system WT-PMSG is presented in Figure 7. It can be observed different classes color, where estimated curve (models PCA) are showed with black color, and the values of SPE, representing the normal operating condition, are plotted as shown in Figure 8.
To show performances of the fault detection of the proposed approach, a fault is simulated at t =1 [sec], an increase to 15 % in Rs is applied to the system, the typical quantities of the turbine system with faults are showed in Figure 9 and 10, where little reduction in crest values of currents outputs, This fault is detected on the SPE and the distances as depicted in Figure 11 and 12.
Conclusion
This paper presents a new approach for faults detection based on the combination of linear PCA and Kohonen (SOM) Algorithm used in system WT-PMSG in continuous time domain. From the presented results, it is definitely able to reveal the time of faults and gives excellent results.
References
1. Kimball R., A rational look at renewable energy and the implications of intermittent power, Ed 1.2, Deseret Power, South Jordan, USA, 2010.
2. Amirat Y., Benbouzid M., Al-Ahmar E., A brief status on condition monitoring and fault diagnosis in wind energy conversion systems, Renew Sust Energ Rev, 2009; 3(9), 2629-2636.
3. Brandao R. F. M., Beleza-Carvalho J. A., Barbosa FPM. Forecast of faults in a wind turbine gearbox. In: IEEE Proceedings of 9th International Conference ELEKTRO 2012, 21-22 May 2012; Rajeck Teplice, Slovakia. New York, NY, USA: IEEE. p. 170-173.
4. Yang Y., Lu N., Wang F., Ma L., Chang Y., Statistical process monitoring using multiple PCA models. In: Proceedings of the American Control Conference IEEE 2002, 8-10 May 2002, Anchorage, Alaska, USA: IEEE, 2002, 6, p. 5072-5073.
5. Muyeen S. M., Tamura J., Murata T., Stability Augmentation of a Grid-connected Wind Farm. Springer, London, 2009.
6. Munteanu I., Bratcu A., Cutuluslis N., Ceanga E., Optimal Control of Wind Energy Systems;Toward a Global Approach. Springer-Verlag, London Limited, 2008.
7. Eisenhut C., Krug F., Schram C., Klockl B., Wind-Turbine Model for System Simulations Near Cut-In Wind Speed. IEEE T Energy Conver, 2007, 22(2), p. 414-420.
8. Pierre S., Nichita C., Brossard J., Jo C. H., Concept development of real time emulators for offshore wind power (OWP) and tidal current power (TCP) hybrid system. In: IEEE 17th International Conference System Theory Control and Computing (ICSTCC’2013), 11-13 October 2013, Sinaia, România. New York, NY, USA: IEEE. p. 416-421.
9. Yang W., Condition monitoring and fault diagnosis of a wind turbine synchronous generator drive train, IET Renew Pow Gen, 2009, 3(2), p. 630-636.
10. Dunia R., Qin S. J., Subspace approach to multidimensional fault identification and reconstruction, AIChEJ, 1998, 44 (8), p. 1813-1831.
11. Dunia R., Qin S. J., Edgar T. F., Identification of faulty sensors using principal component analysis, AIChE J 1996, 42(10), p. 2797-2812.
12. Ouni K., Dhouibi H., Nabli L., Hassani M., New monitoring method based principal component analysis and fuzzy clustering, International Journal of Physical Sciences, 2013, 8(18), p. 901-914.
13. Kohonen T., Self-organizing maps. 3rd edition. NewYork, USA: Springer Series in Information Sciences, 30, 2001.
14. Reusch D. B., Alley R. B., Hewitson B. C., Relative performance of self-organizing maps and principal component analysis in pattern extraction from synthetic climatological data. Polar Geogr Geol, 2005, 29(3), p. 188-212.
15. Yang B. S., Han T., An J. L., ART-KOHONEN neural network for fault diagnosis of rotating machinery. Mech Syst Signal Pr, 2004, 18(3), 645-657.
16. Saxena A., Saad A., Fault Diagnosis in Rotating Mechanical Systems Using Self-Organizing Maps. In: Artificial Neural Networks in Engineering Conference (ANNIE’2004), 7-10 November 2004, St. Louis, Missouri, USA.
17. Zhu Q., Li C., Dimensionality Reduction with Input Training Neural Network and its Application in Chemical Process Modelling. Chinese Journal of Chemical Engineering 2006, 14(5), p. 597-603.
18. Verbeek J. J., Vlassis N., Kröse B. J. A., A k-segments algorithm for finding principal curves. Pattern Recogn Lett, 2002, 23(8), p. 1009-1017.
19. Ramahaleomiarantsoa J. F., Sambatra E. J. R., Héraud N., Razafimahenina J. M., Performances of the PCA Method in Electrical Machines Diagnosis Using Matlab. In: Katsikis V, editor. MATLAB - A Fundamental Tool for Scientific Computing and Engineering Applications - Chap. 4. Rijeka, Croatia: InTech, 2012, 1, p. 69-88.