Optimization of sand mould type and melting parameters to reduce porosity in Al-Si alloy castings
Viquar M. MOHAMMED1*, Krishnaiah ARKANTI2, Ferhathullah H. SYED1
1 Mechanical Engineering Department, Muffakham Jah College of Engineering and Technology, Mount Pleasant, 8-2-249 to 267, Road No. 3, Banjara Hills, Hyderabad, Telangana 500034, India
2 Mechanical Engineering Department, Osmania University, Osmania University Main Rd, Hyderabad, Telangana 500007, India
E-mails: mdviquar@mjcollege.ac.in; hussainysf@mjcollege.ac.in
* Corresponding author, phone: +919492039782
Received: April 13, 2016 / Accepted: July 17, 2016 / Published: July 31, 2016
Abstract
Sand mould casting remains one of the most widely used casting process because of its ability to produce wide variety of low cost components. From among the total metal casting production, over 60% of metal castings are processed by sand casting process alone and the rest is shared by all other casting processes. As a process sand casting involves many parameters which are even interdependent, if not controlled properly they may lead to defects which eventually affects the quality of the components. In this study an attempt has been made to optimize sand mould type and melting parameters and to study the influence of these parameters on the defect porosity of Al-Si alloy castings. The parameters selected are sand mould type, pouring temperature, amount of degasser and holding time at three levels each. Experiments are designed using Taguchis Orthogonal Array to identify the optimum level of process parameters. Analysis of Variance technique is used make out the significant factors and their percentage contribution. The results reveal that the amount of degasser is the most significant factor among the selected factors. Confirmation test conducted based on optimum level of process parameters shows that the porosity in the produced casting is reduced from 4.664% to 1.158%, and this value is found to be within the confidence interval.
Keywords
Porosity, Optimization; Sand mould parameters; Melting parameters; Casting quality; Taguchi method; Analysis of variance; ANOVA
Introduction
After ferrous castings, the most popular Non-Ferrous metal castings are aluminum castings. Over 15,357,327 metric tons of aluminum castings are produced in the world annually. Aluminum is also the most heavily consumed Non-ferrous metal in the world with the current consumption of 24 million tons [1].
Aluminum alloy castings are extensively used in transport, defense, construction, aerospace, electrical, domestic and general engineering purpose due to their excellent castability, machineability, corrosion resistance, excellent conductor of heat and electricity, and high strength-to-weight ratio [2-6]. Keeping in view the increase in demand for the use of aluminum in manufacturing of quality components to meet the goal of competing with the quality global market with challenge, aluminum foundries have to focus sharply on producing low cost and high quality castings. This can be achieved by reducing rejection rates and producing defect free castings.
Porosity is the well known casting defect and still one of the most difficult defects to eliminate from aluminum alloy castings. It has an adverse effect not only on the mechanical properties but also on the surface quality of the product. [3]. Porosity in aluminum is caused by the precipitation of hydrogen from liquid solution - gas pores, or by shrinkage during solidification shrinkage pores, and more usually by a combination of these effects.
Both of these types of pores can also be associated with aluminum oxide films also known as biofilms. Number of studies have undertaken by the researchers to understand the phenomenon of porosity formation, pore growth and pore morphology [2,4,5].
In this study, an experimental investigation is made to reduce the percentage of porosity to a minimum by optimizing the sand mould type and melting parameters in sand moulded Al-Si alloy castings so as to reduce the rate of rejection and produce quality castings.
Material and method
To optimize sand mold type & melting parameters, cause and effect diagrams are figured out as shown in the Figures 1 and 2 for the identification of main functions affecting the quality characteristics of Al-Si alloy sand mould castings. Figure 1 represents the sand mould type parameters such as dry sand mould, Sodium-silicate sand mould, Air-set sand mould and resin sand mould.
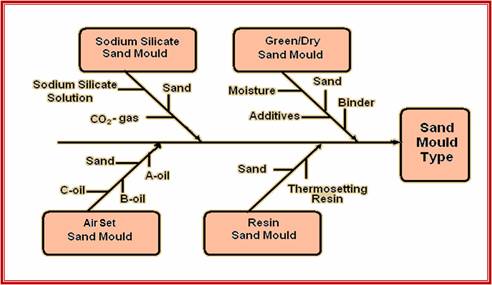
Figure 1. Cause and effect diagram for sand-mould type
Figure 2 indicates the molten metal parameters such as metal composition, furnace type, melting conditions and pouring conditions.
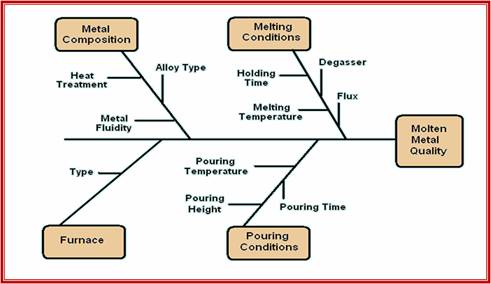
Figure 2. Cause and effect diagram for molten metal
From the cause and effect diagrams, sand mould type parameters selected for this study are sodium silicate sand mould, dry sand mould, and air-set sand mould. Resin sands are not considered as they are mainly used in shell mould castings. The melting parameters selected are pouring temperature, holding time and amount of degasser, keeping the alloy type and other parameters constant.
To identify most influencing process parameters among the selected parameters for aluminum alloy sand castings and optimize them to reduced porosity and improve the quality of the castings, Taguchis robust methodology of design of experiment is applied [6-12].
Taguchis robust experimental design methodology
1. Planning the experiment:
¸ Identify the main function of casting process.
¸ Identify the quality characteristic to be observed and objective function to be optimized.
¸ Identify control factors and their alternate levels.
¸ Design matrix experiment and define data analysis procedure.
2. Performing the experiment:
¸ Conduct the matrix experiment.
3. Analyzing and verifying the experimental results:
¸ Analyze the data, determine the optimum levels, and predict the performance under these levels.
¸ Conduct the verification test (also called confirmation experiment) and plan future actions.
Experimental data is also analyzed using Analysis of Variance (ANOVA) to obtain the most significant factors and their percentage contributions. The process estimate equation and confidence intervals are also calculated in order to estimate the amount of porosity using significant factors at their optimum levels [9-11].
Planning the experiment
From the cause and effect diagrams, the selected control factors and their levels are shown in Table 1.
Table 1. Control factors and their levels
|
FACTOR |
LEVEL |
|
|
|
1 |
2 |
3 |
|
|
Type of sand mould |
Sod.-Silicate Sand Mould |
Dry Sand Mould |
Air Set Sand Mould |
|
Pouring temperature |
690°C |
720°C |
750°C |
|
Amount of Degasser |
0.5% |
1% |
1.5% |
|
Holding Time |
2 min. |
4 min. |
6 min. |
In Table 2 is showed the selected orthogonal array for four parameters and three levels under full factorial method, the number of experiments required is 34 = 81, by selecting standard orthogonal array for four factors and three levels - L9, number of experiments are reduced to 9 and in Table 3 is represented the experimental design.
Table 2. Standard Orthogonal Array - L9 (34)
|
Expt. No. |
A |
B |
C |
D |
|
1 |
1 |
1 |
1 |
1 |
|
2 |
1 |
2 |
2 |
2 |
|
3 |
1 |
3 |
3 |
3 |
|
4 |
2 |
1 |
2 |
3 |
|
5 |
2 |
2 |
3 |
1 |
|
6 |
2 |
3 |
1 |
2 |
|
7 |
3 |
1 |
3 |
2 |
|
8 |
3 |
2 |
1 |
3 |
|
9 |
3 |
3 |
2 |
1 |
Table 3. Experimental design
|
Expt. No. |
Pouring temp. (°C) |
Amount of degasser (%) |
Holding time (min.) |
Type of sand mould |
|
1 |
690 |
0.5 |
2 |
SS |
|
2 |
690 |
1 |
4 |
DS |
|
3 |
690 |
1.5 |
6 |
AS |
|
4 |
720 |
0.5 |
4 |
AS |
|
5 |
720 |
1 |
6 |
SS |
|
6 |
720 |
1.5 |
2 |
DS |
|
7 |
750 |
0.5 |
6 |
DS |
|
8 |
750 |
1 |
2 |
AS |
|
9 |
750 |
1.5 |
4 |
SS |
|
*SS-Sodium-Silicate Sand, DS-Dry Sand, AS-Air Set Sand |
||||
Performing the experiment
Material/Equipment
Metal composition
A356 Aluminum alloy is used for experimental purpose and the composition of alloy is given in Table 4.
Table 4. Chemical composition of Aluminium alloy
|
Elements |
Cu |
Mg |
Si |
Fe |
Zn |
Mn |
Cr |
Ti |
Pb |
Ni |
Al |
|
% |
0.05 |
0.34 |
6.79 |
0.70 |
0.05 |
0.33 |
0.01 |
0.03 |
0.02 |
0.01 |
91.67 |
Sand mould compositions
Sand moulds are prepared using three compositions:
i. Sodium-Silicate sand mould (SS): It is prepared by a mixture of silica sand and 1.5 to 6% of sodium silicate solution (silica gel, water glass - binder), and mould is hardened by blowing CO2 gas at a pressure of 1.5 Kg/cm2 for few seconds:
Na2O(SiO2) + CO2 → Na2CO3 + 2SiO2 + Heat
ii. Dry sand mould (DS): It is prepared by adding Silica sand (SiO2) - 75 to 85%, Bentonite (clay - binder)- 5 to 12%, Water (moisture) - 2 to 4%, and Additives 0 to 3%, and left to dry for 48 to 72 hours.
iii. Air-Set sand mould (AS): Is prepared by Silica sand and fast curing chemical mixture (Part A- 2% of Sand, Part B 3 to 8% of Part A, and Part C 15 to 20% of Part A). Premix the required quantity of Part A and Part B, add to the sand and mix it for 2 to 4 minutes. Then add Part C, mix it again and make the mould immediately. Bench life for the sand is 12 to 15 minutes, Strip time is 40 to 45 minutes, and Shelf life of oils are up to 3 months @ 30°C.
By using the three sands of above composition, nine moulds are prepared and molten metal is poured into the mould as per the experimental plan to produce test castings. Metal is melted in lift out crucible type coke fired pit furnace. Coverall-A36 is used as a flux to protect the molten charge from getting oxidized, as recommended by FOSECO for non-ferrous metals and alloys. Degassing is done by adding Hexa-chloro-ethane tablets (C2Cl6) to the molten metal which liberates stable chlorine gas as shown in the equation 1; chlorine gas flushes hydrogen by creating partial pressure in molten metal. Equation 2 represents the absorption of hydrogen gas in the molten aluminium during melting. The hydrogen gas liberated in the reaction occupies the interstitial spaces of metal leading to porosity if not removed [12].
|
C2Cl6 → 2C+3Cl2 ↑ |
(1) |
|
2Al+3H2O → Al2O3+6H ↑ |
(2) |
Temperature Measurement is done using thermocouples, Digital Temperature Indicator (DTI) and by using IR-gun (Non-contact type with digital indicator). Moulds are poured at 690°C, 720°C, and 750°C for holding time of 2, 4 and 6 minutes as per the experimental plan. After solidification, fettling and cleaning is done to get the test castings.
Percentage porosity is calculated for all the castings by using the expression (3) and Table 5 represents the results of calculations [14]:
|
%Porosity =
100 |
(3) |

where, WS Dry weight of the casting, WSb Bouyant weight of casting + Basket weight, Wb Bouyant weight of basket, ρL Density of liquid, ρth Theoritical value of porosity free density of the alloy.
Analyzing and verifying the experimental results
The results obtained as per the experimental plan are listed in Table 5.
Table 5. Experimental results
|
Expt. No. |
P.T. A (oC) |
AoD. B (%) |
H.T. C (min.) |
ToM. D |
Ws |
Wsb-Wb |
Avg. % Porosity |
||
|
S1 |
S2 |
S1 |
S2 |
||||||
|
1 |
690 |
0.5 |
2 |
SS |
102.2 |
103.0 |
62.4 |
62.8 |
4.291 |
|
2 |
690 |
1 |
4 |
DS |
104.8 |
105.2 |
65.2 |
65.6 |
1.082 |
|
3 |
690 |
1.5 |
6 |
AS |
103.6 |
105.8 |
64.0 |
65.2 |
2.575 |
|
4 |
720 |
0.5 |
4 |
AS |
101.8 |
100.8 |
62.2 |
61.4 |
4.328 |
|
5 |
720 |
1 |
6 |
SS |
103.6 |
106.2 |
64.2 |
65.6 |
2.164 |
|
6 |
720 |
1.5 |
2 |
DS |
106.0 |
104.0 |
65.4 |
64.2 |
2.537 |
|
7 |
750 |
0.5 |
6 |
DS |
100.8 |
103.6 |
61.4 |
63.0 |
4.664 |
|
8 |
750 |
1 |
2 |
AS |
104.0 |
104.6 |
64.4 |
64.8 |
1.978 |
|
9 |
750 |
1.5 |
4 |
SS |
102.6 |
101.8 |
63.2 |
62.6 |
2.985 |
|
|
Total |
26.604 |
|||||||
For smaller the better S/N ratio is
S/N = -10log10![]()
where: n trail number, i - experiment number, y response. S/N ratio values for all the nine experiments are calculated using above expression and obtained values are shown in Table 6.
The average value of % porosity and S/N ratio is calculated for each factor and level. Sample S/N ratio calculations are as follows:
S/NA,1 =Average S/N ratio for factor A at level 1
S/NA,1 = (Y1+Y2+Y3)/3 = (-12.651-0.685-8.214)/3 = -7.184
Similarly the average % porosity and S/N values are calculated for each factor at each level and tabulated as shown in the Table 7.
Table 6. % Porosity and S/N ratio values
|
Expt.No. |
A |
B |
C |
D |
% Porosity |
S/N Ratio for % Porosity |
|
1 |
1 |
1 |
1 |
1 |
4.29104 |
-12.651 |
|
2 |
1 |
2 |
2 |
2 |
1.08209 |
-0.685 |
|
3 |
1 |
3 |
3 |
3 |
2.57463 |
-8.214 |
|
4 |
2 |
1 |
2 |
3 |
4.32836 |
-12.726 |
|
5 |
2 |
2 |
3 |
1 |
2.16418 |
-6.706 |
|
6 |
2 |
3 |
1 |
2 |
2.53731 |
-8.087 |
|
7 |
3 |
1 |
3 |
2 |
4.66418 |
-13.375 |
|
8 |
3 |
2 |
1 |
3 |
1.97761 |
-5.923 |
|
9 |
3 |
3 |
2 |
1 |
2.98507 |
-9.499 |
Table 7. Response table for average % Porosity and S/N ratio
|
Factors |
Pouring temp. |
Amt. of degasser |
Holding time |
Type of mould |
||||
|
Levels |
% Porosity |
S/N ratio |
% Porosity |
S/N ratio |
% Porosity |
S/N ratio |
% Porosity |
S/N ratio |
|
1 |
2.649 |
-7.184 |
4.428 |
-12.918 |
2.935 |
-8.887 |
2.960 |
-8.955 |
|
2 |
3.010 |
-9.173 |
1.741 |
-4.438 |
2.799 |
-7.637 |
2.761 |
-7.383 |
|
3 |
3.209 |
-9.599 |
2.699 |
-8.600 |
3.134 |
-9.432 |
3.147 |
-9.619 |
|
Max-Min |
0.560 |
2.416 |
2.687 |
8.480 |
0.336 |
1.795 |
0.386 |
2.236 |
|
Rank |
2 |
1 |
4 |
3 |
||||
|
Optimum level |
A1 |
B2 |
C2 |
D2 |
||||
From response Table 7, the response curves are drawn for % Porosity and S/N ratio and represented as shown in the Figure 3 and Figure 4 respectively.
ANOVA calculations
From the table of experimental results,
¸ N= number of experiments = 9
¸ Total Degrees of freedom (DOF) = N-1 = 9-1 = 8
¸ T = Sum of the response = y1+ y2+ y3+----- + y9 = 26.604
¸ Correction factor: C.F. = T2/N = 26.6042/9 = 78.641424
¸ A1= Total of experimental data for factor A at level 1
¸ A1= y1+ y2+ y3= 7.948
Similarly A2, A3, B1, B2, B3, C1, C2, C3 and D1, D2, D3 are calculated tabulated as shown in the Table 8.
Table 8. Level Total for % Porosity
|
Factors |
Code |
Level 1 |
Level 2 |
Level 3 |
|
Pouring temperature |
A |
7.948 |
9.029 |
9.627 |
|
Amount of degasser |
B |
13.283 |
5.224 |
8.097 |
|
Holding time |
C |
8.806 |
8.395 |
9.403 |
|
Type of mould |
D |
9.440 |
8.283 |
8.881 |
SA = Sum of squares of A, SA =  = 0.4828 where
 ![]()
Total Sum of Square, ST = ![]()
In this case, since there are no empty columns or repetitions, experimental and repetition error cannot be calculated. Pooling the smallest variance factors C and D would provide some information in error so as to proceed with the construction of ANOVA Table.
¸ Se = Sum of square of pooled error, Se = SC + SD = 0.3944
¸ VA= Variance of A, VA = SA/(DOF of A) = 0.4828/2 = 0.2414
¸ F - ratio for A, F = VA/Ve = 2.448
¸ S'A = Pure variation of A, SA' = SA - (DOF of A)·Ve = 0.2856
¸ PA% = Percentage contribution of factor A, PA% = (S'A/ST)·100 = 2.38%
All the results of ANOVA for % Porosity are tabulated and are represented in the Table 9.
Table 9. ANOVA table for % Porosity
|
Source |
S |
DOF |
Variance |
F-ratio |
S' |
P% |
|
A |
0.4828 |
2 |
0.2414 |
2.448 |
0.2856 |
2.38 |
|
B |
11.1218 |
2 |
5.5609 |
56.398 |
10.9246 |
91.05 |
|
C |
0.1712 |
2 |
0.0856 |
- |
- |
- |
|
D |
0.2232 |
2 |
0.1116 |
- |
- |
- |
|
Pooled error |
0.3944 |
4 |
0.0986 |
1.000 |
0.7888 |
6.57 |
|
Total |
11.9991 |
8 |
- |
- |
11.999 |
100.00 |
From the ANOVA table, F-ratio for amount of degasser is greater than F-critical value, which is 18 at 0.01 level of significance (from F-distribution table). This makes it the significant factor.
In order to estimate the % porosity using significant factors at their optimum levels, the process estimate equation and confidence intervals are calculated.
Estimation of predicted mean and confidence interval
Considering only significant factors and leaving insignificant, the predicted mean (µ) for % porosity is written as:
μ%Porosity = ![]() = 1.741
+ 2.649 - 2.956 = 1.434 ± C.I.
= 1.741
+ 2.649 - 2.956 = 1.434 ± C.I.
Confidence Interval (C.I.) of the predicted mean is calculated as:
C.I. =  , where
Ve = Variance of error and n/ne = degrees of freedom of
factors within in process estimate equation +1 for (CF).
, where
Ve = Variance of error and n/ne = degrees of freedom of
factors within in process estimate equation +1 for (CF).
It results C.I = ![]() and
μ%Porosity = 1.434 ± 0.993.
and
μ%Porosity = 1.434 ± 0.993.
Therefore, at 0.01 level of significance μ%Porosity varies from 0.441% to 2.427%.
Results
Following are the response curves (or linear graphs) drawn from the values of mean % Porosity and S/N ratio given in Table 7. The mean response refers to the average value of performance characteristic for each factor at different levels.
The average values of % porosity for each parameter at levels 1, 2 and 3 are calculated and represented in the Table 7 and these values are plotted in the Figure 3.
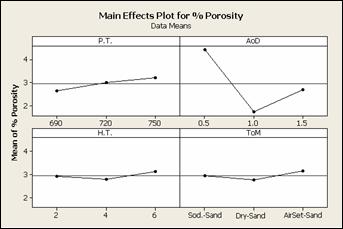
Figure 3. Effect of process variables on % Porosity
It is clear from the plots of Figure 3 that % porosity is minimum at first level of pouring temperature i.e.; at 690°C, second level of amount of degasser i.e.; at 1% of metal used, at second level of holding time i.e.; 4 minutes and second level of type of mould i.e.; in dry sand mould. The S/N ratio responses for each parameter at levels 1, 2 and 3 as calculated in Table 7 are represented in the Figure 4. As % porosity is considered to be the smaller-the-better type of quality characteristics, hence the objective function is to be maximized. Therefore the optimum levels of process parameters from the linear graphs of Figure 4 are pouring temperature 690°C, amount of degasser 1% of metal used, holding time 4 minutes and type of mould is dry sand mould.
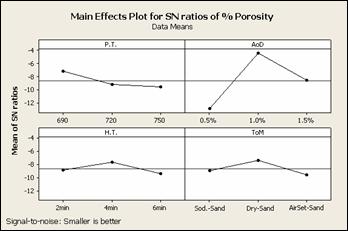
Figure 4. Effect of process variables on S/N ratio
Results of percentage contribution of factors from ANOVA Table 9 are represented in the form of pie chart shown in the Figure 5.
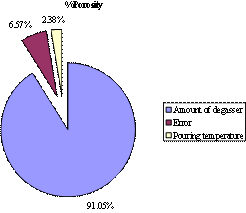
Figure 5. Percentage contribution of factors
It is observed that Amount of Degasser is the major contributing factor among the selected factors for reducing porosity in aluminum alloy sand mould castings.
Results of confirmation test
Confirmation experiment is conducted based on the optimum level of process parameters and the results obtained are tabulated in Table 10.
Table 10. Results of confirmation experiment based on optimum level process parameters
|
Experiment |
Ws |
Wsb - Wb |
% Porosity |
Error |
|
Sample 1 |
104.6 |
65.1 |
1.190 |
0.243 |
|
Sample 2 |
105.2 |
65.5 |
1.127 |
0.307 |
|
Total Average |
1.158% |
0.275 |
||
Optimum level of process parameters are:
¸ Pouring Temperature: 690°C
¸ Amount of Degasser: 1 %
¸ Holding Time: 4 minutes
¸ Type of Mould: Dry sand mould.
Discussion
The experiments conducted have shown influence of selected process parameters on % Porosity of aluminium alloy sand casting. The optimum level of process parameters obtained are: Pouring temperature 690°C, Amount of degasser 1% of the amount of metal, Holding time 4 minutes, and Type of mould Dry sand mould. Amount of degasser is the most significant control factors among the selected factors and is the major contributing factor for reducing porosity in Al-Si alloy castings.
This may be due to the fact that porosity is an effect of hydrogen gas dissolved in the molten metal and degassing process is performed to flush the dissolved hydrogen from the metal. If the amount of degasser is not sufficient enough to flush the hydrogen completely, the defect porosity occurs. On the contrary if it is in excess, the extra amount of degasser gets burnt and floats on the top of the molten metal and the metal has to be skimmed again. This may become a reason for the formation of biofilms which imparts porosity in the castings again. Hence the amount of degasser used should be optimum. From this study it is observed that the optimum level of degasser is 1% of the amount of metal used for melting, any increase or decrease in the amount increases the defect porosity.
Confirmation test conducted based on optimum level of process parameters shows that the values of % Porosity is 1.158%, and is found to be within the confidence level i.e.; 0.441 < % Porosity <2.427. By optimizing the sand mould and melting parameters, % Porosity of aluminum alloy castings produced by sand mould casting process is found to be decreased from 4.664% to 1.158%.
This study shows the practical approach to improve the quality of produced castings rather than inspecting the quality of the castings. The quality has to be designed into the product and is not to be inspected into it, as the inspection does not improve the quality nor it guarantees the quality [15]. In this study only the tablet degassing method is considered, there are also other methods of degassing such as rotary degassing, ultrasonic degassing, vacuum degassing, Argon gas method, etc. which can be considered for further studies.
Conclusions
From the results of this investigation it is concluded that the application of Taguchi method to sand mould casting process improve the productivity of the castings by reducing the rejections caused due to the defect porosity and increases the stability of the casting process by setting the parameters to their appropriate level. The quality is improved by reducing the % porosity from 4.664% to 1.158%, in aluminum alloy castings produced by sand moulding methods, and this will be without any added investment.
Acknowledgements
Authors thanks are due to Dr. Basheer Ahmed, Director, Muffakham Jah College of Engineering and Technology, Banjarahills, Hyderabad, for his constant support and encouragement in carrying out this research work.
Thanks are also to Mohd Zaheeruddin and Syed Khadar for their excellent technical assistance in conducting experimentation, without which this research work would not have been possible.
References
1. 48th Census of World Casting Production, Modern Casting, 2014.
2. Browm J. R., Foseco Non-Ferrous Foundrymans Handbook, Butterworth-Heinemann, Eleventh edition, 1999.
3. Kiyoung K., Kyongwhoan L., Effect of process parameters on porosity in aluminum lost foam process, Journal of Materials Science & Technology, 2005, 21(5), p 681-686.
4. Sabau A. S., Viswanathan S., Microporosity prediction in aluminum alloy castings, Metallurgical and Materials Transactions B, 2002, 33 (2), p. 243-255.
5. Omer Savas, Ramazan Kayikci, Application of Taguchis methods to investigate some factors affecting microporosity formation in A360 Aluminium alloy casting, Materials and Design, 2007, 28, p. 2224-2228.
6. Viquar Mohiuddin M., Krishnaiah A., Ferhathullah Hussainy S., Influence of Sand Molding Process Parameters on Product Quality of Al-Si Alloy Casting - An ANOVA Approach, International Journal of Advance Research In Science and Engineering, 2015, 4 (1), p. 1751-1760.
7. Wasiu Ajibola Ayoola, Samson Oluropo Adeosun, Olujide Samuel Sanni, Akinlabi Oyetunji, Effect of Casting Mould On Mechanical Properties of 6063 Aluminum Alloy, Journal of Engineering Science and Technology, 2012, 7(1), p.89 - 96.
8. Abdulkabir Raji, A Comparative Analysis of Grain Size and Mech. Properties of Al-Si Alloy Components Produced by Diff. Casting Methods, AU Journal of Technology, 2010, 13(3), p. 158-164.
9. Guharaja S., Nootul Haq A., Karuppannan K. M., Optimization of green sand casting process parameters by using Taguchis method, International Journal of Advance Manufacturing Technology, 2006, 30 p. 1040-1048.
10. John O. Oji, Buliamin Kareem, and Nosa Idusuyi, Effects of mould and pouring temperatures on the Ultimate tensile strength of Aluminium alloy sand castings: An ANOVA approach, Leonardo Electric Journal of Practices and Technologies, 2011, 19, p. 97-108.
11. Sudhir Kumar, Pradeep Kumar, H.S. Shan, Optimization of tensile properties of evaporative pattern casting process through Taguchi's method, Journal of Materials Processing Technology, 2008, 204, p. 59-69.
12. Viquar Mohiuddin M., Ferhathullah Hussainy S., Krishnaiah A., Laxminarayana P., Sundarrajan S., Experimental Study of Sand Mold Process Parameters on Al-Alloy Sand Casting using DoE, ISOR Journal of Mechanical and Civil Engineering, 2014, 11(6), p.1-6.
13. Mekonnen Liben Nekere, Ajit Pal Singh, Optimization of aluminium blanks sand casting for process by using Taguchi Robust Design Method, International Journal for Quality research, 2012, 6 (1), p. 81-97.
14. Murat Lus H., Effect of casting parameters on the microstructure and mechanical properties of squeeze cast A380 aluminum die cast alloy, Kovove Mater, 2012, 50, p. 243-250.
15. Edwards Deming W., Out of the Crisis, The MIT Press, 2nd ed. 1986, p. 29.