Development of a diagnostic schedule for a defective LC-195V5 CNC milling machine using PERT
Oluwole Olayinka AGBOOLA 1,*, Bulihameen KAREEM 2, and Basil Olufemi AKINNULI 1
1 Landmark University, Omu Aran, Kwara State, Nigeria
2 Federal University of Technology Akure, Nigeria
E-mails: 1omegawole@gmail.com; 3ifembola@yahoo.com
* Corresponding author, phone: +2348035411976
Received: April 17, 2016 / Accepted: July 17, 2016 / Published: July 31, 2016
Abstract
Computer Numerical Control CNC machine tools usage are more and more extensive, its fault diagnosis research is becoming more essential. Failure forms accorded these machines are diversified, and fault reasons are very complicated. It should not be left unattended to, because this could lead to further deterioration. One of the parameters used in determining the efficiency of a technician (who repairs machine tools) is the time saved in locating faults, hence the development of a diagnostic schedule which shows the sequential means of troubleshooting within a possible shortest time. In this research two approaches were used to diagnose a defective LC-195V5 CNC milling machine. Forward Pass (FP), which involves the diagnosis from electrical parts through Computer (CNC) to mechanical component and Backward Pass (BP) which involves the diagnosis from computer component through electrical parts to mechanical parts. Three different trials were conducted for each of the mode of diagnosis and the time to diagnose each component part was recorded. Based on the interrelationship of the component parts, two separate PERT (Project Evaluation & Review Techniques) network diagrams were drawn and their Critical Paths were determined. The study reveals that Foward Pass method was able to save more time.
Keywords
Diagnostic schedule; CNC (Computer Numerical Control) machine; Defective; Workshop; PERT (Project Evaluation and Review Techniques)
Introduction
Nowadays, great efforts have been given to the development of an Advanced Manufacturing Technology and Computer Numerical Control CNC equipment worldwide to improve the ease of manufacturing activities, which is seen as an important way to accelerate economic development and improve national power and status. CNC system can be called the soul and brain of Advanced Manufacturing Technology [1]. Its failure rate and reliability has become a significant factor restricting the development of advanced manufacturing technology and equipment.
According to the fault modes, the faults of CNC system can be classified into two kinds [2]: hard fault and soft fault. Hard fault can also be called catastrophic fault [3] which is a structural damage usually referring to the short circuit or open circuit of an element. Characteristic of this kind of fault is the parameter of the product change to extreme bounds. Soft fault can also be called deviation fault which means the faulty element deviates from its nominal value without reaching extreme bounds [4]. This will cause chaos of the module data and make CNC system stop responding. In most of the cases, it will not result in the total failure of the system but may cause degradation and deviation of system performance.
As for soft fault, though it is hard to predict and repeat manually during maintenance and repair, its impact can be profound. If CNC manufacturers ignore this kind of fault, CNC system may have a higher return rate, reduced customer confidence and increased potential safety hazards. According to the definition and phenomenon observed from usual process, four features can be summarized of soft fault [5]: trouble-not-identified (TNI), can-not duplicate (CND), no-trouble-found (NTF), and retest OK (RTOK). Be it a soft or hard fault, it is pertinent to have an orderly sequence of diagnosis so as to establish a diagnostic schedule that gives information about the maximum expected duration for the diagnosis. Research effort focusing on the development of a diagnostic schedule will not only provide a means of diagnosing a machine (LC-195V5 CNC Machine) at the FUTA Mechanical Central Workshop but also make available the essential information on the sequence of diagnosis as related to the maximum expected time allocated to each diagnostic exercise.
The aim of this study is to test, diagnose the faulty components of a defective LC-195V5 CNC machine at FUTA central workshop while the specific objectives are to: determine the sequential relationship of the interrelated parts, to determine the estimated expected time of diagnosis and to and develop an optimal diagnostic schedule. Numerical control of a machine tool is the automatic control of its operation under a program expressed in numbers or symbols which determine values and kind of displacement of machine’s operative members [6].
According to [7], a machine tool is defective if it is malfunctioning and therefore cannot perform its expected roles effectively. Recognizing the losses to be encountered if this is not corrected on time, machine tools are tested on regular basis so as to make necessary diagnosis. Typically, when a fault occurs, about 80% of downtime is spent locating its source and only about 20% is spent on the repair [8]. Thus, the diagnosis of operational faults is a major problem for maintenance personnel at workshop level.
Diagnosis of faults requires a logical and disciplined approach. Frequently, past experience or detailed knowledge will help. Also an intuitive approach can be used but must be accompanied by a deductive technique [9]. Faults can be classified as: Positive fault (sustained fault), Intermittent fault (irregular, harder to find). Ability to diagnose and repair faults largely depends on levels of documentation and test results. Facilities for testing equipment are often limited. However it is desirable that machine/plant users specify (when able to) what is required to make the system maintainable by means of diagnostic methods [9, 10]. The fundamental steps in the logical diagnostic process for all type of equipment are: Symptom analysis, Equipment inspection, Fault stage location, Circuit checks, Repair or replace, and Perform test.
The art of scheduling began with the development of the Bar chart, often called a Gantt chart, approximately 80 years ago [11]. Schedule is a time-phased plan to perform the work that is necessary to complete a project. There are great and poor schedules [12]. Several scheduling techniques exist in the construction industry, however, the most commonly encountered are Gantt charts and Network-based Critical Path Method (CPM) schedule [13]. Regardless of the type though, schedules are designed to establish the sequential order in which task is to be completed. To accomplish this, an intimate knowledge of work methods combined with an ability to visualize discrete work elements and effectively involve all key parties of the team is essential [14].
Material and method
The logical diagnostic process is shown in Figure 1.
Figure 1. Diagnostic process flow chart (Chisholm Institute, 2004)
CNC Machine tools Controller (e.g ANILAM, FANUC) are pre-installed with diagnostic solution that can only give information about fault associated with operational procedures [10]. Based on these facts, the following diagnostic approaches are highlighted:
i. Fault diagnosis according to the Alarm
ii. Fault diagnosis according to the Principle of Control of Object
iii. Fault diagnosis according to I/O status of the PLC
iv. Fault diagnosis through PLC Ladder graph
In undertaking this project, Stopwatch, Magnifying glass, Oscilloscope, Signal generator, multi-meter, line tester, transistor logic tester, RCL tester, Neon tester etc was used to identify the functioning components from malfunctioning parts. Operational manual of the Controller (ANILAM 1100M) of LC-195V5 CNC Machine was carefully examined and studied. Having studied the principle of operation of the machine using the operation manual, the machine was tested to ascertain its effectiveness. After the tests, the machine was found to be faulty then steps were taking to diagnose the faults. The faults were categorized into two main classes- Electrical faults and CNC faults (computer parts). Though the two major faults were identified but they both linked to the Machine tool itself (which could also have some mechanical fault; though rarely occur). For better and clear analysis, the schematic diagram of the LC- 195V5 CNC milling machine is as shown in Figure 2.
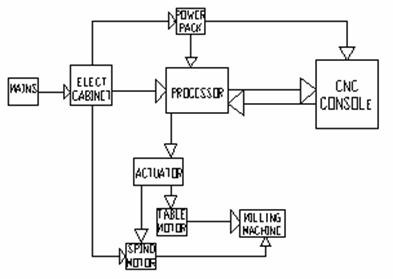
Figure 2. LC-195V5 CNC milling machine system power flow description
Electrical power enters from the mains into the CNC Milling machine through the electrical cabinet. The power is then distributed to both table and spindle motors as well as the power pack. Processor which is the main brain of the system gets its power from the power pack. CNC Console is connected to both power pack and the processor to get power and to exchange information respectively. Whatever command given to the system through the CNC Console is sent to the processor for the processor to interpret it and sends the signal to the actuator to activate the machine with respect to the command given.
Mode of diagnostic schedules
In diagnosing this CNC milling machine, two broad modes or methods employed were:
i. Diagnosis schedule starting from the Electrical Components(Forward Pass)
ii. Diagnosis schedule starting from the Computer (CNC) parts(Backward Pass)
Three levels of experts were used in establishing the expected diagnostic times. Two other consultants/engineers were collaborated with during the course of this research. They are maintenance experts from Prototype Engineering Development Institute (PEDI), Ilesha and Computer experts from Computer Resource Centre (CRC), FUTA.
Diagnosis schedule starting from electrical components- forward pass
The diagnosis started from the Electrical Mains to Electrical Cabinet to Power Pack to range through the Processor and the CNC Console. This method was first chosen to ensure that there was electrical power supply to the machine. This method is termed as Experiment I.
Experiment I
The purpose of this experiment is to check whether the exact location of the fault can be identified by starting from the root to the roof. This involved the diagnosis of the following component parts in the orderly manner as well as the time spent (in seconds) for diagnosis.
The time spent in carrying out the experiment I stated above was tabulated as shown in table 1
Table 1. Time estimate for first mode of diagnosis (Forward Pass)
|
S/N |
Diagnosed Parts |
Time Duration (seconds) |
||
|
1st Trial 'a' |
2nd Trial 'm' |
3rd Trial 'b' |
||
|
1 |
Testing and diagnosis of the Electrical mains |
698 |
720 |
732 |
|
2 |
Checking of the Electrical cabinet of the machine |
1265 |
1306 |
1329 |
|
3 |
Checking, testing and the diagnosis of the spindle motor |
1226 |
1265 |
1287 |
|
4 |
Checking, testing and the diagnosis of the table motor |
1043 |
1077 |
1096 |
|
5 |
Testing of the Actuator |
1037 |
1070 |
1089 |
|
6 |
Diagnosis of the Processor |
1103 |
1141 |
1160 |
|
7 |
Checking, testing and diagnosis of the power Pack |
1618 |
1671 |
1701 |
|
8 |
Checking of the CNC Console |
1229 |
1259 |
1282 |
|
9 |
Testing of the coolant sensor |
2261 |
2341 |
2381 |
|
10 |
Mechanical check of the machine |
1977 |
2037 |
2076 |
The above information (Table 1) was used to calculate the expected time of diagnosis of each part using equation 1 and 2:
|
C = (Ci-Cj)/2 + 2kn/19 |
(1) |
|
Standard Deviation σ = |
(2) |
where, “a” is the diagnostic time as recorded from the first trial, “m” is the diagnostic time as recorded from the second trial, “b” is the diagnostic time as recorded from the third trial [15].
The expected time for each diagnosed component are summarized in the Table 2.
Table 2. Estimated expected time and standard deviation for the first method of diagnosis (Forward Pass)
|
Diagnosed Parts |
Time 'a' |
Time 'm' |
Time 'b' |
Expected Time |
Standard Deviation |
|
Testing and diagnosis of the Electrical mains |
698 |
720 |
732 |
718.33 |
5.67 |
|
Checking of the Electrical cabinet of the machine |
1265 |
1306 |
1329 |
1303 |
10.67 |
|
Checking, testing and the diagnosis of the spindle motor |
1226 |
1265 |
1287 |
1262.17 |
10.17 |
|
Checking, testing and the diagnosis of the table motor |
1043 |
1077 |
1096 |
1074.5 |
8.83 |
|
Testing of the Actuator |
1037 |
1070 |
1089 |
1067.67 |
8.67 |
|
Diagnosis of the Processor |
1103 |
1141 |
1160 |
1137.83 |
9.5 |
|
Checking, testing and diagnosis of the power Pack |
1618 |
1671 |
1701 |
1667.17 |
13.83 |
|
Checking of the CNC Console |
1229 |
1259 |
1282 |
1257.83 |
8.82 |
|
Testing of the coolant sensor |
2261 |
2341 |
2381 |
2334.33 |
20 |
|
Mechanical check of the machine |
1977 |
2037 |
2076 |
2033.5 |
16.5 |
Diagnosis schedule starting from the computer parts- backward pass
The second method employed was to diagnose from the CNC Console through the Electrical and mechanical parts. Instead of starting from the electrical parts, the computer components were first diagnosed and moved gradually towards other parts.
This second method was termed as an Experiment II and the sequential order of the diagnosis as implemented for the study were as tabulated in Table 3.
Experiment II
Experiment II was similar to Experiment I in term of method of diagnosis except that the diagnosis started from the computer parts towards electrical parts to mechanical parts. The only difference between Experiment I and II was the approach of the sequence of diagnosis.
Table 3. Time estimate for second mode of diagnosis (Backward Pass)
|
S/N |
Diagnosed Parts |
Time Duration (seconds) |
||
|
1st Trial 'a' |
2nd Trial 'm' |
3rd Trial 'b' |
||
|
1 |
Testing and diagnosis of the Electrical mains |
1867 |
1928 |
1962 |
|
2 |
Checking of the Electrical cabinet of the machine |
1511 |
1563 |
1589 |
|
3 |
Checking, testing and the diagnosis of the spindle motor |
1162 |
1202 |
1223 |
|
4 |
Checking, testing and the diagnosis of the table motor |
2799 |
2897 |
2948 |
|
5 |
Testing of the Actuator |
2439 |
2520 |
2567 |
|
6 |
Diagnosis of the Processor |
1561 |
1613 |
1648 |
|
7 |
Checking, testing and diagnosis of the power Pack |
1273 |
1331 |
1356 |
|
8 |
Checking of the CNC Console |
2046 |
2099 |
2145 |
As earlier done for the First mode of diagnosis, the expected time was calculated for each diagnosed part and summarized in the Table 4.
Table 4. Estimated Expected time and Standard Deviation for the second method of Diagnosis (Backward Pass)
|
Diagnosed Parts |
Time 'a' |
Time 'm' |
Time 'b' |
Expected |
Standard Deviation |
|
Checking and diagnosis of the CNC Console |
1867 |
1928 |
1962 |
1923.5 |
15.83 |
|
Testing and diagnosis of the Processor |
1511 |
1563 |
1589 |
1558.67 |
13.00 |
|
Checking and testing of the Actuator |
1162 |
1202 |
1223 |
1198.83 |
10.17 |
|
Checking, testing, diagnosis & repair of the Power pack |
2799 |
2897 |
2948 |
2889.17 |
24.83 |
|
Checking of the Electrical Cabinet |
2439 |
2520 |
2567 |
2514.33 |
21.33 |
|
Testing and checking of the Spindle motor |
1561 |
1613 |
1648 |
1610.20 |
14.50 |
|
Testing and checking of the Table motor |
1273 |
1331 |
1356 |
1325.50 |
13.83 |
|
Diagnosis for the mechanical fault |
2046 |
2099 |
2145 |
2097.83 |
16.50 |
Forward pass diagnostic scheduling analysis
The Expected time estimated in Table 2 was analyzed using Network diagram as shown in Figure 3.
Figure 3. PERT diagram obtained from the estimated expected time for the forward pass
The first sequence of operation was the diagnosis of the Electrical mains which was completed before testing the Electrical cabinet. The next three operations were the checking and diagnosis of the Table motor, Spindle motor and Actuator which were done simultaneously. The sixth stage was to diagnose the processor before moving on to the diagnosis of the Power Pack and CNC Console as the seventh and eight stages respectively. Testing and diagnosis of the CNC machine for mechanical faults were done as the last stage.
Analysis from the backward pass method
The Estimated Expected time in Table 4 was also analyzed using Network diagram as shown in Figure 4.
Figure 4. PERT diagram obtained from the estimated expected time for the backward pass
It was observed that the first sequence of the operation was the diagnosis of the CNC Console which was completed before testing the Processor. The next two operations were the checking and diagnosis of the Actuator and Power Pack which were done simultaneously. The fifth stage was to diagnose the Electrical cabinet before moving on to the diagnosis of the Spindle motor and Table motor as the sixth and seventh stages respectively. Testing and diagnosis of the CNC machine for mechanical faults were done at the last stage.
Results and discussion
The network diagram in Figure 3 for the Forward Pass is given in Table 5.
Table 5. Analytical table for the Forward Pass method (Slack = LS-ES or LF-EF)
|
Activity |
Duration (seconds) |
Earliest Start ES |
Earliest Finish EF |
Latest Start LS |
Latest Finish LF |
Slack |
Standard Deviation |
|
0 – 1 |
718.33 |
0 |
718.3 |
0 |
718.3 |
0 |
5.7 |
|
1 – 2 |
1303 |
718.3 |
2021.3 |
718.33 |
2021.3 |
0 |
10.7 |
|
2 – 3 |
1262.17 |
2021.3 |
3283.5 |
4570.5 |
5832.7 |
2549.2 |
10.2 |
|
2 – 4 |
1074.5 |
2021.3 |
3095.8 |
2543.9 |
3618.4 |
522.6 |
8.8 |
|
2 – 5 |
1067.67 |
2021.3 |
3089 |
2021.3 |
3089 |
0 |
8.7 |
|
4 – 6 |
1137.83 |
3095.8 |
4233.6 |
3618.4 |
4756.2 |
522.6 |
9.5 |
|
5 – 6 |
1667.17 |
3089 |
4756.2 |
3089 |
4756.2 |
0 |
13.8 |
|
3 – 7 |
1257.83 |
3283.5 |
4541.3 |
5832.7 |
7090.5 |
2549.2 |
8.8 |
|
6 – 7 |
2334.33 |
4756.2 |
7090.5 |
4756.2 |
7090.5 |
0 |
20 |
|
7 – 8 |
2033.50 |
7090.5 |
9124 |
7090.5 |
9124 |
0 |
16.5 |
Any path with zero slack is known as Critical Path. Therefore the Critical Path for the information above is 0 – 1 – 2 – 5 - 6 – 7 – 8. Time along the Critical Path = 718.3+1303+1067.7+1667.2+2334.3+2033.5. Standard Deviation along the Critical Path = 5.7+10.7+8.7+13.8+20+16.5. Time along the critical path was 9124 seconds which is equivalent to 152mins 4seconds. Standard Deviation along the Critical Path was 75.4 seconds.
In the same manner, Figure 4 was also analyzed and the result is presented in Table 6.
Critical Path was 0 – 1 – 2 – 4 – 5 – 6 - 7 – 8. Time along the Critical Path = 1923.5+1558.7+2889.2+2514.3+1610.2+0+2097.8. Standard Deviation along the Critical Path = 15.83+13.0+24.83+21.33+13.83+0.0+16.5. Time along the Critical Path was 12593.7seconds (209 mins 54secs). Standard Deviation along the Critical Path was 105.32 seconds.
Table 6. Analytical table for the Backward Pass method
|
Activities |
Duration (seconds) |
Earliest Start ES |
Earliest Finish EF |
Latest Start LS |
Latest Finish LF |
Slack |
Standard Deviation |
|
0 – 1 |
1923.5 |
0 |
1923.5 |
0 |
1923.5 |
0 |
15.83 |
|
1 – 2 |
1558.67 |
1923.5 |
3482.2 |
1923.5 |
3482.2 |
0 |
13 |
|
2 – 3 |
1198.83 |
3482.2 |
4681 |
7686.9 |
8885.7 |
4204.7 |
10.17 |
|
2 – 4 |
2889.17 |
3482.2 |
6371.4 |
3482.2 |
6371.4 |
0 |
24.83 |
|
4 – 5 |
2514.33 |
6371.4 |
8885.7 |
6371.4 |
8885.7 |
0 |
21.33 |
|
3 – 5 |
0 |
4681 |
8885.7 |
4681 |
8885.7 |
0 |
0 |
|
Dummy |
|
|
|
|
|
|
|
|
5 – 6 |
1610.2 |
8885.7 |
10495.9 |
8885.7 |
10495.9 |
0 |
14.5 |
|
5 – 7 |
1325.5 |
8885.7 |
10211.2 |
9170.4 |
10495.9 |
284.7 |
13.83 |
|
6 – 7 |
0 |
10495.9 |
10495.9 |
10495.9 |
10495.9 |
0 |
0 |
|
Dummy |
|
|
|
|
|
|
|
|
7 – 8 |
2097.83 |
10495.9 |
12593.7 |
10495.9 |
12593.7 |
0 |
16.5 |
Comparison between the two methods using percentage completion
The Probability that the Diagnosis would be 1% completed for both the Forward Pass and the Backward Pass was found to be 149.15 minutes and 205.82 minutes Due time respectively.
Forward Pass: Expected time from the Critical Path is 152.067 minutes. Standard Deviation along the Critical Path is 1.257. Due time is 149.15 minutes. Z = -2.32 which corresponds to 1% on Normal Distribution Probabilities table.
Backward Pass: Expected time from the Critical Path is 209.895 minutes. Standard Deviation along the Critical Path is 1.755. Due time is 205.82 minutes. Z = -2.32 which corresponds to 1% on Normal Distribution Probabilities Table 7.
Comparison between the two methods using the time spent
It was observed that the critical time obtained from the two modes of diagnosis (Forward Pass and Backward Pass) were Nine thousand one hundred and twenty four seconds (9124 secs) and Twelve thousand five hundred and ninety four (12594 secs) respectively. It is evident from the analysis above that the first method saves time (3470 secs) compared to the second method.
Table 7. Percentage Completion table for Both Forward and Backward Pass
|
S/N |
Probability Percentage Completion, % |
Forward Pass |
Backward Pass |
||||
|
Expected Time (min) |
Standard Deviation (min) |
Due Time (min) |
Expected Time (min) |
Standard Deviation (min) |
Due Time (min) |
||
|
1 |
1 |
|
|
149.15 |
|
|
205.82 |
|
2 |
10 |
|
|
150.46 |
|
|
207.65 |
|
3 |
20 |
|
|
151.01 |
|
|
208.42 |
|
4 |
50 |
152.067 |
1.257 |
152.07 |
209.895 |
1.755 |
209.9 |
|
5 |
70 |
|
|
152.73 |
|
|
210.83 |
|
6 |
80 |
|
|
153.12 |
|
|
211.37 |
|
7 |
100 |
|
|
156.97 |
|
|
216.74 |
Also, from the Table 7 above, Probability of percentage completion at 50% gives 152.07 minutes and 209.90 minutes for the Forward and Backward Pass respectively. This shows the excess time of 57.83 minutes using the Forward Pass method. Even for all other percentage completion probabilities, Forward Pass saves considerable time compared to the Backward Pass. With all these facts, Foward Pass method was considered the most economical means that gives the optimal diagnostic schedule.
Conclusions
Three maintenance experts supported this research and the time each of them spent was recorded to establish a network diagram (PERT). Two approaches were employed; Forward Pass which involved diagnosis from electrical parts through computer parts and Backward Pass which involved diagnosis from computer parts through electrical parts. Analysis revealed that the forward pass gives the shortest possible time of completing the diagnosing (3470 s) and was therefore chosen as the economical means through which a diagnostic schedule was drawn.
PERT (Project Evaluation & Review Techniques) was chosen over Critical Path method CPM because PERT is Probabilistic while CPM is deterministic. Expected time is preferred due to the fact that the time spent by the experts in diagnostic exercise are considerably differs. It is only PERT that takes into consideration the variation in time since it involves three time estimate (The Optimistic time ‘a”, most likely “m”, and the Pessimistic time “b”).
References
1. Zhang E., Wang Y., Research on Reliability Growth and Reliability, Evaluation of CNC System. Jilin: China, 2011.
2. Bandler, J. W., Salama A. E., Fault diagnosis of analog circuits, Proceedings of the IEEE, 1985, 73(8), p. 1279-1325.
3. Qi H., Sanka G., Michael P., No-fault-found and intermittent failures in electronic products, Microelectronics Reliability, 2008, p. 663-674.
4. Zhou Land, Shi Y., Study on Soft Fault Diagnosis for Analog Circuits Using Intelligent Optimization, University of Electronic Science and Technology of China, Cheng Du, China, 2009.
5. Pecht M., Ramappan V., Are components still the major problem?: a review of electronic system and device field failure returns. IEEE Trans CHMT 15(6) 1160, 1992.
6. Nauka, Numerals Control Machine Tools (Chislaupravlyayutstankami), Moscow, 1967.
7. Li M., Diagnostic techniques for PC faults in automatic assembly line, Industrial Control Computer, 1993, 2, p. 9-12.
8. Kegg R. L., On-line machine and process diagnostics, Annals of the CIRP, 1984, 32(2), p. 469-473.
9. Chilsholm Institute, Fault finding and diagnostic skill, “Teaching Aid”, 2004, p. 9-13.
10. Anilam Operation manual., Three Axis 1100M Programming manual for CNC milling machine, 1997.
11. Ahuja H. N., Project Management, Techniques in Planning and Controlling Construction Projects, John Wiley and Sons Inc., New York, 1984.
12. Barrie D. S., Boyd C., Paulson Jr., Professional Construction Management, 3rdEdition, McGraw-Hill, Inc., New York, 1992.
13. Callahan M. T., Murray H., Construction Schedules: Analysis, Evaluation, and Interpretation of Schedules in Litigation, The Mitchie Company, Charlottesville, 1983.
14. Bramble B. B., Michael T., Callahan, Construction Delay Claims, 2ndEdition, John Wiley and Sons, Inc., New York, 1992.
15. Aderoba A. A., Engineering project management, Tools of Engineering management Vol., Besade Publishing, Ondo, 2008.