Microstructural study of pre-treated and enzymatic hydrolyzed bamboo
Funsho O. KOLAWOLE1*, Shola K. KOLAWOLE2, Chioma I. MADUEKE1,
Adeolu A. ADEDIRAN3, Malik ABDULWAHAB 4, Bello O. UMARU4
1 Department of Materials and Metallurgical Engineering, Federal University Oye-Ekiti, Nigeria
2 National Agency for Science and Engineering Infrastructure, Abuja, Nigeria
3 Mechanical Engineering Department, Landmark University, Omu Aran, Kwara State, Nigeria
4 Department of Metallurgical and Materials Engineering, Ahmadu Bello University, Zaria, Nigeria
E-mails: * fkopresido@yahoo.com; sholak109e@yahoo.com; chioma.madueke@fuoye.edu.ng;
dladesoji@yahoo.com; koladepj@yahoo.com; okatengwubello@yahoo.com
* Corresponding author, phone: +2347037567244
Received: March 22, 2016 / Accepted: July 17, 2016 / Published: July 31, 2016
Abstract
Bamboo was used as biomass feedstock which was pre-treated using dilute acid hydrolysis followed by enzymatic hydrolysis. The bamboo was mechanical ground to particle sizes 212–500µm, followed by pre-treatment with dilute sulfuric acid at a concentration of 0.5 and 1.0 (%v/v) at temperatures of 25, 110, 120, 150 and 200°C with time intervals of 2 and 4 hours. Pre-hydrolyzate was later analyzed for reducing sugar using UV-Vis spectrophotometry. Under the above conditions, a maximum glucose yield of 153.1 mg/g was obtained at 200°C and acid concentrations of 1% for 4 hours. Water insoluble solids obtained were subsequently hydrolyzed with Celluclast (Trichoderma reesi) and β-glucosidase (Novozyme 188) for 72 hours. Optical Microscope and ESEM images of bamboo samples were obtained at various stages of pre-treatment and enzymatic hydrolysis. Result reveals a breakdown in the ligno-cellulosic structure of the bamboo during exposure to dilute acid and enzymatic hydrolysis.
Keywords
Bamboo; Biomass; Enzymatic Hydrolysis; Microstructure; Pre-treatment
Introduction
Biofuels are also considered a renewable source of energy; although renewable energy is used mostly to generate electricity, it is often assumed that some form of renewable energy or a percentage is used to create alternative fuels. Biofuel is a type of fuel whose energy is derived from biological carbon fixation. Biofuels include fuels derived from biomass conversion, as well as solid biomass, liquid fuels and various biogases [1]. Similarly, fossil fuels also have their origin in ancient carbon fixation. Biofuels are gaining increased public and scientific attention, driven by factors such as oil price hikes, the need for increased energy security, concern over greenhouse gas emissions from fossil fuels, and support from government subsidies [1]. In 2010, the worldwide biofuel production reached 105 billion liters (28 billion gallons US), up 17% from 2009, and biofuels provided 2.7% of the world's fuels for road transport, a contribution largely made up of ethanol and biodiesel [2]. Global ethanol fuel production reached 86 billion liters (23 billion gallons US) in 2010, with the United States and Brazil as the world's top producers, accounting together for 90% of global production. The world's largest biodiesel producer is the European Union, accounting for 53% of all biodiesel production in 2010 [2]. As of 2011, mandates for blending biofuels exist in 31 countries at the national level and in 29 states/provinces [3]. According to the International Energy Agency, biofuels have the potential to meet more than a quarter of world demand for transportation fuels by 2050 [1].
Bamboo is one of the oldest building materials used by mankind [4,5]. The bamboo culm, or stem, has been made into an extended diversity of products ranging from domestic household products to industrial applications. The chemical composition of bamboo is similar to that of wood. The main constituents of bamboo culms are cellulose, hemi-cellulose and lignin, which amount to over 90% of the total mass. The minor constituents of bamboo are resins, tannins, waxes and inorganic salts. Compared with wood, however, bamboo has higher alkaline extractives, ash and silica contents [6]. Since the amount of each chemical composition of bamboo varies with age, height, and layers the chemical compositions of bamboo are correlated with its physical and mechanical properties. Such variation can lead to obvious physical and mechanical properties changes during the growth and maturation of bamboo. Bamboo is a potential biomass which has the tendency of producing reducing sugars and starch which can be fermented into ethanol or butanol [6].
The pre-treatment of feedstock is needed to break down the ligno-cellulosic matrix and optimize the overall conversion of biomass to fuel. Pre-treatment methods are designed to remove the lignin and hemicellulose, reduce cellulose crystallinity and increase the porosity of the material to allow for better access of enzymes. The ultimate goal is to improve the formation of sugars or availability to subsequently form sugars by hydrolysis, avoid degradation and loss of carbohydrates, and avoid formation of byproducts that inhibit subsequent hydrolysis and fermentation processes [2, 7, 8]. Pre-treatment techniques can be physical, chemical and biological [7, 8]. Since each technology has inherent advantages and disadvantages, there is no “winning” method for pre-treatment as of yet. Physical pre-treatment approaches include: steam explosion; hot water; mechanical grinding or milling and high energy radiation. Mechanical comminution disrupts cellulose crystallinity and increases the surface area of the biomass. However, it does not remove lignin [7, 8, 12]. Seldom used exclusively, mechanical techniques are time and energy intensive.
Enzymatic hydrolysis is influenced by both structural features of cellulose and the mode of enzyme action. Due to the complexity of the cellulose substrate and the cellulase system, the mechanism of hydrolysis of cellulose substrate is still not fully understood, although detailed knowledge of some aspects of enzyme structure, enzyme molecular properties and the ultrastructure of cellulose have been obtained through extensive study over the last few decades [10]. Enzymatic hydrolysis that converts ligno-cellulosic biomass to fermentable sugars may be the most complex step in the process due to substrate-related and enzyme-related effects and their interactions. Enzymatic hydrolysis offers the potential for higher yields, higher selectivity, lower energy cost and milder operating conditions than chemical processes, the mechanism of enzymatic hydrolysis and the relationship between the substrate structure and function of various glycosyl hydrolase components [10].
Pingali et al., (2010) [17] used small angle neutron scattering to examine the effects of dilute acid pretreatment on cell wall nanostructure. Their findings suggested that pretreatment times of 1 hour or longer at 160°C degrade the cellulose network and alter cell wall surfaces at the micrometer scale. Amanda (2012) [2] used Environmental SEM (ESEM) to study the structure of bamboo after dilute acid pretreatment. She also investigated the relationship between the sugar yields and the morphological changes in cell wall structure. Since sugar concentrations in pre-hydrolyzate corresponds to hydrolyzed hemicellulose, then it can be assumed that as the amount of solubilized glucose increases, so does the sample porosity.
This study examines the optical microscopy and SEM images of samples obtained after pre-treatment and enzymatic hydrolysis of bamboo, in order to have a better understanding of the morphology.
Material and method
Figure 1 presents an illustration for the biorefinery process that leads to the production of biofuel, power, heat and value added chemicals.
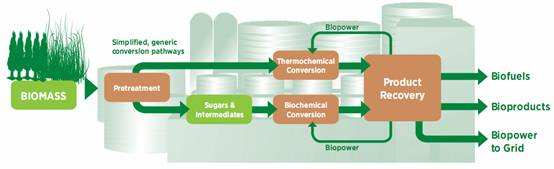
Figure 1. Integrated biorefinery processes of biomass into biofuels, bioproducts and biopower (US Department of Energy)
Raw materials
The Bamboo (Bambusa vulgaris) sample was obtained from A.K. Merchants & Co. Opposite Games Village, Along Airport Road, Abuja, Nigeria. Two commercially available enzymes were purchased from Sigma Aldrich: a cellulase cocktail from the fungi Trichoderma reesei (Celluclast 1.5L) and ß-glucosidase from Aspergillus niger (Novozym 188). All reagents were purchased from Sigma Aldrich, (3050 Spruce Street, St. Louis, MO 63103, USA) and Fisher (Fair Lawn, NJ, USA).
Materials preparation
The bamboo was cut into smaller pieces having a dimension of 15mm x 15mm x 5mm using a hack saw, followed by the use of a grit paper to ensure that the surface of the cut bamboo was flat and smooth and the chemical composition was determined using XRD which was carried out in the Sheda Science and Technology Complex, (SHESTCO), Abuja, Nigeria.
Dilute acid pre-treatment
Dilute sulfuric acid (0.5 and 1.0 % v/v) solutions were prepared, and acid solutions were added to 300mg samples of bamboo in 20 mL glass vials. The samples were heated and stirred at temperatures of 25, 110, 120, 150 and 200°C using an oven. The temperature was monitored using a bi-metallic thermometer. The samples were heated for durations of 2 and 4 hours. After heating, the samples were removed and allowed to cool to room temperature. The remaining solid was filtered and the insoluble solids were washed with deionized water until the pH of the wash was above 5.
Enzymatic hydrolysis
The washed and filtered biomass solid were then transferred to 125mL Erlenmeyer flasks. 10mL of 0.05M citrate buffer (pH 4.8) was added to the flasks along with 1.2mL of Cellulase and 0.3mL of ß-glucosidase. The samples were then incubated at 50°C for 72 hours on a New Brunswick Scientific incubator rotary shaker at a speed of 121 revolutions per minute (rpm). 1 mL of sample was collected for analysis.
Sugar assay
DNS (3,5-dinitrosalicylic acid) reagent was prepared at the Sheda Science and Technology Complex, (SHESTCO), Abuja, Nigeria. This was done by mixing 45gm of sodium potassium tartrate dissolved in 75mL of water and 1.5gm of DNS was dissolved in 30mL of 2M/L NaOH. Stock standard sugar (glucose) was prepared by dissolving 250mg of glucose in water and water was added until the volume reached 100mL and 10mL from the stock solution was taken. Seven clean, dry test tubes were taken and solutions of the standard sugar solution (glucose), ranging from 0 to 3mL were measured into different test tubes.
The volume was made up to 3mL with distilled water in all of the test tubes. 3mL of the filtrate (from both the pre-treatment and the enzymatic hydrolysis) were also placed into test tubes before adding 1mL of DNS reagent.
The test tubes were covered with cotton wool and kept in a boiling water bath for 10 minutes. The test tubes were then allowed to cool at room temperature, because the absorbance is sensitive to temperature and the extinction at 540nm against a blank sample, UV-Visible Spectrophotometer was used to measure the absorbance of the samples.
Microstructure of bamboo
Optical micrographs of the samples were used to study the morphological changes that occurred during pre-treatment and enzymatic hydrolysis. Imaging was performed with a Celestron digital optical microscope (Model #44345), David Hinds Ltd, Cherrycourt Way, Leighton Buzzard, Bedfordshire, LU7 4UH, U.K. Bamboo samples (before and after the pre-treatment stage) were allowed to dry and were all ground using 320 grit paper to the finial polishing stage of 600 grit.
ESEM micrographs of the samples were used to study the morphological changes that took place during pre-treatment and enzymatic hydrolysis. Imaging was performed with a FEI (Hillboro, OR) Quanta 200 FE-ESEM instrument under vacuum conditions. Bamboo samples were carefully attached to adhesive carbon tape and mounted on aluminum stubs. Micrographs were obtained at magnifications ranging from 500x to 950x depending on the features of interest in the sample, and surface charging on the samples rendered imaging difficult to take images at higher magnifications.
Results and discussion
Table 1 shows the material composition and chemical formulae of different compounds obtained from the un-pretreated bamboo sample using X-Ray Diffraction technique (see Figure 2).
Figure 2. XRD of Un-pretreated bamboo sample
The result obtained show different carbohydrates and compounds such as carbowax and starch. Most of the compounds were carbohydrates that contain cellulose in them, which made it possible to obtain glucose, after dilute acid pre-treatment and enzymatic hydrolysis.
Table 1. Material Composition of un-pretreated bamboo sample
|
S/No |
Material composition |
Chemical formula |
Percentage composition (%) |
|
1 |
D-Sorbitol (glucitol) |
C6H14O6 |
12.34 |
|
2 |
n-Docosane |
C22H46 |
10.47 |
|
3 |
Lithium Myristate |
LiC14H27O2 |
17.86 |
|
4 |
n-Nonacosane |
C29H60 |
47.66 |
|
5 |
Sexiphenyl |
C36H26 |
11.67 |
The experimental results of glucose yield obtained showed that temperature had a significant effect on pre-treatment and enzymatic hydrolysis of the bamboo as shown in Figure 3 to 7. Figure 3 and 4 shows the plots of glucose yield (mg/g) against temperature (°C) after dilute acid pre-treatment for 2hours and 4hours respectively.
Figure 3. Plot of Glucose Yield (mg/g) against Temperature (°C) after pre-treatment for 2hours
Figure 4. Plot of Glucose Yield (mg/g) against Temperature (°C) after pre-treatment for 4hours
It can be seen from the plot that as the temperature and acid concentration increases the glucose yield also increases too, during dilute acid pre-treatment, the hemicellulose was hydrolyzed to release solubilized sugars in the pre-hydrolyzate, while the cellulose and lignin remained mostly in the solid biomass. In contrast as observed in Figure 4, a decrease in sugar concentrations (over long time intervals) would have indicated the presence of side reactions that convert or degrade the sugars into alternate products (i.e. acids). A notable increase of solubilized glucose was observed in the 1% (v/v) 200°C sample. The initially low glucose levels correspond with the release of glucose present in the hemicellulose. This was more easily hydrolyzed due to the short branches and short lateral chains. After longer residence times, the pre-hydrolyzate liquor collected from the samples heated at 200°C continued to have increasing glucose yields. This suggests that, after the hemicellulose had been hydrolyzed, the cellulose began to break down into glucose as well.
Figure 5 shows a color change from yellow to orange as DNS reagent was used, indicating that the samples with more significant color change indicates the presence of higher concentration of reducing sugars.
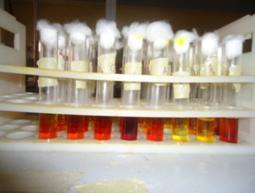
Figure 5. The use of DNS reagent to test for the presence of reducing sugars
An increase in glucose yield was also be observed in Figure 6 and 7 which shows the plots of glucose yield (mg/g) against temperature (°C) after enzymatic hydrolysis.
Figure 6. Plot of Glucose Yield (mg/g) against Temperature (°C) after enzymatic hydrolysis
Figure 7. Plot of Glucose Yield (mg/g) against Temperature (°C) after enzymatic hydrolysis
The glucose yields obtained in Figure 6 and 7 are much higher compared to those obtained in Figure 3 and Figure 4. Furthermore, a concern that arises in pre-treatment and hydrolysis techniques is that sugars can degrade to form undesired products. However, the results from this study showed that, as the residence time increased from 2 to 4 hours, the amount of glucose generally increased [2].
Based on the pre-treatment results showing that higher temperatures and acid concentrations lead to greater solubilized glucose, it was also expected that the glucose concentrations after enzymatic hydrolysis would follow similar trends. Indeed, the maximum glucose yield 153.1 mg/g was found for the samples pre-treated at 200°C.
In some cases, the hydrolyzates of the pre-treated bamboo had lower quantities of glucose than expected. This could simply be because of the presence of an inhibitor generated at higher pre-treatment temperature. It has been suggested in prior work by Donohoe et al., 2011[2] that at higher temperatures, the lignin can extrude from within the cell walls and form droplets on the surface of the material, which reduces the accessibility of the cellulose or the hydrolyzed cellulose gives rise to oligomers or that the glucose formed is subsequently degraded [18].
However, there was a continuous increase all through, the increase in glucose yields at higher temperature from 120°C and above, was as a result of the enzymes to access cellulose and hemicellulose after lignin has been broken down.
The increase in glucose yields here was as a result of pre-treatment, which provides the enzymes with more surface area of cellulose and hemicellulose after lignin has been removed.
Effects of dilute acid pretreatment on bamboo microstructure
The micrographs in Figure 8a depict the structure of the untreated bamboo samples and Figure 8b-f are the micrographs of samples that were treated with 0.5% v/v dilute sulfuric acid at 200°C. The cell walls comprise lignin, which gives the cells structural integrity [7]. Pre-treatments, using dilute sulfuric acid and heat, were able to remove the easily accessible hemicellulose and cellulose [7]. The following optical micrographs were observed for the pre-treated samples in dilute H2SO4 acid with different temperature, concentration and time.

Figure 8. Hemicellulose and Cellulose region (white) and Lignin region (brown) pre-treated for 2 hours at 0.5% (v/v) concentration on (a) un-pretreated, (b) pre-treated at 25°C, (c) pre-
treated at 110°C, (d) pre-treated at 120°C, (e) pre-treated at 150°C, (f) pre-treated at 200°C
Figure 8a shows the surface morphology of un-pretreated bamboo, this reveals an unaffected structure of hemicellulose, cellulose and lignin region, while Figure 8b-f shows the structure of the bamboo after pre-treatment with dilute sulphuric acid for 2 hours, Figure 8c-e, shows breakdown in the structure of the pre-treated bamboo at 110°C, 120°C and 150°C, respectively, for 2 hours and 0.5% (v/v). Here, the hydrolysis of hemicellulose begins to occur, which corresponds to the amount of sugar that had been dissolved in the filtrate. Figure 9f shows higher breakdown in the ligno-cellulosic structure and a considerable amount of pores. This gives reason for the higher glucose yields obtained compared to the other ones, this indicates that the cellulose began to break down into glucose and corresponds to the high glucose yield of 42 mg/g that was produced at 200°C and 0.5% (v/v) concentration for 2 hours.
Figure 9. Hemicellulose and Cellulose region (white) and Lignin region (brown) pre-treated for 4 hours at 0.5% (v/v) concentration on (a) pre-treated at 25°C, (b) pre-treated at 110°C, (c) pre-treated at 120°C, (d) pre-treated at 150°C, (e) pre-treated at 200°C
Figure 9a shows structure of bamboo after pre-treatment at room temperature for 4 hours and a concentration of 0.5% (v/v). However, Figure 9b-c shows clear evidence of disorder and breakdown in the structure of the pre-treated bamboo.
This indicates the hydrolysis of hemicellulose in the pre-treated bamboo sample. Figure 9d-e, exhibit greater disorder and breakdown this led to an increase in the levels of porosity. This is consistent with the higher level of glucose yield of 56.1 mg/g obtained. This corresponds to the amount of hemicellulose and cellulose that was broken down and hydrolyzed into glucose.
Figure 10a, shows difference in structure compared to the un-pretreated bamboo after pre-treatment at room temperature for 2 hours and 1.0% (v/v), this change was as a result of hydrolysis of hemicellulose due to the short branches and short lateral chains.
Figure 10b-c, shows the stretching of the hemicellulose and cellulose which was as a result of an increase in temperature and acid concentration, the branch structure begins to loosening up to form longer chains and therefore allowing more hemicellulose to be hydrolyzed to provide higher glucose yields compared to that at room temperature.
Figure 10d-e, shows breakdown of large amount of hemicellulose and part of cellulose into glucose, which can be compared to the sugar assay test results. Figure 10e also shows a disruption of the lignin structure, thereby given access to more hemicellulose and cellulose region.
This gives reason for a higher glucose yield of 47.7 mg/g 200°C and 1.0% (v/v) for 2hours; here the combination of temperature and residence time increased the glucose which was released from the pre-treated bamboo sample.
Figure 11a, shows a considerable breakdown of hemicellulose, while Figure 11b shows a larger portion of the hemicellulose has been broken down and hydrolyzed, in Figure 11c, stretching of hemicellulose and a partial break down of cellulose to glucose throughout the regions and there is a considerable amount of pores, which increases the active sites necessary for enzymatic hydrolysis.
Figure11d shows that a large amount of hemicellulose hydrolyzed and cellulose been broken down during the pre-treatment to form glucose.
Figure 11e shows vigorous removal of hemicellulose, breakdown of cellulose and significant disruption of lignin resulting in higher level of porosity and a maximum glucose yield of 91.8 mg/g at 200°C and 1.0% (v/v) for 4 hours, this was as a result of an increase in temperature, acid concentration and residence time.
Figure 10. Hemicellulose and Cellulose region (white) and Lignin region (brown) pre-treated for 2 hours at 1.0% (v/v) concentration on (a) pre-treated at 25°C, (b) pre-treated at 110°C, (c) pre-treated at 120°C, (d) pre-treated at 150°C, (e) pre-treated at 200°C
This result (Figure 11) shows that at 200°C and 1.0% (v/v) and 4 hours pre-treatment, maximum glucose can be obtained which was necessary for the fermentation and it made it possible to have enough active sites to which the enzymes could attach themselves to during enzymatic hydrolysis.

Figure 11. Hemicellulose and Cellulose region (white) and Lignin region (brown) pre-treated for 4 hours at 1.0% (v/v) concentration on (a) pre-treated at 25°C, (b) pre-treated at 110°C, (c) pre-treated at 120°C, (d) pre-treated at 150°C, (e) pre-treated at 200°C. Effects of enzymatic hydrolysis on bamboo microstructure
Figure 12a shows the microstructure of bamboo sample that was enzymatically hydrolyzed after it was pre-treated with 0.5% (v/v) H2SO4 for 4 hours. Here the hemicellulose and cellulose region were reduced and the porosity increases, this was due to the hydrolysis of hemicellulose and cellulose into glucose and the chemical degradation of lignin portion. Figure 12b shows the microstructure of bamboo sample that was enzymatically hydrolyzed after it was pre-treated with 1.0% (v/v) H2SO4 for 4 hours, which shows that the more the pores, the lower the fraction of hemicellulose and cellulose. This difference may be due to the increase in acid concentration from 0.5 to 1.0% (v/v). It can be seen from Figure 12c, which was pre-treated for 4 hours, 0.5% (v/v) and 200°C, here more hemicellulose and cellulose region was hydrolyzed and the lignin was broken down and removed from the interface of the bamboo. Figure 12d, which was obtained at 1.0% (v/v), and 200°C, almost all the hemicellulose and cellulose were hydrolyzed from the substrate of the bamboo sample. The lignin portion was broken down and removed from the substrate of the bamboo, and this may also serve as inhibitor and reduce the total amount of glucose produce, during pre-treatment and enzymatic hydrolysis.
Figure 12. Enzymatic hydrolysis on pre-treated bamboo with (a) 0.5%(v/v) H2SO4 for 4 hours at 25°C, (b) 1.0%(v/v) H2SO4 for 4hours at 25°C, (c) 0.5%(v/v) H2SO4 for 4 hours at 200°C, (d) 1.0%(v/v) H2SO4 for 4 hours at 200°C
Figure 13. ESEM micrograph of milled bamboo
(a) before pre-treatment (b) after pre-treating with H2SO4 (c) after enzymatic hydrolysis
In Figure 13a, the untreated sample shows amorphous regions, with larger particles and solid surfaces. The cell walls comprise of lignin, which gives the cells structural integrity. Figure 13b shows the bamboo sample that were pre-treated with 0.5% v/v sulfuric acid appeared the most distressed, and the cell wall structures that were visible earlier were no longer observed. The addition of acid in the pre-treatment effectively removes the lignin from the particles, so that the cell walls were broken down.
Furthermore, the sugar yields confirmed that more sugar was released in the pre-hydrolyzate for the sample treated with acid. Once the acid was used to remove the lignin and degrade the cell wall structure, more hemicellulose was available for hydrolysis, which led to higher sugar concentrations. In Figure 13c, the pre-treated bamboo particles appeared to be more digested by the enzymes.
The microstructural observation of the untreated, pretreated and enzymatic hydrolyzed bamboo provided a better understanding of the morphology which was achieved by both optical and ESEM images revealing the cell wall structure made of cellulose, hemicellulose and lignin, and how they were gradually degraded at the pretreatment and enzymatic hydrolysis stages, also it revealed disorder and breakdown of the pretreated bamboo structure, which led to an increase in porosity.
Conclusion
Pre-treatment by dilute acid and enzymatic hydrolysis to produce glucose was investigated. From this study increasing the pre-treatment temperature also increases the amount of glucose released, this was evident in the microstructure of the bamboo after pre-treatment at various temperatures and enzymatic hydrolysis.
Acknowledgements
This research was supported by the World Bank - SHESTCO - STEP-B, which allowed us to make use of their laboratory equipment in SHESTCO.
References
1. Wheeler J., Alternative Cars, ABDO, 2008, p. 21, ISBN 978-1-59928-803-1.
2. Amanda M. M. R., Bamboo to Butanol: Production of Lignocellulosic Butanol through Fermentation by Clostridia, Senior Thesis, Department of Chemical and Biochemical Engineering, Princeton University, Princeton, New Jersey, USA, 2012.
3. Towards sustainable production and use of resources, Assessing Biofuels, International Resource Panel, United Nations Environment Programme, 2009.
4. Abdul Latif M., Wan Tarmeze W. A., Fauzidah A., Anatomical Features and Mechanical Properties of Three Malaysian Bamboos, Journal Tropical Forest Science, 1990, 2(3), p. 227-234.
5. McClure F. A., The bamboos, A fresh perspective, Harvard University Press, Cambridge, Massachusetts, 1967.
6. Tomalang F. N., Lopez A. R., Semara J. A., Casin R. F., Espiloy Z. B., Properties and utilization of Philippine erect bamboo. In International Seminar on Bamboo Research in Asia held in Singapore, May 28-30, 1980: Proceedings edited by Lessard G. and Chouinard A., Singapore: International Development Research Center and the International Union of Forestry Research Organization, p. 266-275.
7. Kolawole F. O., A Study of Pre-Treatment Temperature on Lignocellulosic Butanol as an Alternative Fuel (Bio-Fuel) Produced from Bamboo using Clostridium Acetobutylicum, Unpublished M.Sc. Thesis, Department of Materials Science and Engineering, African University of Science and Technology, Abuja, Nigeria, 2013.
8. Sun Y., Cheng J., Hydrolysis of lignocellulosic materials for ethanol production: a review, Bioresource Technology, 2002, 83, p. 1-11.
9. Mutreja R., Das D., Goyal D., Goyal A., Bioconversion of Agricultural Waste to Ethanol by SSF using Recombinant Cellulase from Clostridium Thermocellum, Enzyme Research. 2011.
10. Bin Y., Ziyu D., Shi-You D., Wyman C. E., Enzymatic hydrolysis of Cellulosic biomass, Biofuels, 2011, 2(4), p. 421-450.
11. Umesh P., Agarwal J. Y., Zhu S., Ralph A., Enzymatic Hydrolysis of Biomass: Effects of Crystallinity, Particle Size, and Lignin Removal, Proceedings of the 16th International symposium on Wood, Fiber and Pulping Chemistry, Tianjin, China, Beijing, China Light Industry Press, 2011, p. 910-914.
12. Yeoman C. J., Han Y., Dodd D., Schroeder C. M., Mackie R. I., Cant I. K., Thermostable enzymes as biocatalysts in the biofuel industry, Advanced Applied Microbiology, 2010, 70, p. 1-55.
13. Navy demonstrates alternative fuel in riverine vessel, Marine Log, 2010-10-22. Retrieved 2010-07-11(2012).
14. Miscanthus E. K., Conversion to Ethanol: Effect of Particle Size and Pre-treatment Conditions for hot water. A PhD Thesis, Department of Agricultural and Biological Engineering, Graduate College of the University of Illinois at Urbana-Champaign. Urbana, Illinois, 2012.
15. Ezeji T., Qureshi N., Blaschek H., Butanol production from agricultural residues: impact of degradation products on Clostridium beijerinckii growth and butanol fermentation, Biotechnology and Bioengineering., 2007, 97, p. 1460-1469.
16. Shih C., Smith E., Determination of glucose and ethanol after enzymatic hydrolysis and fermentation of biomass using Raman spectroscopy, Analytica Chimica Acta, 2009, 653(2), p. 200-206.
17. Pingali S. V., Urban V. S., Heller W. T., McGaughey J., O’Neill H., Foston M., Myles D. A., Ragauskas A., Evans B. R., Breakdown of Cell Wall Nanostructure in Dilute Acid Pretreated Biomass, Biomacromolecules, 2010, 11, p. 2329-2335.
18. Saeman J. F., Kinetics of Wood Saccharification, Industrial and Engineering Chemistry, 1945, 37, p. 43-52.