Engineering, Environment
Effect of laser cutting parameters on surface roughness of stainless steel 307
Amal NASSAR*, Eman NASSAR, Mona A. YOUNIS
Dept. of Mechanical Engineering, Higher Technological Institute, Tenth of Ramadan City, Egypt
E-mails: *amal.nasser@hti.edu.eg; eman.nasser@hti.edu.eg; mona.younis@hti.edu.eg
*Corresponding author: Phone: +201006414107; Fax: +20224924319
Received: May 16, 2016 / Accepted: December 8, 2016 / Published: December 30, 2016
Abstract
Optimal parameters of laser cutting are an important step to improve surface quality of cutting edge in the laser cutting of stainless steel 307. This paper presents a new approach for optimizing the cutting parameters on stainless steel. Based on 33 full factorial experimental design, cutting experiments were conducted for stainless steel 307 plates using a laser machine (AMADA FONT 3015). The cutting parameters such as, cutting speed, cutting power and gas pressure are optimized for maximizing surface quality. The results indicated that cutting power and cutting speed play an important role in surface quality.
Keywords
Laser cutting parameters; Surface roughness; Stainless steel 307
Introduction
Laser Beam Machining is a thermal process considering the mechanisms of material removal, in this machine the electrical energy is used to produce high-energy coherent photons [1]. The advantage of laser Machining is with the high flexibility and its ability to cut metal elements with complex geometries at high preciseness, whereas manufacturing a high cut-edge quality [2]. Producing high-quality cut edges can be done by controlling the laser cutting parameters in a correct manner. There are many parameters for Laser process such as distance of the stand, speed of cutting, diameter of the nozzle, work pice thickness, pressure of the assist gas etc. Many researchers studied the effect of these parameters on widths of the kerf, angle of taper, rate of material removal, heat affected zone (HAZ) and roughness of surface [1, 3-8].
In order to evaluate the laser cutting effect on the surface roughness for a metallic material, stainless steel (SS-307) has been chosen and cutted by laser machine (AMADA FONT 3015) at different parameters. This research is an attempt to find the link between laser cutting parameters and surface roughness, to improve surface quality.
Experimental
A 2.0 kW AMADA FONT 3015 Laser machine is used for the experiments. Stainless steel grade 307 with a thickness of 4 mm and a length of 8 mm length was used in each experiment; workpieces were cut over a machined length of 10mm. Table 1 shows the chemical composition for the selected material.
Table 1: (SS-307) chemical composition
|
% from |
||||||||
|
C |
Mn |
Si |
P |
S |
Cr |
N |
Ni |
iron |
|
0.080 |
2.000 |
0.750 |
0.045 |
0.030 |
18.000 |
0.100 |
8.000 |
Balance |
The conditions of laser cutting are shown in table 2.
Table 2: Conditions of laser cutting
|
code |
Power |
Speed |
O2 pressure |
|
code |
Power |
Speed |
O2 pressure |
|
code |
Power |
Speed |
O2 pressure |
|
A1 |
1200 |
2 |
4 |
|
A10 |
1000 |
2 |
4 |
|
A19 |
1000 |
5 |
3 |
|
A2 |
1500 |
2 |
3 |
|
A11 |
1000 |
3 |
3 |
|
A20 |
1200 |
2 |
5 |
|
A3 |
1500 |
5 |
5 |
|
A12 |
1500 |
5 |
3 |
|
A21 |
1200 |
3 |
4 |
|
A4 |
1200 |
5 |
3 |
|
A13 |
1000 |
5 |
5 |
|
A22 |
1200 |
2 |
3 |
|
A5 |
1500 |
3 |
3 |
|
A14 |
1200 |
3 |
5 |
|
A23 |
1000 |
5 |
4 |
|
A6 |
1200 |
3 |
3 |
|
A15 |
1500 |
5 |
4 |
|
A24 |
1000 |
3 |
5 |
|
A7 |
1200 |
3 |
4 |
|
A16 |
1000 |
3 |
4 |
|
A25 |
1500 |
2 |
5 |
|
A8 |
1000 |
2 |
4 |
|
A17 |
1200 |
5 |
3 |
|
A26 |
1500 |
3 |
5 |
|
A9 |
1000 |
2 |
3 |
|
A18 |
1200 |
5 |
5 |
|
A27 |
1500 |
2 |
4 |
Surface roughness was measured using portable tester (Mitutoyo, Model: 201 stylus profile meter) to find the roughness profile ((Ra, Rq, Rp and Rv). Digital imaging of the laser cut-edges was done using a Leica microscope and a Canon EOS 1100D digital camera. Statistical method (ANOVA) was used at the end of experiments to find out what factors have a significant effect on surface roughness.
ANOVA analysis for Surface roughness
A new mathematical model was designed using DESIGN EXPERT software to analyze the results, the full factorial design was selected and analysis of variance (ANOVA) was utilized to evaluate the results. Table 3 shows obtained surface roughness. Table 3 shows the selected factors operated for this study within working levels. Three factors and three levels were used in this experiment. 12 running processes were performed from the equation of full factorial design:
Full Factorial Equation = 2k (1)
where k denotes the number of factors, i.e. 3: Power (W), Speed (mm\min), and O2 pressure, being examined in this experiment and three levels at the experiment were employed. Table3 shows the selected factors operated for this study.
Table 3. The selected factors operated for this study
|
Factors |
Levels |
||
|
Power (w) |
1000 |
1200 |
1500 |
|
Cutting speed (m/min) |
2 |
3 |
5 |
|
O2 pressure |
3 |
4 |
5 |
Results and Discussion
Microstructures
Figure 1 shows the cutting surface for each condition. The micrographs of cutting edges revealed that cutting conditions affected on surface of cutting edge. Laser cutting left Striations parallel to cutting direction. These striations were visible at high cutting speeds and high power. When the gas pressure was high, the cut edges formed a melted surface and became less stable instead of controlled striation formations. The figure revealed that there is no correlation between the size of Striations and the parameters of cutting, and that striation size are depends on the thermal history during laser cutting. Marcelo [9] has predicted the distribution of the temperature at the cutting edge. Duley et al. [10] and Yang[11] have founded that there is no correlation between the size of Striations and cutting parameters.
|
A4 |
A27 |
A25 |
A15 |
|
|
|
|
|
|
A2 |
A3 |
A22 |
A12 |
|
Legend: |
|||
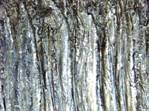
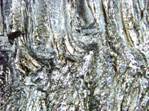
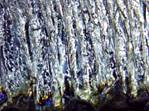
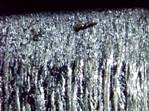
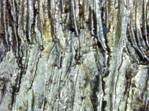
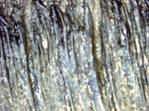
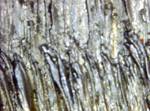
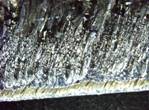
Figure 1. Cutting surface for some samples at different conditions
Using high power leads to deeper striations. The figures reveal also, that the amount of laser power was the most significant factor in striations formation, and fine striations have appeared at high power and speed but at low gas pressure. This may be due to the gas pressure effect on the hydrodynamic behavior of molten metal which affected the molten metal expel from the cutting front and on striations formation [13]. Straight cut edges were found at low cutting speed and at low power.
Surface roughness properties
Figure 2 shows striations take a periodic series when the cutting process was made at low cutting speed and high power.
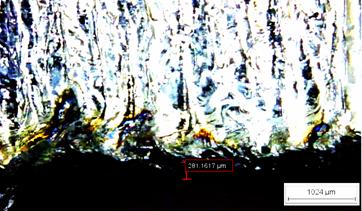
Figure 2. Striations generated using a power of 1500 W and gas pressure of 4 bar with traverse cutting speeds of a 5 m/min and 3 m/min
At high power and cutting speed, the figure 2 reveals inconsistent striations.
Figure 3 shows the roughness properties for cutting in different conditions, the least defined striations were produced at high power and speed and at low gas pressure. Increasing gas pressure leads to non-uniform striations (higher Rv and Rp). The optimum striation in the cutting-edge was found when using low power, speed, and gas pressure also, when using high power and speed, and low gas pressure. Using the right balance between traverse cutting speed and power and using a low gas pressure led to a uniform surface.
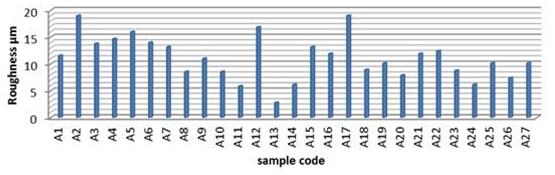
Figure 3. Roughness properties for the cutting surface (Ra) at different conditions
ANOVA analysis
The analysis of ANOVA is utilized to specify the Laser machining parameters, by using DESIGN EXPERT software version 9. Table 4 and 5 show the design data and design model used in the ANOVA analysis respectively.
Table 4. The design data used in ANOVA analysis
|
Run |
Factor A |
Factor B |
Factor C |
Response |
|
Run |
Factor A |
Factor B |
Factor C |
Response |
|
Power |
Speed |
O2 pressure |
Roughness |
|
Power |
Speed |
O2 pressure |
Roughness |
||
|
1 |
A level 2 |
B level 1 |
C level 2 |
11.56 |
|
15 |
A level 3 |
B level 3 |
C level 2 |
13.16 |
|
2 |
A level 3 |
B level 1 |
C level 1 |
19 |
|
16 |
A level 1 |
B level 2 |
C level 2 |
11.92 |
|
3 |
A level 3 |
B level 3 |
C level 3 |
13.78 |
|
17 |
A level 2 |
B level 3 |
C level 1 |
19 |
|
4 |
A level 2 |
B level 3 |
C level 2 |
14.67 |
|
18 |
A level 2 |
B level 3 |
C level 3 |
8.91 |
|
5 |
A level 3 |
B level 2 |
C level 1 |
16 |
|
19 |
A level 1 |
B level 3 |
C level 1 |
10.11 |
|
6 |
A level 2 |
B level 2 |
C level 1 |
14 |
|
20 |
A level 2 |
B level 1 |
C level 3 |
7.89 |
|
7 |
A level 3 |
B level 2 |
C level 2 |
13.16 |
|
21 |
A level 2 |
B level 2 |
C level 2 |
11.92 |
|
8 |
A level 1 |
B level 1 |
C level 2 |
8.55 |
|
22 |
A level 2 |
B level 1 |
C level 1 |
12.43 |
|
9 |
A level 1 |
B level 1 |
C level 1 |
11 |
|
23 |
A level 1 |
B level 3 |
C level 2 |
8.76 |
|
10 |
A level 1 |
B level 1 |
C level 3 |
8.55 |
|
24 |
A level 1 |
B level 2 |
C level 3 |
6.16 |
|
11 |
A level 1 |
B level 2 |
C level 1 |
5.87 |
|
25 |
A level 3 |
B level 1 |
C level 3 |
10.15 |
|
12 |
A level 3 |
B level 3 |
C level 1 |
16.86 |
|
26 |
A level 3 |
B level 2 |
C level 3 |
7.4 |
|
13 |
A level 1 |
B level 3 |
C level 3 |
2.79 |
|
27 |
A level 3 |
B level 1 |
C level 2 |
10.15 |
|
14 |
A level 2 |
B level 2 |
C level 3 |
6.16 |
|
|
||||
Based on ANOVA analysis of surface roughness in Table 5, it can be seen that the model is significant with probability, Prob>F value between 0.0001 to 0.0499 less than 0.05. It shows that Factors 1 and 2 are significant, while factor 3 is not significant.
Table 5. ANOVA analysis of surface roughness
|
Source |
Sum of Squares |
df |
Mean Square |
F Value |
p-value Prob > F |
|
293.352311 |
|
|
|
|
|
|
Model |
6 |
48.89205 |
7.880378 |
0.0002 |
|
|
A-Power |
124.494289 |
2 |
62.24714 |
10.03294 |
0.0010 |
|
B-Speed |
13.3406 |
2 |
6.6703 |
1.075113 |
0.3602 |
|
C-O2 pressure |
155.517422 |
2 |
77.75871 |
12.53308 |
0.0003 |
|
Residual |
124.085556 |
20 |
6.204278 |
|
|
|
Total |
417.437867 |
26 |
|
|
|
Figure 4 displays the observed values compared with the predicted values calculated from the model.
Figure 4. Observed values compared with the predicted values
In figure 4 it can be seen that the regression model fairly well fits with the observed values (error less than 2.7%).
The response ranges from 2.79 µm to 15.91 µm and the ratio of maximum to minimum is 5.70 µm. After eliminating the non-significant terms (B is not significant in Table 5), the final response equation for Surface Roughness is given as:
Roughness = 10.20 – 2.01·A – 2.31·C (2)
Equations in terms of all coded factors as follows:
Roughness = 10.0375 - 3.2575·A - 0.9975·B + 0.7175·C + 0.0625·AB
- 0.095·AC + 0.9375·BC + 0.25·C2 + 1.5·ABC + 1.8775·AC2 – 1.965·BC2 (3)
where A: Power; B: Speed and C: O2 Pressure.
Equation 2 and 3 are multiple regression models based on data collected during the course of the experiment configuration given in Table 3. The obtained equations allow doing estimates. Figure 5 shows the estimated response in 3D surface the Surface Roughness with Speed and O2 pressure with different levels of the Power.
|
|
for Level 1 of C
|
|
|
for Level 2 of C |
|
|
for Level 3 of C |
Figure 5. Estimated response of Roughness in 3D surface
The surface roughness tends to increase considerably with the decrease of power and speed [12], [14]. It is clear from the figure that the higher surface roughness can be obtained using 1000 w, 5 bar and 5 mm/min. This is due to lower power and speed exhibits higher distortion on the surface, which leads to higher surface roughness.
In general, it is evident that the surface roughness decreases with an increase in cutting speed (Figure 5). A decrease in laser power, generally increases surface roughness, however the effect of laser power should be considered through interaction with cutting speed and assist gas pressure. Similarly, an increase in gas pressure increases surface roughness. The effects of cutting speed and assist gas pressure were more pronounced than the effect of laser power on surface roughness characteristics.
Conclusions
The present work studies the surface quality after cutting S.S 307 in different conditions (cutting speed, gas pressure and laser power) also it predicts the values of surface roughness with a mathematical model. The conducted experiments give the following conclusions:
¸ That higher surface roughness can be obtained using 1000 w and 5 mm\min. This is due to lower power and higher speed exhibits higher distortion on the surface, which leads to higher surface roughness.
¸ Gas pressure had less effect of surface roughness. This might be due to small variation in its level.
¸ The variation in % errors in the values of roughness was estimated around 2.7 %, so the mathematical model is valid and can be used in machine response’s prediction.
References
1. Riveiro A., Quintero F., Lusquiños F., J. del Val, Comesaña R., Boutinguiz. M., Pou J., Experimental study on the CO2 laser cutting of carbon fiber reinforced plastic composite, Composites, 43 (A), p. 1400-1409.
2. Thomas D. J., The effect of laser cutting parameters on the formability of complex phase steel, The International Journal of Advanced Manufacturing Technology, 2013, 64 (9), p. 1297-1311.
3. Schulz W., Becker D., Franke J., Kemmerling R., Herziger G., Heat conduction losses in laser cutting of metals, Journal of Physics D: Applied Physics, 2009, 26.
4. Chen S.L., Effects of high-pressure assistant-gas flow on high-power CO2 laser cutting, J Mater Process Technol 1999, 88, p. 57-66.
5. Lamikiz A., Lacalle L. N. L. de, Sánchez J.A., Pozo D del, Etayo J. M., López J. M., CO2 laser cutting of advanced high strength steels (AHSS), Applied Surface Science, 2005, 242, p. 362-368.
6. Rajaram N., Sheikh-Ahmad J., Cheraghi S. H., CO2 laser cut quality of 4130 steel, Int J Mach Tools Manuf 2003, 43, p. 351-358.
7. Dubey A. K., Yadava V., Experimental study of Nd:YAG laser beam machining-An overview, Journal of Materials Processing Technology 2008, 195, p. 15-26.
8. Madic M., Radovanovic M., Slatineanu L., Surface roughness optimization in CO2 laser cutting by using Taguchi method, UPB Sci Bull, Ser, 2013, 75, p. 97-106.
9. Ribeiro dos Santos M., Marcondes de Lima e Silva S. M., Machado A. R., Bacci da Silva M., Guimarães G., Rodrigues de Carvalho S., Analyses of Effects of Cutting Parameters on Cutting Edge Temperature Using Inverse Heat Conduction Technique, Mathematical Problems in Engineering 2014, p. 11-16.
10. Gonsalves J. N., Duley W. W., Cutting thin metal sheets with the cw CO2 laser, Journal of Applied Physics, 1972, 43, p. 4684-4687.
11. Yang J. H., Sun S. J., Brandt M., Yan W. Y., Experimental investigation and 3D finite element prediction of the heat affected zone during laser assisted machining of Ti6Al4V alloy, Journal of Materials Processing Technology 2010, 210, p. 2215-2222.
12. Kruusing A., Handbook of Liquids-Assisted Laser Processing, Elsevier Science, 2010.
13. Rajapurohit S. R., Patel D. M, Striation mechanism in laser cutting - the review, International Journal of Engineering Research and Applications, 2012, 2(2), p. 457-461.
14. Meenakshi Sundaram R., A statistical analysis of surface finish in fine turning of steel, PhD Thesis in Industrial Engineering (PhD Advisor: Lambert B. K.), Texas Tech University, Lubbock, 1976.