Engineering, Environment
The role of smart grids in integrating renewable energy
Ali MEKKAOUI1*, Mohammed LAOUER2, Mimoune YOUNES3
1 Department of Electrical engineering, University of Sidi Belabes, Algeria
2 Department of Electrical engineering, University Centre of Naama, Algeria
3 Department of Electrical engineering, University of Sidi Belabes, Algeria
E-mail(s): 1 mekkaouiali70@gmail.com; 2 laouer@yahoo.fr; 3 younesmi@yahoo.fr
* Corresponding author, phone: +213555196388
Received: January 12, 2017 / Accepted: June 14, 2017 / Published: June 30, 2017
Abstract
In this paper a novel model of smart grid connected photovoltaic / wind turbine hybrid system is developed. A Smart Grid has been presented in MATLAB/SIMULINK environment to see the approach for analysis of power exchange. Analysis of this last, gives the exact idea to know the range of maximum permissible loads that can be connected to their relevant bus bars. This paper presents the variation of Active Power with varying load angle in context with small signal analysis. The Smart Grid, regarded as the future generation power grid, uses two-way flow of electricity and information to create a widely distributed automated energy delivery network.
Keywords
Smart grids; Smart meter; Photovoltaic systems; Wind power generation; Active power
Introduction
A smart electricity infrastructure or a smart grid is a new highly-integrated power grid based on the physical grid, shown in figure 1 [1]. Similar to the existing electrical power system, it possesses the capability of integrating such renewable electricity as solar and wind. It combines with the advanced sensor measurement technology, computer technology, information technology, control technology, communication technology and real power.
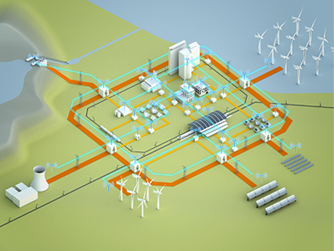
Figure 1. Smart grid system showing the renewable and non-renewable energy sources, the control centre, and the communication network overlay [1]
To respond at the user demand for electricity, the optimal allocation of resources and the requirements of environmental constraints should be considered. Once the cost power is least expensive, consumers can allow the smart grid to active the home appliances, whist the factories can undertake the production processes. At peak time, users can turn off some non-essential electrical appliances to reduce demand. In addition, it ensures the power quality, reliability and power economic supply, adapts the power market for the development purpose and achieves the electricity supply and value-added services for user clean, reliable and economical. Actually, smart grids are being promoted by many governments as a way of addressing energy independence, global warming and emergency issues.
Material and method
Modelling and design of wind turbine
Several studies have been reported regarding to wind turbine [2]. In this study, the proposed wind turbine model is based on the wind speed to appear clearly the wind turbine output power characteristics. The output power of the wind turbine is given by [3] in Eq. (1):
|
|
(1) |
Where: Pm - The mechanical output power of the turbine; Cp - The performance coefficient of the turbine; λ - The tip speed ratio of the rotor blade; β - The blade pitch angle; ρ - The air density; A - The turbine swept area; Vwind - The wind speed.
The performance coefficient model Cp (α, β) used in this paper is taken from [3] and given by Eq. (2):
|
|
(2) |
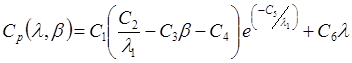
Where: constants C1 to C6 are the parameters that depend the wind turbine rotor and the blade design; λi is a parameter given in Eq. (3).
|
|
(3) |
Furthermore, Equation (1) can be normalized and simplified for specific values of A and ρ as in Eq. (4):
|
|
(4) |
Where: Pm-pu - The power in per unit of
nominal power for particular values of ![]() and A; Cp-pu - The performance coefficient
and A; Cp-pu - The performance coefficient![]() ; Kp - The power gain Vwind-pu of
the base wind speed. The based wind speed is the mean value of the expected
wind speed in m/s.
; Kp - The power gain Vwind-pu of
the base wind speed. The based wind speed is the mean value of the expected
wind speed in m/s.
Modelling and design of photovoltaic module
The mathematical model for the solar cell has been studied over the past three decades [4]. The circuit of the solar cell model, which consists of a photocurrent, diode, parallel resistor (leakage current) and a series resistor; is shown in figure 2.
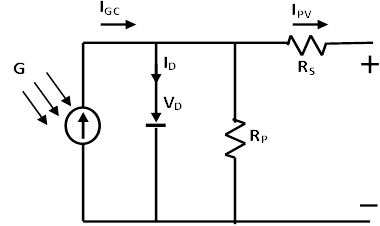
Figure 2. Single diode PV cell equivalent circuit
According to both the PV cell circuit and Kirchhoff’s circuit laws, the photovoltaic current can be presented as follows [5], Eq.(5):
|
|
(5) |
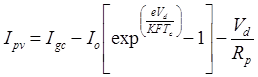
Where: IGC - The light generated current; I0
- The dark saturation current dependant on the cell temperature; e - The electric
charge![]() ; K - Boltzmann’s constant
; K - Boltzmann’s constant![]() ; F - The cell
idealizing factor; Tc - The cell’s absolute temperature; Vd - The diode voltage; Rp - The parallel resistance.
; F - The cell
idealizing factor; Tc - The cell’s absolute temperature; Vd - The diode voltage; Rp - The parallel resistance.
The photocurrent (Igc) mainly depends on the solar irradiation and cell temperature, which is described as [5], Eq. (6):
|
|
(6) |
Where: μSC - The temperature coefficient of the cell’s short circuit current; Tr - The cell’s reference temperature; ISC - The cell’s short circuit current at 250C and 1KW/m2; G - The solar irradiation in KW/m2.
Furthermore, the cell’s saturation current (I0) varies with the cell temperature, which is described as [5], are in Eq. (7) and Eq. (8):
|
|
(7) |
|
|
(8) |
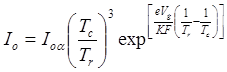
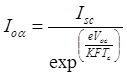
Where: I0α - The cell’s reverse saturation current at a solar radiation and reference temperature; Vg - The band-gap energy of the semiconductor used in the cell; Voc - The cells open circuit voltage.
Description smart grid system 3
There are four major parts of smart system, which will work together to overcome all those problems which are drawbacks of previous systems, these are [6,7]: Smart House System; Smart Meter; Town Server; Main Server.
Smart house is a customer house which consists of smart appliances. Devices are smart due to installation of smart wireless card. The diagram of smart wireless card it consist of [8], [9]: Digital meter; Microcontrollers; Sensors; Simple wireless cards.
The basic purposes of smart meter (S.M.) system are [10,11]: Power management and measuring; Unit measurement and price; Communication.
A town server is basic unit of smart system for management. In fact, it is the central computer and a complete server which is able to take decision for all its user. The TS is connected to MS for communication only by using PSTN [12].
Main server (MS) is the central device around which all the system works. It keeps measurements, bills, records, customer records, topology of division of all the power of smart grid/ power stations for its town servers etc. every TS is connected to MS via PSTN only. MS is directly operated by head office of service provider [13], [14].
Results and discussion
The first house is powered by two energies, a wind energy of 4KW and the other of the general electricity network GEN. Its load curve is described by the following program: from 0:00 to 7:00 in the morning, the house consumes a constant electric power of 1KW supplied by the wind turbine. At 7:00 am, there is a peak of load reaching a value of 3KW, also supplied by the wind turbine.
|
|
|
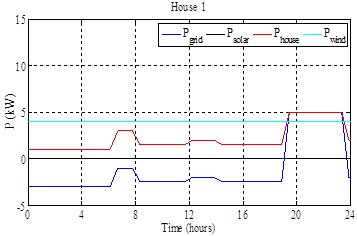
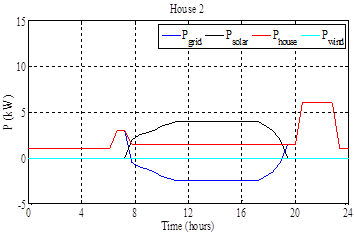
Figure 3. House simulation results
As a result for first house, the house remains isolated from the GEN until 7.00 pm where a second peak of 5KW of power is observed and must last until 23.00. During this period the GEN intervenes to fill the gap.
For the second house, its load curve is given by the following program: from 00h to 06:00, it consumes a power of 1KW supplied by the GEN. A peak of power consumption of 3KW is observed and which should last 1h30mn. This power is always supplied by the GEN then the consumption will be reduced to 1.5KW following the appearance of the day when the solar energy intervenes. Thus, the GEN will be discharged of this difference until 19:00. So the GEN takes care of the consumption of the second house until 24:00.
|
|
|
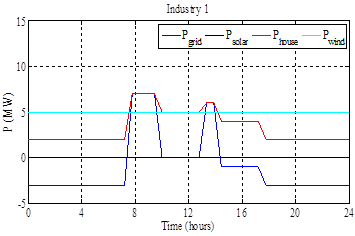
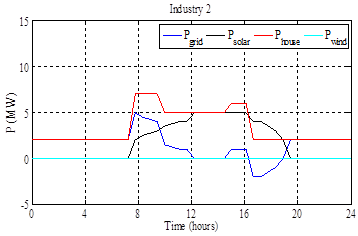
Figure 4. Industry simulation results
Unlike houses, industries have very important poles of production and consumption. The first industry contains a 5 MW wind turbine and is connected to the GEN, so it is powered by both energy sources. Its load curve is described by the following distribution: from 00h00 to 7h00 it consumes a constant power of 2 MW provided by the wind turbine. At 7:30 am the arrival of the workers and the start-up of the machines of the industry, a first peak of power consumption is observed and reaches a value of 7 MW. The latter can only be met by GEN assistance until 10.00 am; then the load is reduced to 5 MW. The plant becomes autonomous and will be powered by its wind turbine until 13:00. At this time, a second peak is marked with the value of 6 MW and which lasts until 14h00; the difference is ensured by the GEN. Then the reduction in load to 4 MW frees the GEN to give the relay to its wind turbine to take charge of the consumption for the rest of the day. Knowing that after the industry closes at 17:00 the consumption is reduced to 2 MW.
The second industry contains a solar park with a capacity of 5 MW and is connected to GEN, so it is powered by both energy sources. Its load curve is described by the following distribution: from 00h00 to 6h00 it consumes a constant power of 2 MW provided by the GEN. With the arrival of the workers and the start-up of the machines of the industry, a peak of 7MW power is observed and only the GEN takes care of it. At 8:00 am where the solar energy appears and begins to provide energy, both energy are operational but solar energy cannot satisfy this demand alone, and the peak will last until 10:00. Following a reduction in power of 5 MW, the GEN is released and only the solar park feeds the plant. A second peak of 6 MW is observed at 15h00 and continues until 16h00, which again involves the GEN. At 5 pm, with the closure of the industry, consumption is reduced to 2 MW. The latter is provided by the solar park until 19:00 with the sunset, the GEN is used again until the end of the day 5.
Conclusions
In this paper, we presented an intelligent electrical network modelled and simulated in the Matlab/Simulink environment to highlight the contribution of consumers to the reduction of GEN. Mini-power plants represent an equal integration of renewable energies as a whole. The response curves obtained clearly explain the different real-time behaviours of the different actors in different situations. The proposed scenarios only reinforce the importance of GEN, which must be complemented by other intelligent means of communication. The exchange of information must be ensured by smart meters.
The proposed model involves both types of solar and wind energy under normal operating conditions and explains the energy exchange between consumers and GEN. The cost of electric energy is not taken into consideration but leaves the choice to the various players to switch to the cheapest.
Acknowledgements
We would like to thank the director of the laboratory of modelling and calculation method LMMC of Saida University for us facilitated access to the laboratory and to provide us the necessary materials to realize this work
References
.
1. Mellitus O.E., A Multi-domain co-simulator for smart grid: Modelling interactions in power, control and communications, Master of Applied Science Department of Electrical and Computer Engineering University of Toronto, 2015.
2. Battista H. De, Mantz R.J., Garelli F., Power conditioning for a wind-hydrogen energy system, Journal of Power Sources, 2006, vol. 155, p. 478-486.
3. Muljadi E., Butterfield C.P., Pitch-controlled variable-speed wind turbine generation, IEEE Trans. Industry Appl., 2001, vol. 37, p. 240–246.
4. Phang J.C.H., Chan D.S.H., Philips J.R., Accurate analytical method for the extraction of solar cell model parameter, IEEE Electronics Letters, 1984, vol. 20, p. 406-408.
5. Villalva M.G., Gazoli J.R., Filho E.R., Comprehensive approach to modelling and simulation of photovoltaic arrays, IEEE Transactions on Power Electronics, 2009, vol. 24, pp 1198 - 1208.
6. Seyedi H., Sanaye-Pasand M., New centralised adaptive load shedding algorithms to mitigate power system blackouts, Generation, Transmission & Distribution, lET, 2009, vol. 3, no. l, p. 99-114.
7. Gungor V.C., Bin L., Hancke G.P., Opportunities and challenges of wireless sensor networks in smart grid, Industrial Electronics, IEEE Transactions, 2010, vo1. 57, 10, p. 3557-3564.
8. Shahid B., Zubair A., Faroqi A., Navid-ur-Rehman R.M., Implementation of smart system based on smart grid smart meter and smart appliances, International Conference on Smart Grid Systems (ICSGS 2012), IPCSIT, IACSIT Press, Singapore, 2012, vol.45.
9. Moslehi, K., Kumar R., A Reliability Perspective of the Smart Grid, Smart Grid, IEEE Transactions on, you, 2010, l, p. 57-64.
10. Rashid R.A., Sarijari M.A., Rahim M.R.A., Yung T.Z., Flood transmission based protocol for home automation system via power line communication, Proceedings of the International Conference on Computer and Communication Engineering, 2008.
11. Book: Getting smart about smart meters answer book for residential customers, by power stream (Vender Company).
12. Henderson M., 56Kbps Data transmission across the PSTN, November 18, 1998, Document.
13. Navid-Ur-Rehman R.M., Ahmed Z., Faroqi A, Model of smart system based on smart grid, smart meter and wireless based smart appliances, IOSR Journal of Electrical and Electronics Engineering (IOSRJEEE), ISSN: 2278-1676, 2012 vol. 1, Issue 5, p. 06-10.
14. Natsheh E.M., Albarbar A., Yazdani J., Modeling and control for smart grid integration of solar/wind energy conversion system, This work was supported in part by Manchester Metropolitan University, School of Engineering and An-Najah National University Department of Computer Engineering.