Engineering, Environment
Effects of wood saw dust ash admixed with treated sisal fibre on the geotechnical properties of lateritic soil
John Engbonye SANI*1, Jacob Oyeniyi AFOLAYAN1, Ifeanyi Azuka CHUKWUJAMA1, Paul YOHANNA2
1Department of Civil Engineering, Nigerian Defence Academy, Kaduna, Nigeria
2Department of Civil Engineering, Ahmadu Bello University Zaria, Kaduna, Nigeria
E-mails: jesani@nda.edu.ng; ajoyeniyi@nda.edu.ng; iachukwujama@nda.edu.ng; paulyohanna45@yahoo.co.uk
*Corresponding author, phone: +2348038752773
Received: May 30, 2017 / Accepted: December 02, 2017 / Published: December 30, 2017
Abstract
The preliminary investigation conducted on the lateritic soil collected at Shika, Zaria shows that it falls under A-7-6 (10) classification for AASHTO (1986) and CL according to unified soil classification system USCS (ASTM 1992). The soil was treated with both wood saw dust ash (WSDA) and treated sisal fiber, in stepped concentration of 0,2,4,6, and 8% for WSDA and 0, 0.25, 0.5, 0.75 and 1% treated sisal fibre by dry weight of soil using Standard proctor. The Sisal Fibre was treated with Sodium Borohydride (NaBH4) (1% wt/vol) for 60 minutes at room temperature to remove the cellulose content present in the Fibre. Statistical analysis was carried out on the obtained results using XLSTART 2017 software and analysis of variance with the Microsoft Excel Analysis Tool Pak Software Package. The liquid limit (LL) of the soil was found to be 48% while the plastic limit(PL) is 21.27%. The maximum dry density(MDD)however, decreases generally from a value of 1.85 Mg/m3 to 1.68Mg/m3 at 0.25% sisal fiber content/0% WSDA. It has its least value of 1.57Mg/m3 at 1% sisal fiber and 8% WSDA. The OMC increased from 18 % of the natural soil to 23.7% at 0.75% sisal fiber / 6% WSDA content. There was a general increase in the value of UCS of the soil-sisal fibre mixture with WSDA content from 100 kN/m2 of the natural soil to 696 kN/m2 at 0.75 % sisal fibre content / 6% WSDA. The UCS value met the standard of 687-1373 kN/m2 requirements of sub base for adequate lime and cement stabilization, respectively (Ingas and Metcalf 1972).
Keywords
Lateritic soil; Wood saw dust ash; Sisal fibre; Sodium Borohydride (NaBH4); Analysis of variance (ANOVA)
Introduction
Laterite forms a valuable part of road pavement and it is used in other construction work extensively. But not all lateritic soils which constitute the sub-base and base materials are considered fit in terms of engineering design requirements [1]. Lateritic soils are soil types rich in iron and aluminium formed in wet and hot tropical areas. Nearly all lateritic soils are rusty red because of iron oxide. They are developed by intensive and long-lasting weathering of the underlying parent rock. Lateritic soil covers about one-third of the earth’s continental land area with the majority of it in land areas between the tropics of Cancer and Capricorn [2].
Soil stabilization refers to the procedure in which a soil, a cementing material, wood saw dust ash or other chemical materials is added to a parent soil to improve one or more of its properties. One may achieve stabilization by mechanically mixing the natural soil and stabilizing materials together to achieve a homogenous mixture or by adding stabilizing materials to an undisturbed soil deposit and obtaining interaction by letting it permeate through soil voids [3]. These chemical additives range from waste products to manufactured materials which may include Portland cement, wood saw dust ash, chemical stabilizers etc. cement and lime which are the most commonly used stabilizers are increasingly becoming exorbitant, the need to seek for an alternative low-cost stabilizer becomes imperative [3].
Wood saw dust ash is been considered an alternative for the purpose of this study as an alternative stabilizer, because of its accessibility and availability in large quantity. Saw dust is a waste material from the timber industry. It is produced as timbers are sawn into planks at saw mills located virtually in all major towns in the country. This process is a daily activity causing heaps of saw dust to be generated after each day. The need to convert this waste product into a useful by-product is the focus of this study.
Fibre reinforced soil is defined as a soil mass that contains randomly distributed discrete elements (fibres) which provide an improvement in the mechanical behaviour of the soil composite [4]. Fibre reinforced soil behaves as a composite material in which fibres of relatively high tensile strength are embedded in a matrix of soil. Fibre reinforcement is also widely used in construction engineering to improve the mechanical properties of soil because it increases the soil strength.
The present study investigates the properties of laterite reinforced with small size sisal fibres mixed with WSDA in varying. The aim of this study is to determine the effect of wood sawdust ash (WSDA) admixed with treated sisal fibre as a stabilizing material on the geotechnical properties of lateritic soil.
Materials and methods
Lateritic soil
The lateritic soil sample used for this study was collected by method of disturbed sampling from a borrow pit located at Shika in Zaria Local Government Area (Longitude 7⁰36' E Latitude 11⁰4' N). The top soil was removed to a depth of 0.5 m before the soil samples were taken, sealed in plastic bags to avoid loss of moisture and placed in sacks before transportation to the laboratory. The soil samples were then air-dried before lumps were broken to obtain particles passing BS No. 4 sieve (4.76 mm aperture). The properties of the natural soil are summarized in Table 1.
Table 1. Properties of the Natural Soil
|
Property |
Unit measure |
Quantity |
|
Percentage passing BS no 200 sieve |
% |
57.5 |
|
Natural moisture content |
% |
20.76 |
|
Liquid limit |
% |
48.00 |
|
Plastic limit |
% |
27.27 |
|
Plasticity index |
% |
20.73 |
|
Linear shrinkage |
% |
7.87 |
|
Free swell |
% |
19.09 |
|
Specific gravity |
g/cm3/ g/cm3 |
2.73 |
|
AASHTO classification |
- |
A-7-6(10) |
|
USCS |
- |
|
|
Maximum dry density, British Standard Light |
Mg/m3 |
1.58 |
|
Optimum moisture content, % British Standard Light |
% |
20.0 |
|
Unconfined compressive strength, British Standard Light |
kN/m2 |
164 |
|
Colour |
Reddish Brown |
- |
The soil belongs to the CL group in the Unified Soil Classification System [9] or A-7-6(10) soil group of the AASHTO soil classification system [10]. The oxide composition of the lateritic soil is shown in Table 2.
Table 2. Oxide composition of lateritic soil
|
OXIDE |
SiO2 |
Al2O3 |
K2O |
CaO |
Ti02 |
V2O5 |
Cr2O3 |
Fe2O3 |
MnO |
CuO |
ZrO |
L.O.I |
|
Concentration (%) |
47.1 |
17.40 |
0.48 |
0.17 |
3.69 |
0.070 |
0.035 |
19.04 |
0.054 |
0.065 |
0.966 |
10.3 |
Wood sawdust ash
Wood sawdust was gotten from the waste product of timber after cutting and filing of the timber while the ash was gotten from the burning of the shell under normal temperature until the sawdust turned ash, on a plain surface in other to avoid impurities from joining the admixture. The sawdust was completely burnt under atmospheric condition within a temperature range of 500 – 7000C measured with a thermocouple. The ash obtained was sealed in plastic bags and transported to the laboratory. The ash was passed through British Standard No 200 sieves (75 µm aperture) and kept to be mixed with the soil – Sisal fibre mixture in the appropriate percentages. The oxide composition of wood saw dust ash is shown in Table 3.
Table 3. Oxide composition of wood saw dust ash
|
OXIDE |
SiO2 |
SO3 |
Na2O |
K2O |
CaO |
TiO2 |
MnO |
Fe2O3 |
CuO |
ZnO |
SrO |
L.O.I |
|
Concentration (%) |
12.10 |
0.99 |
0.715 |
8.65 |
60.90 |
0.76 |
0.16 |
3.20 |
0.048 |
0.091 |
0.704 |
10.50 |
Sisal Fibre
Sisal fibre was gotten from central market in Kaduna metropolis in Kaduna state. Research work by [5] indicated that sisal fibre are bio-degradable materials because of the present of cellulose present in the fibre which when used for reinforcing soil can degrade at long time curing, therefore the sisal fibre used for this research work was treated with Sodium Borohydride (NaBH4) (1% wt/Vol) as recommended by [6].The choice of 3.5 cm length of sisal fibre is as a result of the recommendation made by [5] which stated that the peak values of strength gain in soil stabilized sisal fibre was obtained at 3.5 cm length, The property of the sisal fiber used is shown in Table 4.
Table 4. Properties of the sisal fibre
|
Property |
Unit measure |
Quantity |
|
Natural humidity |
% |
14.48 |
|
Average diameter |
mm |
0.13 |
|
Water absorption |
% |
340 |
|
Specific gravity |
g/cm3 |
0.22 |
|
Tensile Strength for One strand |
N/mm2 |
10.60 |
|
Tensile Strength for Two strands |
N/mm2 |
24.45 |
|
Tensile Strength for Three strands |
N/mm2 |
30.60 |
|
Elongation at break, |
mm |
5.58 |
|
Colour |
Shiny white |
|
Laboratory tests were conducted to determine the index properties of the natural soil and the treated soil in accordance with British Standards [7].
The work Algorithm is as shown in Figure 1, below.
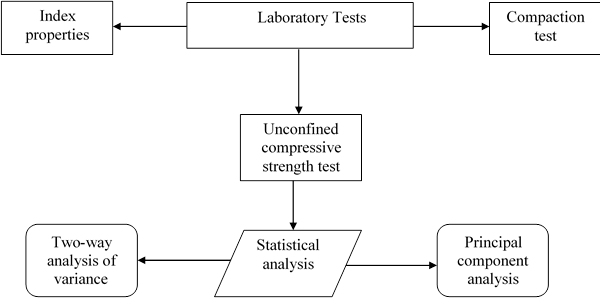
Figure 1. Working algorithm
Compaction
Tests involving moisture-density relationships carried out using the Standard Proctor energy level. The Standard Proctor effort consists of the energy derived from a 2.5kg rammer falling through 30cm onto three layers, each receiving 27 blows.
Unconfined compressive strength
Lateritic soil was treated with wood sawdust ash and treated sisal fibre in stepped concentrations of 0, 2, 4, 6 and 8 % as well as 0, 0.25, 0.5, 0.75, and 1.0 %, respectively. Thoroughly mixed air-dried soil – WSDA – Treated sisal fibre mixtures were compacted at optimum moisture contents (OMC) and compacted using standard Proctor (SP) energy. The compacted samples were extruded from the standard 1,000 cm3 mould using a cylindrical steel mould with height of 76 mm and internal diameter of 38 mm. The specimens were sealed in polythene bags and kept in the humidity room at a constant temperature of 25 ± 20C for 7 days curing period. The specimens were then placed in a load frame driven at a constant strain of 0.10 %/min until failure occurred. Three specimens were used for each test and the average result was taken.
Principal component analysis (PCA)
The principal component analysis (PCA) is a reduction tool that analyses data table where the observations are described using several inter-correlated quantitative dependent variables. It has been reported by [17] that Principal component analysis relies on the Eigen-decomposition of positive semi-definite matrices and upon the singular value decomposition (SVD) of rectangular matrices. The principle of PCA is centred on analysing a data table representing observations by describing the several sets of independent variables involved in which the dependent variable relies on and are inter-correlated. The aim is to extract the important information from the data table and to represent this information as a set of new orthogonal variables called principal components.
Two-way analysis of variance (Anova)
One way Anova is used to determine if different levels of factors measured observations differently therefore two way Anova is an extension of the one way Anova that take account of a second factor. The levels of this second factor are often determined by groupings of subjects or units used in the investigation.
The sum of observation in row can be obtained using Eq. (1):
![]() (1)
(1)
Where: TRi- sum of observation in row; xij- observations in (i j) cell of table.
The sum of observation in jth row can be obtained using Eq. (2):
![]() (2)
(2)
Where: Tcj= sum of observation in jth column; xij - observations in (i j) cell of table; c – numbers of column.
r = numbers of row
The sum of all ![]() observation in jth row can be obtained using Eq. (3):
observation in jth row can be obtained using Eq. (3):
![]() (3)
(3)
Where: TRi = sum of observation in ith row; Tcj = sum of observation in jth column; xij - observations in (i j) cell of table; c = numbers of column; r = numbers of row.
The total sum of squares can be obtained using Eq. (4):
![]() (4)
(4)
Where: SST = Total sum of squares; x2ij= sum of squares of all observations in (i j) cell of table; T2= square of the total sum of observation in either ith row or jth column; rc = Total number of observation
The total sum of squares between rows sum of squares can be obtained using Eq. (5):
![]() (5)
(5)
Where: SSR= between rows of sum of squares; T2Ri
= squares of sum
of observation in ith row; c = numbers of column; T2 = square
of the total sum of observation in either![]() row or jth
column; rc = Total number of observations;
row or jth
column; rc = Total number of observations;
The total sum of squares between columns sum of
squares![]() can be obtained using Eq. (6):
can be obtained using Eq. (6):
![]() (6)
(6)
Where: SSC = between columns sum of squares; T2Cj = squares of sum of observation in jth column; r= numbers of row; T2 = square of the total sum of observation in either ith row or jth column; rc = Total number of observation.
The Error (residual) sum of squares can be obtained using Eq. (7):
![]() (7)
(7)
Where: SSE = the Error (residual) sum of squares; SST = Total sum of squares; SSR = between rows sum of squares; SSC = between columns sum of squares.
The Mean square between rows can be obtained using Eq. (8):
![]() (8)
(8)
Where: MSR = Mean square between rows; SSR = between rows sum of squares; r = numbers of row;
The Mean square between columns can be obtained using Eq. (9):
![]() (9)
(9)
Where: MSC = Mean square between columns; SSC = between columns sum of squares; c = numbers of column.
The mean square error can be obtained using Eq. (10):
![]() (10)
(10)
Where: MSE = Mean square error; SSE = Error (residual) sum of squares; r = numbers of row; c = numbers of column.
The ![]() between the
row can be obtained using Eq. (11):
between the
row can be obtained using Eq. (11):
![]() (11)
(11)
Where: MSR = Mean square between rows; MSE = Mean square error;
The ![]() between the
column can be obtained using Eq. (12):
between the
column can be obtained using Eq. (12):
![]() (12)
(12)
Where: MSC = Mean square between columns; MSE = Mean square error
Results and Discussion
Tensile strength and elongation Test
The variations of the tensile strength and elongation test (using 3 strands sisal fibre) carried out on natural sisal fibre and treated sisal fibre Sodium Borohydride (NaBH4) (1% wt/Vol) as recommended by [6] after been buried in the lateritic soil for a period of 90 days are shown in Figures2 and 3.
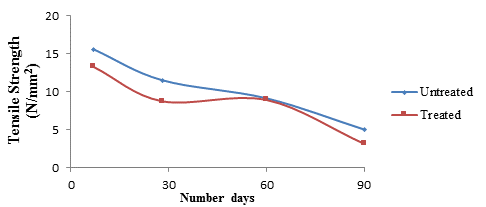
Figure2. Variation of tensile strength with days for untreated and treated sisal fibre
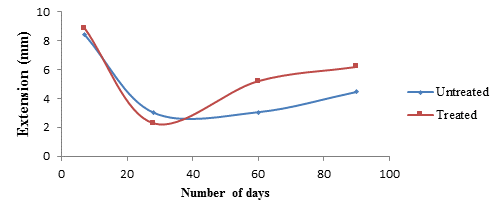
Figure3. Variation of elongation with days for untreated and treated sisal fibre
The tensile strength recorded by the untreated sisal fibre are higher than those of the treated sisal fibre after been buried in lateritic soil for a period of 28 days but beyond 30 days the differences is significantly low. This is because of the removal of the cellulose present in the sisal fibre by the Sodium Borohydride. The tensile strength for the untreated sisal fibre decreases from it natural value of 30.60 N/mm2 to 15.57 N/mm2 after 7 days and after 90 days it decreases to a value of 5.03 N/mm2. The tensile strength for the treated sisal fibre on the other hand decreases from 27.31 N/mm2 to 13.25 N/mm2 after 7 days and maintain a uniform strength for the next 60 days before decreases to a value of 3.15 N/mm2. This result indicates that the sisal fibre retains more long time strength after been treated with Sodium Borohydride.
The result of the elongation test carried out on the sisal fibre on the other hand shows that the ability of the treated sisal fiber to elongate or extent beyond it elastic limit increases which will make the treated sisal fiber perform better when subjected to axial load. Fig. 3 above shows that the values obtain for the treated sisal fibre are much higher than that of the untreated sisal fibre beyond 28 days of burying in the lateritic soil. Although there was an initial sharp decrease of the elongation value up to 28 days but beyond 28 days there was an increase i.e. from 3.02 mm to 4.45 mm for untreated sisal fibre and from 2.28 mm to 6.19 mm for the treated sisal fibre
Compaction characteristics
The variations of the maximum dry density (MDD) and optimum moisture content (OMC) of lateritic soil – sisal fiber mixtures with wood saw dust ash (WSDA) are shown in Figs. 4 and 5, respectively.
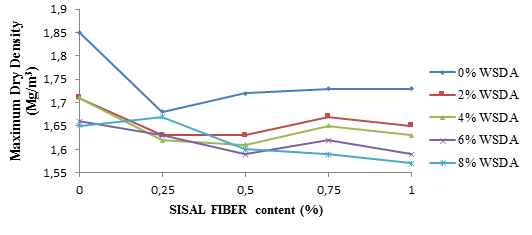
Figure 4.Variation of maximum dry density of lateritic soil – WSDA contents mixtures with sisal fibre contents
The MDD (see Figure 4) decreased from 1.85 to 1.57 Mg/m3 at 1 % sisal fibre / 8 % WSDA contents.
The reduction may be because of WSDA (with high calcium oxide) on the workability of the stabilized soil and also attributed to the WSDA and sisal fibre having low density as compared to the density of the soil and thus reducing the average unit weight of the solids in the mixture and making compaction difficult because the WSDA and sisal fibre occupy more space thereby creating voids within the mixture. The trend of decreasing MDD with admixture contents was reported by [11-14].
Other probable reasons for the drop in MDD may be due to the flocculated and agglomerated clay particles.
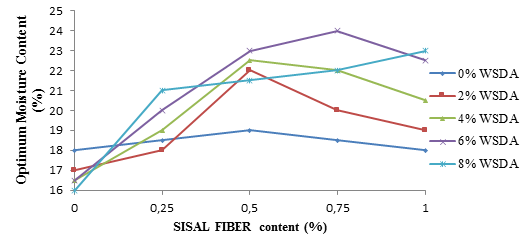
Figure 5. Variation of optimum moisture content of lateritic soil – WSDA contents mixtures with sisal fibre contents
The optimum moisture content (OMC) generally increased with increase in the admixtures (i.e. sisal fibre and WSDA). The OMC increased from 18% to 24 % at 0.75% sisal fibre / 6 % WSDA (see Figure 5).
Upon further increase in the fibre content, the OMC reduced as the sisal fibre content increased. This means that the fibre, which naturally had a high-water absorption rate, caused an initial increase in OMC from the plain state of the soil to 0.5% content of the fibre by dry weight of soil and thereafter reduced the OMC with increasing aspect ratio and percentage content. Similar trends were observed by [11-12] who used laterite soil and black cotton soils respectively
A two-way analysis of variance (ANOVA) for maximum dry density (MDD) of lateritic soil- WSDA mixtures with Sisal fibre content are summarized in Table 5.
Table 5. Two-way analysis of variance results for compaction characteristics of lateritic soil-WSDA mixtures with Sisal fibre content
|
Property |
Source of variation |
FCAL |
P-value |
F CRIT |
Remark |
|
MDD |
WSDA |
15.91581 |
1.96E-05 |
3.006917 |
FCAL > F CRIT SS |
|
SF |
7.328924 |
0.001492 |
3.006917 |
FCAL > F CRIT SS |
|
|
OMC |
WSDA |
3.552156 |
0.029497 |
3.006917 |
FCAL > F CRIT SS |
|
SF |
10.64534 |
0.000211 |
3.006917 |
FCAL > F CRIT SS |
The results show that the effect of waste saw dust ash and sisal fibre on the maximum dry density were statistically significant (FCAL = 15.91581> FCRIT = 3.006917) for WSDA and (FCAL = 7.328924> FCRIT = 3.006917) for sisal fibre. The effect of WSDA was more pronounced than that of sisal fibre.
A two way analysis of variance for optimum moisture content (see Table 5) shows that the effect of waste saw dust ash and sisal fibre on the optimum moisture content were statistically significant (FCAL = 3.552156> FCRIT = 3.006917) for WSDA and (FCAL = 10.64534> FCRIT = 3.006917) for sisal fibre, with sisal fibre having a more pronounced effect.
Unconfined compressive strength
The variation of unconfined compressive strength (UCS) of lateritic soil – sisal fiber mixtures with wood saw dust ash (WSDA) for 7 days curing periods is shown in Figure 6.
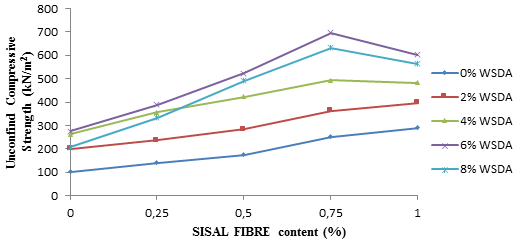
Figure 6. Variation of unconfined compressive strength of lateritic soil – WSDA contents mixtures with sisal fibre contents
For all the WSDA contents considered, peak UCS values were recorded at 0.75 % sisal fibre content.
Although the 7-day UCS value were lower than the 1720 kN/m2 for adequate cement stabilization of base courses specified by [15], however, meet the requirement of 687–1373 kN/m2 for sub-base as specified by [16]. The trend recorded was similar to that obtained by [11] who obtained the highest deviator stress values at 0.75 % and at 3.5 cm fibre lengths [12] obtained their peak at 0.50 % fibre inclusion.
A two-way analysis of variance (ANOVA) for unconfined compressive strength (UCS) of lateritic soil- WSDA mixtures with Sisal fibre content are summarized in Table 6.
Table 6. Two-way analysis of variance results for unconfined compressive strength of lateritic soil- WSDA mixtures with Sisal fibre content
|
Property |
Source of Variation |
FCAL |
P-value |
F CRIT |
Remark |
|
UCS |
WSDA |
26.31745 |
7.29E-07 |
3.006917 |
FCAL > F CRIT SS |
|
SF |
24.10031 |
1.33E-06 |
3.006917 |
FCAL > F CRIT SS |
The results show that the effect of waste saw dust ash and sisal fibre on the unconfined compressive strength were statistically significant (FCAL = 26.31745> FCRIT = 3.006917) for WSDA and (FCAL = 24.10031> FCRIT =3.006917) for sisal fibre. The effect of WSDA was more pronounced than that of sisal fibre
Principal component analysis (PCA)
The correlation between variables and factors for unconfined compressive strength is shown in Table 7 while Figure 7 and 8 shows the variable plot and Biplot for unconfined compressive strength variation with soil variables.
Table 7. Correlation between variables and factors for unconfined compressive strength
|
Variables/Factors |
F1 |
F2 |
|
WSDA |
0.681 |
-0.678 |
|
SF |
0.634 |
0.713 |
|
MDD |
-0.861 |
0.267 |
|
OMC |
0.867 |
0.222 |
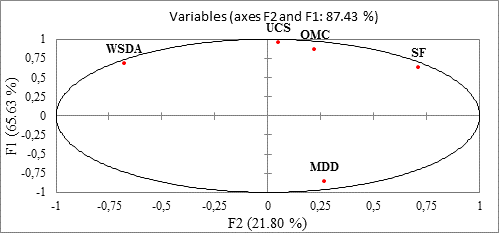
Figure 7. Variable plot for unconfined compressive strength variation with soil variables
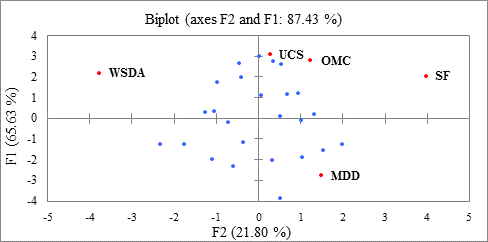
Figure 8. Biplot for unconfined compressive strength variation with soil variables
The principal component analysis for unconfined compressive strength (UCS) and the relevant soil variables was done by assuming the dependent variable (UCS) and the independent variables (Wood Saw Dust Ash(WSDA); Sisal Fibre(SF); Maximum Dry Density(MDD) and Optimum moisture content(OMC)). Their inter-correlation is presented in Table 7 as principal components (i.e F1, F2).Results show that for principal component 1 (F1) the OMC followed by SF and WSDA significantly influences the UCS of the soils samples. In the case of MDD a strong and negative relationship exist between MDD and UCS with negative coefficient in principal component 1(F1). Generally, this implies that these variables should be carefully monitored during field compaction, specification and control to achieved maximum performance of the road pavement, embankment or in any geotechnical application.
Considering the principal component 2(F2) it is evident that the SF only significantly influence the UCS of the soils. A negative relationship was recorded for WSDA and UCS while MDD and OMC have low and positive relationship with UCS of the treated soils. Figure 6 and 7 shows the variable and biplot plot from principal component analysis between UCS and the soil variables (WSDA, SF, MDD and OMC). It was observed that principal component 1(F1) influences the UCS of the soils by 65.63% (see Fig. 7 and 8) while principal component 2 (F2) contributed by 21.80% to the UCS values of the soils. This implies the 65.63% of the value of UCS of the soil is contributed by the OMC, WSDA and SF. Alteration of these variables greatly affects the UCS of the soils samples. While 21.80% of the value of UCS is accounted for by the MDD of the treated soils.
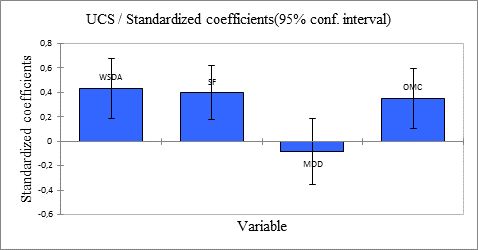
Figure 9. Standardized coefficients of the variables at 95 % confidence
The standardized coefficient of each of the variables used in this analysis at 95 % confidence of interval is as shown in Figure 9. The plot shows a graphical contribution of each of the parameters to the unconfined compressive strength.
The eigenvalues, eigenvectors and percentage contribution of each of the variables to the unconfined compressive strength is shown in Tables 8, 9 and 10 respectively.
Table 8. Eigenvalues of the variables with unconfined compressive strength
|
Indicator |
F1 |
F2 |
F3 |
F4 |
F5 |
|
Eigenvalue |
3.281 |
1.090 |
0.304 |
0.246 |
0.078 |
|
Variability (%) |
65.627 |
21.804 |
6.086 |
4.920 |
1.563 |
|
Cumulative % |
65.627 |
87.431 |
93.517 |
98.437 |
100.000 |
Table 9. Eigenvectors of the variables with unconfined compressive strength
|
Variables |
F1 |
F2 |
F3 |
F4 |
F5 |
|
UCS |
0.530 |
0.048 |
0.054 |
0.334 |
0.776 |
|
WSDA |
0.376 |
-0.649 |
-0.039 |
0.501 |
-0.429 |
|
SF |
0.350 |
0.682 |
-0.451 |
0.272 |
-0.367 |
|
MDD |
-0.476 |
0.256 |
0.462 |
0.703 |
-0.025 |
|
OMC |
0.479 |
0.212 |
0.760 |
-0.264 |
-0.279 |
Table 10. Contribution of the variables (%) to the unconfined compressive strength
|
Variables |
F1 |
F2 |
|
WSDA |
14.141 |
42.127 |
|
SF |
12.240 |
46.574 |
|
MDD |
22.610 |
6.555 |
|
OMC |
22.905 |
4.515 |
The eigenvalue is a measure of variability of the variables i.e how much the variables are spread out in the data set.
Table 8 shows that wide variation in the variables were recorded for principal component 1(F1) followed by principal component 2(F2), 3(F3), 4(F4) and 5(F5) respectively. The numerical values of the eigenvalues show that principal component 1(F1) has the highest value of 3.281. To buttress this relationship, the percentage variability (see table 8) shows that principal component 1(F1) recorded 65.627% variability in the data set which is the highest for all principal components.
The values of the eigenvectors presented in Table 9 depend on the eigenvalues. The higher the eigenvalues, the higher the eigenvector. The eigenvector with the highest eigenvalue is the principal component.
Table 10 shows the percentage contribution of the independent variables (Wood Saw Dust Ash (WSDA); Sisal Fibre (SF); Maximum Dry Density (MDD) and Optimum moisture content (OMC) to the Unconfined compressive strength (UCS) of the treated soil. Results show that in principal component 1(F1) OMC (22.905) and MDD (22.610) significantly influence the UCS of the treated soil while in principal component 2(F2), WSDA (42.127) and SF (46.574) significantly affect the UCS of the treated soil
Conclusion
Investigation carried out showed that the natural soil belongs to A-7-6(10) or CL based on AASHTO and USCS Classification Systems, respectively. Treated sisal fiber with Sodium Borohydride reduces the tensile strength of the fiber but increases its elongation ability which makes the sisal fiber withstand axial load for long time.
Results shows that MDD generally decreased upto0.5% fibre content while the OMC of the treated soil admixed with Wood saw dust ash and sisal fiber peaked at 0.75% sisal fibre / 6 % WSDA. The UCS value of 696.63 kN/m2recorded at 0.75% sisal fibre / 6 % WSDA meet the minimum regulatory requirement of 687–1373 kN/m2 for sub-base materials.
Results of two-way analysis of variance (ANOVA) for unconfined compressive strength (UCS) of lateritic soil- WSDA mixtures with Sisal fibre content shows that the effect of WSDA was more pronounced than that of sisal fibre. Principal Component Analysis shows that 65.63% of the value of UCS of the soil is contributed by the OMC, WSDA, SF and MDD. This implies that these variables (OMC, WSDA, SF and MDD) must be carefully monitored during field compaction, specification and control to achieved maximum performance of the road pavement, embankment or in any geotechnical application. An optimal blend of 0.75% sisal fibre / 6 % WSDA is recommended for treatment of lateritic soils for used as a sub base material in road construction.
Reference
1. Eberemu A.O., Edeh J.E., Gbolokun A.O., The geotechnical properties of lateritic soil treated with crushed glass cullet, Advance Materials Research, 2013, 824, p. 21-28.
2. Ugbe F.C., Basic engineering geological properties of lateritic soils from western Niger Delta, Research Journal of Environmental and Earth Sciences,2011, 3(5), p.571-577.
3. Amadi A.A., Evaluation of changes in index properties of lateritic soil stabilized with fly ash, Leonardo Electronic Journal of Practices and Technologies, 2010, 17, p. 69-78.
4. Li C., Mechanical response of fiber-reinforced soil, PhD thesis, Faculty of the Graduate School of The University of Texas at Austin, 2005.
5. Tanko A., Effect of inclusion of randomly oriented sisal fibre on the properties of lateritic Soil, Unpublished M.Sc. Thesis, Department of Civil Engineering, Ahmadu Bello University, Zaria, 2015.
6. Moraes A.G.O., Sierakowski M.R., Abreu T.M., Amico S.C., Sodium borohydride as a protective agent for the alkaline treatment of sisal fibers for polymer composites, Composite Interfaces,2011, 18, p. 407–418.
7. BS 1377, Methods of testing soils for civil engineering purposes, British Standard Institution, London.1990.
8. BS 1924, Methods of test for stabilized soils, British Standards Institute, London, 1990.
9. ASTM, Annual book of Standards, vol. 04.08, American Society for Testing and Materials, Philadelphia, 1992.
10. AASHTO, Standard specification for transport materials and method sampling and testing, 14th Edition, American Association of State Highway and Transport Officials, Washington DC.1986.
11. Prabakar J., Sridhar R.S., Effect of random inclusion of sisal fiber on strength behaviour of soil, Construction and Building Materials, 2002, 16, p. 123–131.
12. Santhi K.K., Sayida M.K., Behaviour of black cotton soil reinforced with sisal fibre, 10th National Conference on Research, Science, 2009, 1(1), p. 01-06.
13. Chegenizadeh A., Nikraz. H.R., Composite soil: Fiber inclusion and strength, Advanced Materials Research. 2011, 308-310, p.1646-1650.
14. Osinubi K.J., Bafyau V., Eberemu A.O., Bagasse ash stabilization of lateritic soil, Proc. of the First Inter. Conf. on Environ. Res., Techn. And Policy, Accra, Ghana, 2007, p.1 - 17.
15. TRRL, A guide to the structural design of bitumen surfaced roads in tropical and sub – tropical countries, Transport and Road Research Laboratory, Road Note 31, H. M. S. 0. London, 1977.
16. Ingles O.G., Metcalf J. B., Soil stabilization principles and practice, Butterworths, Sydney, 1972.
17. Herve A., Lynne J.W., Principal component analysis, A Review, John Wiley and Sons, Inc. DOI: 10.1002/wics.101., 2010, 2, p.433-459.