Engineering, Environment
Control and performance analysis of grid connected photovoltaic systems of two different technologies in a desert environment
Layachi ZAGHBA, Messaouda KHENNANE, Abdelhalim BORNI, Amor FEZZANI
Unité de Recherche Appliquée en Energies Renouvelables, URAER, Centre de
Développement des Energies Renouvelables, CDER, 47133, Ghardaïa, Algeria
E-mail(s): layachi40@yahoo.fr
* Corresponding author, phone: 00(213)029 87 01 26, fax: 00(213)029 87 01 46
Received: January 13, 2017 / Accepted: November 25, 2017 / Published: December 30, 2017
Abstract
In this study, is to investigate the effect of real climatic conditions on the performance parameters of a 9 kWp grid connected photovoltaic plant during one-year using typical days installed in the desert environment in south of Algeria (Ghardaia site). The PV plant contain the following components: solar PV array, with a DC/DC boost converter, neural MPPT, that allow maximal power conversion into the grid, have been included. These methods can extract maximum power from each of the independent PV arrays connected to DC link voltage level, a DC/AC inverter and a PI current control system. The PV array is divides in two parallel PV technology types; the first includes 100 PV modules mono-crystalline silicon (mc-Si) arranged in 20 parallel groups of 5 modules in series, and the second of composed of 24 amorphous modules (Inventux X series), arranged in 6 parallel groups of 4 modules in series. The proposed system tested using MATLAB/SIMULINK platform in which a maximum power tracked under constant and real varying solar irradiance. The study concluded that output power and energy from two PV technology types (mc-Si and Amorphous-Si) increases linearly with increase of solar irradiance.
Keywords
Grid-connected PV system; Performance evaluation; PV technology types; Neural MPPT control strategy; Boost converter; Desert environment
Introduction
As the conventional fuel, resources throughout the world continue to reduce, the promising renewable energy resources as photovoltaic energy technologies have been widely used to compensate the depletion of the conventional fuel resources [1-2]. Renewable energy uses inexhaustible flow of natural energy sources (sun, wind, water, plant growth). These energies of the future not yet cover only 22% of global electricity consumption with the importance of hydropower, which accounts for three quarters of electricity from renewable energy. The main advantages of renewable energy are not their inexhaustible and their very limited emissions of greenhouse gases as evidenced by the analysis of the life cycle of exploitation [3-5]. PV system installation has played an important role in worldwide and becoming one of the most popular sources since it is clean, inexhaustible, environment friendly, secure energy sources and requires little maintenance. The geographical location of Algeria promotes the development an ambitious program launching in 2012 for development of renewable energy and energy efficiency. This program includes of installing a renewable power of nearly 22 000MW between 2012 and 2030, will be dedicated to cover the national demand for electricity [6–8]. In 2030, about 40% of the production of electricity for domestic consumption is from renewable sources [8]. The average annual irradiation levels in Algeria are around 2000kWh/m2. In the Local of study (Ghardaia site), the global horizontal solar radiation is varied between 3 kWh/m2/day and 7.4 kWh/m2/day, with annual average value of 5.4 kWh/m2/day [9]. Variations in solar radiation level and ambient temperature from each season and year-to-year influence the PV system performance. Therefore, it need to be considered and is important to identify the effects of climate during different seasons and which performance are suitable for which system evaluations based on their weather-dependence.
The focus of this present work is to study the effect of the real climatic conditions on the performance of a 9 kWp grid connected photovoltaic plant during one-year of 2013 using typical days with variation in different seasons using two different PV technology under an environmental condition of Algeria (Ghardaia site).
The main contributions of this paper are:
· Input real experimental weather data of the location site (irradiation and temperature) applied to analysis and evaluation the impact of desert environment on the performance of grid connected photovoltaic plant during twelve typical days using two PV array technology types (Amorphous and Monocrystalline Solar PV panels);
· Neural network mode based MPPT control is proposed;
- The method exhibits good transient performance and fast convergence.
Material and method
Principle of the method
In this paper, maximum power point tracking (MPPT) of a photovoltaic system using artificial neural network control is developed and simulated in MATLAB SIMULINK at varying atmospheric conditions to increase the output power of a photovoltaic system.
The inputs variables for ANN are the output PV current and output PV voltage corresponding to a given insolation and operating cell temperature conditions, which they have significant influence on the ANN response; the output variable of ANN is the corresponding normalized increasing or decreasing duty cycle. The proposed neural network MPPT is tested and validated using Matlab/Simulink model for different atmospheric conditions.
Location of study area
The study region id located in the southern of Algeria (Latitude 32.23°N, Longitude 3.45°E, Altitude 600 km).
The measured data are recorded averaged every 5 min and stored on a disk for analyzing and evaluating of the various climatic parameters (Figure 1).
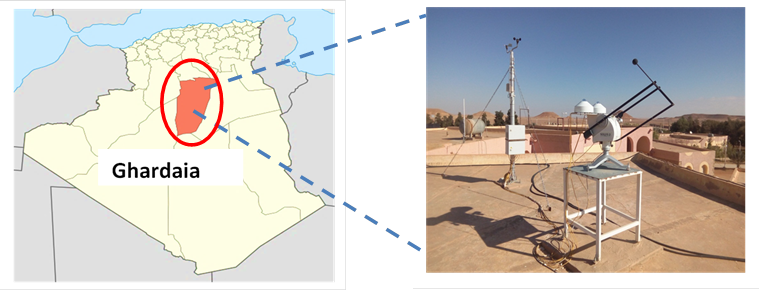
Figure 1. Solar photovoltaic station in Algeria map
For irradiation measurement, the measured data on solar radiation used in the present study were recorded collected by a radiometric station with high precision installed on the solar radiation laboratory roof of applied research unit for renewable energies (URAER).
Real sun irradiance and temperature profile of studied location are presented above in Figure 2 and 3.
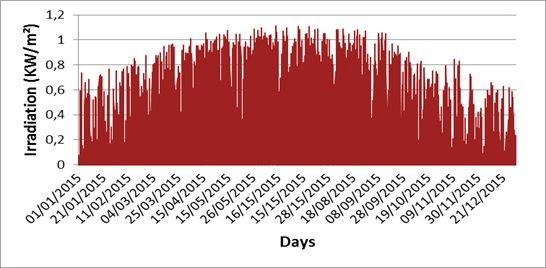
Figure 2. Real sun irradiance profile during full one year (2015)
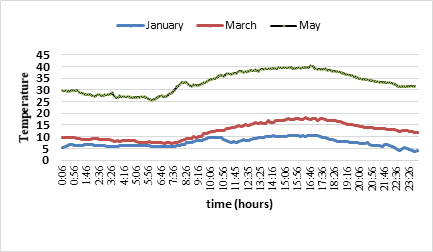
Figure 3. Real temperature profile for three months of studied location (2015)
The daily meteorological output parameter data (temperature, irradiance) were acquired and recorded with a time step of 5 minutes using Agilent 34970A data logger via RS485 interface.
The meteorological parameters that were monitored include: solar irradiance (measured at plane of sub-array) and ambient air temperature.
PV plant description
The conception of three-phase grid-connected PV system is shown in Figure 4.
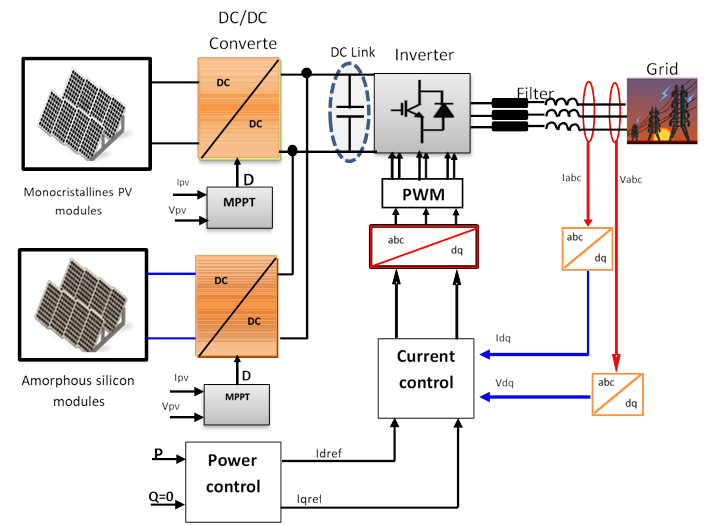
Figure 4. Schematic block circuit diagram of the grid connected PV system
The solar energy converted to DC electricity by PV arrays, and converted to AC electricity by inverter after dc-dc boost converter, the neural network MPPT control to extract the maximum power point at each sub system array and a voltage DC link capacitor, then supplied to the grid through the harmonic filter circuit RL.
PV array modelling
The electrical properties of the modules summarized in Table 1.
Table 1. Specification of the two different technology modules used
|
PV Module technologies |
Mono-crystalline modules |
Amorphous silicon modules |
|
Maximum Power (PPV) |
60 W |
125 W |
|
Voltage at Pmax (VMPP) |
17.1 V |
1 V |
|
Current at Pmax (MPP) |
3.5A |
125A |
|
Open Circuit Voltage (Voc) |
21.1V |
165V |
|
Short Circuit Current (Isc) |
3.8 A |
1.14A |
The PV array is divides in two PV technology types; the first includes 100 PV modules mono-crystalline silicon (mc-Si) of 60 W arranged in 20 parallel groups of 5 modules in series, and the second of composed of 24 amorphous modules (Inventux X series) of 125 W, arranged in 6 parallel groups of 4 modules in series. Both PV arrays are set in a fixed tilt of 320 with azimuth of 00 (south).
DC–DC Boost converter model
The input source is DC Type (Inductor in series with a voltage source) and output load voltage type continuous (capacitor in parallel with the resistive load) as presented in Figure 5.
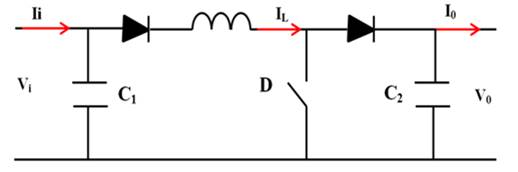
Figure 5. DC-to-DC Boost Converter
The DC-DC converter is capable to elevate the voltage without changing the polarity respecting to a common ground. It therefore behaves as an autotransformer that operates in continued current DC. By adding to its control loop, we obtained a stabilized output voltage.
The mathematical model using Kirchhoff’s laws around the two loops (transistor switching on off), in Eq. (1) [10-11]:
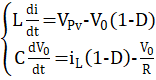 (1)
(1)
Where: L- DC-DC converter inductance; C - DC-DC converter capacity; iL- inductance current; D - Duty-cycler; Vpv - photovoltaic panel output voltage; V0 - DC-DC converter output Voltage.
MPPT by Using Neural Network
Artificial neural network has memory, which include to the weights in the neurons.
The weights and biases of the network tuning by the learning rate in order to move the network output closer to the targets. To find the output optimal voltage, the Feed-forward neural network
Architecture MPPT control proposed shown in Figure 6.
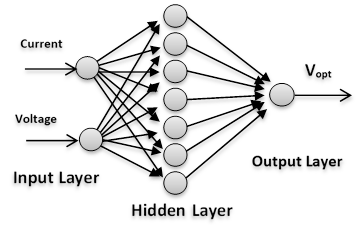
Figure 6. Feed-forward neural network architecture
Inputs are the current and voltage of PV generator [12–15]. In this work, Artificial Neural Network (ANN) have been developed to track the maximum power point [16–17].
The relationship between the inputs and output formulated as, Eq. (2):
![]() (2)
(2)
Where: x - neural inputs, Wi - neuronal network weights, y - the output of the system.
Back propagation algorithm used to update the weights and biases and to minimize a mean squared-error performance index given as, Eq. (3):
![]() (3)
(3)
Where: J - the criterion to be minimized; yides - the i- th desired output of the system; yi - the i- th output of the system.
The update of weight Wi is done according to the following rule, Eq. (4):
![]()
![]() (4)
(4)
Where: wijk is the weights in in the layer K; t - is the time; Δw - is the variations of the weights.
Grid side control
The following equations describe the voltage of balanced three-phase power grid, Eq. (5) [18-19]:
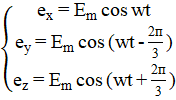 (5)
(5)
Where: Em - the maximum value of power grid voltage; w - the angular frequency of power grid; suppose L2=L3=L4=L, R1=R2=R3=R.
To study the system connected to the grid in Figure 3, standard Kirchhoff’s voltage law is given, thus the voltage at the grid side of the converter described as Eq. (6) [18-19]:
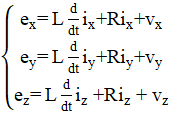 (6)
(6)
Where: exyz - grid three phase’s voltages; vxyz - inverter three phase’s voltages; L - filter inductance; R - filter resistance.
Using park transformation, from three phase stationary abc reference frame to two phases synchronous rotating dq reference frame, Eq. (7).
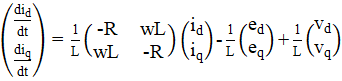 (7)
(7)
Where: L - filter inductance; R - filter resistance; edq - grid voltage (park transformation); vdq - inverter voltage (park transformation).
From the above d-q mathematical model, the decoupling of the d-axis and q-axis variables makes it complex to design the controller. The voltage drops due to the line impedance compensated using a PI regulator in each loop.
The control equations are as below Eq. (8) [18-19]:
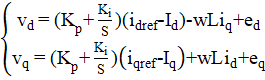 (8)
(8)
Where: L - filter inductance; edq - grid voltage (park transformation); vdq - inverter voltage (park transformation); Kp and Ki - gain of the PI regulator; Idred and Iqref - reference current (park transformation); Id and Iq - measured current (park transformation).
The active power P and reactive power Q under dq synchronous rotating reference frame expressed as below Eq. (9) [9]:
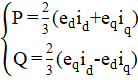 (9)
(9)
Where: P - Active power; Q - Reactive power; edq - grid voltage (park transformation); vdq - inverter voltage (park transformation).
If d-axis is positioned as grid voltage synthesized vector, namely eq=0, equation (9) can be expressed as follows Eq. (10) [18-19]:
 (10)
(10)
Where: P - Active power; Q - Reactive power; edq - grid voltage (park transformation); Id and Iq - grid current (park transformation).
The decoupled current control scheme of grid-connected inverter is shown in Figure 7.
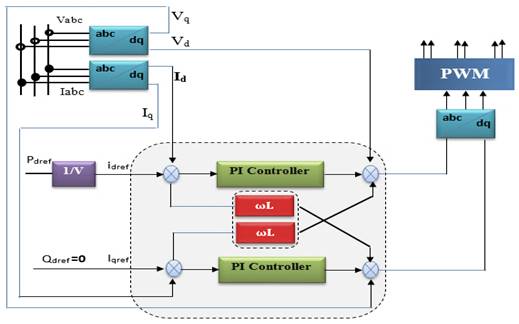
Figure 7. The control scheme of grid-connected inverter
Results and discussion
In order to present, the effects of variation in solar irradiation and temperature on grid connected photovoltaic performance, under real outdoor daily operating condition for one year 2013 (using typical days), are shown in Table 2.
Table 2. Typical days used
|
Months |
Type of days |
Months |
Type of days |
|
January |
17-01-2013 |
July |
17-07-2013 |
|
February |
16-02-2013 |
August |
16-08-2013 |
|
March |
15-03-2013 |
September |
16-09-2013 |
|
Avril |
13-04-2013 |
October |
15-10-2013 |
|
May |
22-05-2013 |
November |
15-11-2013 |
|
June |
11-06-2013 |
December |
10-11-2013 |
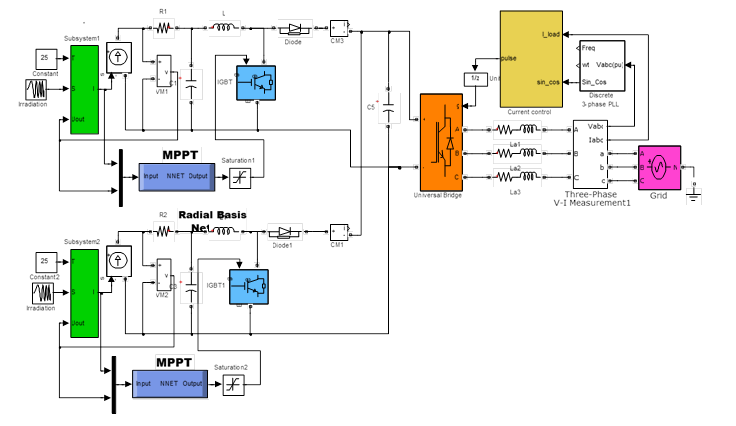
Figure 8. Simulink model of grid connected PV system
Complete Matlab/Simulink simulation of the grid connected PV System with the Neural MPPT algorithm and the power active and reactive control of the grid-side inverter controlled by the PI current regulator with the following parameters (see Figure. 8).
- The PV array is divides in two PV technology types; the first includes 100 PV modules mono-crystalline silicon (mc-Si) of 60 W arranged in 20 parallel groups of 5 modules in series, and the second of composed of 24 amorphous modules (Inventux X series) of 125 W, arranged in 6 parallel groups of 4 modules in series.
- The DC-link capacitance: C= 22000e-6 F.
- The grid filter: R= 0.1 Ω, L= 3e-3 H
- The grid voltage: 400/50 Hz.
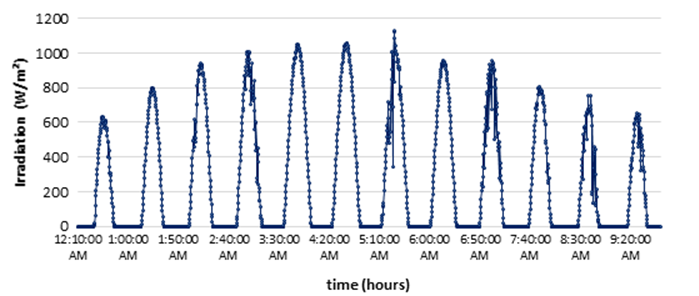
Figure 9. Real sun irradiance of studied location using typical days
Sun irradiance during one year of studied location using typical days (year 2013) presented in Figure 9. To simulate the system, the PV model described above implemented in Matlab Simulink and placed in real outdoor conditions of irradiation and temperature, and the neural network controller has been defined and designed using the box neural network tools.
All Simulation results above show that the system controlled by the neural network adapts to changing external disturbances and show their effectiveness not only for continued maximum power point but also for response time and stability after a transient regime of time equal to 10 ms. The different electrical parameters (power, voltage and current) stabilize to optimal values. The power provided by the first PV generator stabilizes around 6 kW and the second PV generator stabilizes around 3 kW at G=1000 W/m² (Figure 10).
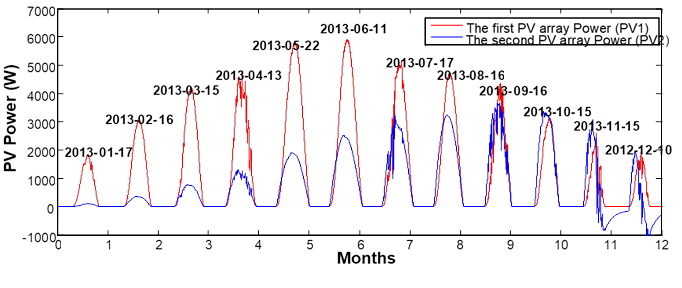
Figure 10. Annual PV array Power (PV1 and PV2) using typical days (2013)
As shown in Figure 10, at G=1000W/m² ant T=250C, the maximum output power of first PV system is 6000 W and the second PV system is 3000 W.
Figure 11, present the annual PV array current (PV1 and PV2) during one-year using typical days (2013).
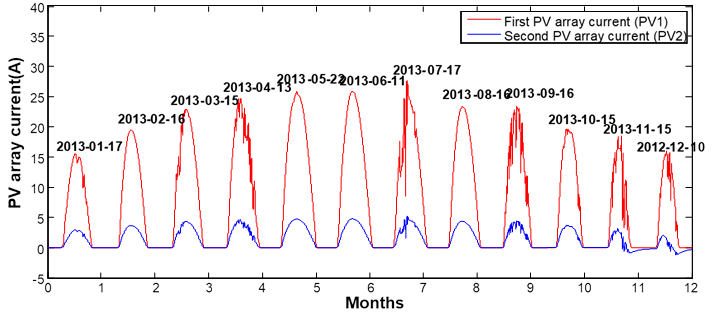
Figure 11. Annual PV array current (PV1 and PV2) using typical days (2013)
The current provided by the first PV generator stabilizes around 25 A, and the second PV generator stabilizes around 5 kW at G=1000 W/m² (Figure 11).
In Figure 12 the current loop controller is validate and can be seen that the Id and Iq measured signals are tracking very well their references after a very short time.
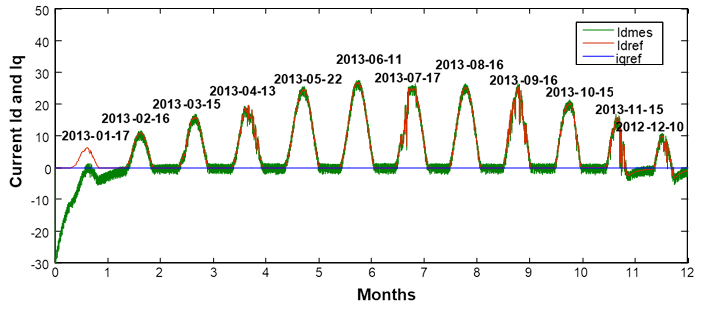
Figure 12. Id current reference and measured (Id and Iq) using typical days (2013)
We note that the effect of the rapid increase in power caused by increased irradiation. The overall results show that the DC-DC converter and MPPT control properly perform their roles. The converter provides optimal conditions in a voltage at its output than that provided by the PV array. The MPPT control adjusts the PV array to the charge transfer maximum power provided by the PV generator.
Figure 13, show the sinusoidal three current waveforms on the grid side (Iabc) during one-year using typical days (2013).
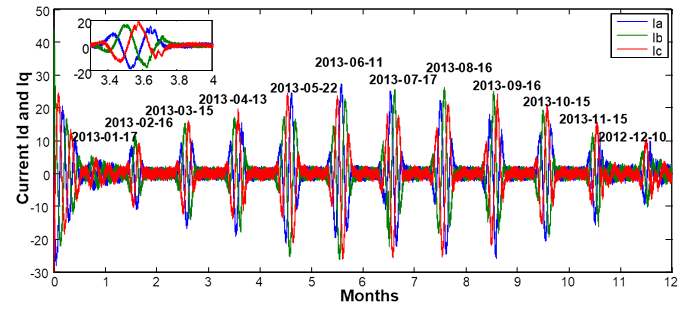
Figure 13. Current waveform on the grid side (Iabc) using typical days (2013)
The figure 13 shows the characteristics of the three-phase currents injected into the network (Iabc). They have almost sinusoidal waveform. The increase and decrease of the current "Iabc" reflects the variation of the irradiation. Increasing the intensity of sunlight causes an increase in power.
Figure 14, shows the voltage waveform on the inverter side during one-year using typical days (2013)
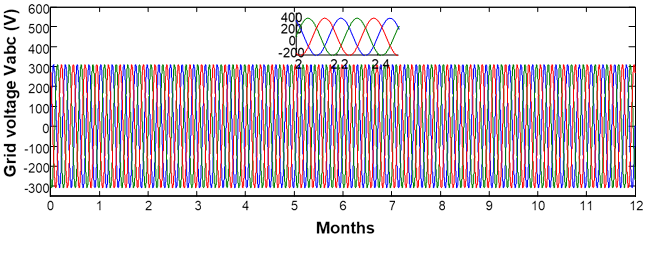
Figure 14. Voltage waveform on the inverter side using typical days (2013)
It can be seen from Figure 14, the three-phase voltages of the network have a sinusoidal shape of the same frequency 50 Hz, phase shifted by 2 π / 3, and having the same effective value 220 V, form a balanced three-phase system.
Figure 15 present the profile active and reactive power which is null during one-year using typical days during one-year (2013).
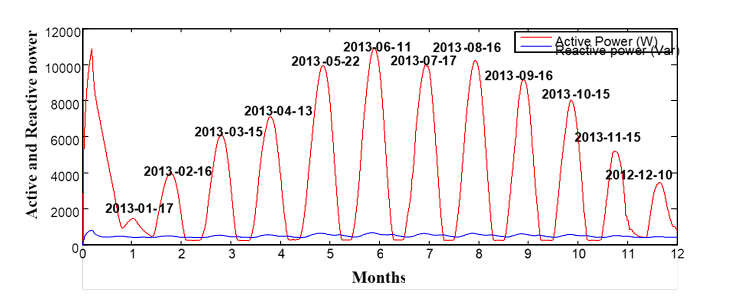
Figure 15. Active and reactive power using typical days (2013)
Figure 15 shows daily production for each month for one year for tow PV array (PV1 and PV2). It can be noted that the maximum value of energy is in the summer period (June-August).
Figure 16 shows the daily PV array energy for one year (2013), where serie 1 represent the first PV array (PV1) and Serie 2 represent second PV array (PV 2).
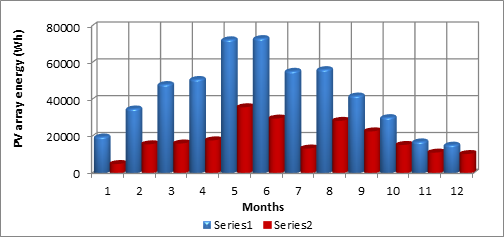
Figure 16. Daily PV array energy (2013)
Figure 16 describe the daily PV array energy for one year (2013) for tow PV array (PV1 and PV2). It is noted that the energy produced is much higher during the in the summer period (June-August) compared to the winter season (December-February), because the solar illumination received at the level of the photovoltaic field is very high in this season.
Conclusions
In this paper, an experiment to assess the performance of a grid connected system PV under real conditions of exploitation in a desert environment of two different technologies (Amorphous and Monocrystalline Solar PV panels).
The neural network based MPPT control has clearly demonstrated its utility and the effectiveness in tracking the maximum power point of the photovoltaic power plant. The simulation results obtained of the whole system done in Matlab-Simulink have shown an excellent performance, high efficiency, low error, very short response time, high dynamics for both inverter and MPPT, the DC bus voltage and the power output value from two PV technology types.
Appendix
The following Matlab code creates a feed-forward neural network:
P= [Current Data; Voltage Data];
T= [Optimal voltage data];
net=newff(minmax(P),[40,3,1], {'tansig','tansig','purelin'},'traingd');
net.trainParam.epochs=1000;
net.trainParam.goal=1e-3;
net.trainParam.show=50;
net.trainParam.lr=0.05;
[net,tr]=train(net,P,T);
a=sim(net,P)
gensim(net)
References
1. Zebirib F., Kessala A., Rahmanib L., Chebabhia A., Analysis and design of photovoltaic pumping system based on nonlinear speed controller, Journal of Power Technologies, 2016, 96 (1), p. 40-48.
2. Bajpai P., Dash V., Hybrid renewable energy systems for power generation in stand-alone applications: a review, Renewable and Sustainable Energy Reviews, 2012, 16 (5), p. 2926-2939.
3. Elhadj Sidi C.E., Ndiaye M. L., El Bah M., Mbodji A., Ndiaye A., Ndiaye P.A., Performance analysis of the first large-scale (15MWp) grid-connected Photovoltaic plant in Mauritania, Energy Conversion and Management, 2016, 119, p. 411-421.
4. Cho S.M., Shin H.S., Park J.H., Kim J.C., Distribution system configuration considering customer and DG reliability cost, J. Electr. Eng. Technol. 2012, 7, p. 486–92.
5. Heidari M., Banejad M., Value-based distributed generation placements for reliability criteria improvement, J. Electr. Eng. Technol. 2013, 8, p. 223–229.
6. Foad H.G., Raeisi F., Ahmadi A., A literature review on estimating of PV-array hourly power under cloudy weather conditions, Renewable and Sustainable Energy Reviews, 2016, 63, p. 579-592.
7. Nacer T., Hamidat A., Nadjemi O., Feasibility study and electric power flow of grid connected photovoltaic dairy farm in Mitidja (Algeria), Energy Procedia, 2014, 50, p. 581-588.
8. Stambouli B., Khiat A., Z, Flazi S., Kitamura Y., A review on the renewable energy development in Algeria: Current perspective, energy scenario and sustainability issues, Renewable and Sustainable Energy Reviews, 2012, 16, p. 4445-4460.
9. Algerian Ministry of Energy and Mines, Renewable energy and energy efficiency program, 2011.
10. Rai A.K., Kaushika N.D., Singh B., Agarwal N., Simulation model of ANN based maximum power point tracking controller for solar PV system, Sol Energy Mater Sol Cells, 2011, 95, p. 773-778.
11. Kassem A., MPPT control design and performance improvements of a PV generator powered DC motor-pump system based on artificial neural networks, Electr. Power Energy Syst., 2012, 43, p. 90-98.
12. Zaghba L., Terki N., Borni A., Bouchakour A., Benbitour Khennane M., Adaptive intelligent MPPT controller comparison of photovoltaic system under different weather conditions of Ghardaia site (south of algeria), Journal of Electrical Engineering - Edition: 3, 2015, 15.
13. Anusuyadevi R., Suresh P.P., Muruga B.J., Sliding mode controller based maximum power point tracking of DC to DC boost converter, International Journal of Power Electronics and Drive System (IJPEDS), ISSN: 2088-8694, 2013, 3 (3), p. 321-327.
14. Elgharbi A., Mezghani D., Mami A., A maximum power point tracking method based on artificial neural network for a PV system, International Journal of Advances in Engineering & Technology, IJAET, 2012.
15. Bahgat A.B.G., Helwa N.H., Ahmad G.E., El Shenaw E.T., Maximum power point tracking controller for PV systems using neural networks, Renewable Energy, 2005, 30, p. 1257-1268.
16. Huang T., Shi X., Sun Y., Dan Wang. Three-phase photovoltaic grid-connected inverter based on feedforward decoupling control, IEEE publisher, 2014, 2, p. 476-480, DOI: 10.1109/ICMREE.2013.6893714.
17. Vijayakumari A., Devarajan A.T., Devarajan N., Decoupled control of grid connected inverter with dynamic online grid impedance measurements for micro grid applications, Electrical Power and Energy Systems, 2015, 68, p. 1-14.
18. Cherfa F., Hadj Arab A., Oussaid R., Abdeladim K., Bouchakour S., Performance analysis of the mini-grid connected photovoltaic system at Algiers, Energy Procedia, 2015, 83, p. 226-236.
19. Nacer T., Hamidat A., Nadjemi O., Techno-economic impacts analysis of a hybrid grid connected energy system applied for a cattle farm, Energy Procedia, 2015, 75, p. 963 – 968.