Engineering, Environment
Effects of varied porosity on the physic-mechanical properties of sintered ceramic from Ifon clay
Fatai Olufemi ARAMIDE1,2* and Patricia Abimbola POPOOLA2
1 Department of Metallurgical and Materials Engineering, Federal University of Technology, P.M.B. 704, Akure, Nigeria
2 Department of Chemical, Metallurgical and Materials Engineering, Tshwane University of Technology, Staatsartillerie Road, Pretoria West, South Africa
E-mail(s): 1 foaramide@futa.edu.ng; 2 PopoolaAPI@tut.ac.za
*Corresponding author, phone: +2348038509288, +27813778360
Received: June 04, 2017 / Accepted: December 02, 2017 / Published: December 30, 2017
Abstract
The effects of saw dust admixture on the physic-mechanical properties of sintered clay bonded carbonized palm kernel shell ceramic was investigated. Composite mixtures of powdered carbonized palm kernel shell and clay from Ifon deposit were produced using equal amount of clay and carbonized palm kernel shell. These were then mixed with varied amount of saw dust (0%, 5% and 10%) in a ball mill for 6 hours. From this standard sample specimens were produced using uniaxial compression after mixing each mixture with 10% moisture of clay contents. The compressed samples were sintered at 9500C and soaked for one hour. The sintered samples were characterized for various physic-mechanical properties using state of the art equipment’s. The fired samples were also characterized using ultra-high-resolution field emission scanning electron microscope (UHR-FEGSEM) equipped with energy dispersive spectroscopy (EDX). It was observed that the apparent porosity and water absorption of the clay bonded carbonized palm kernel shell ceramic increased with increased amount of saw dust admixture, cold crushing strength, Young’ modulus of elasticity and absorbed energy of the sample reduced with increased amount of saw dust admixture. It was concluded that the sample with 0% saw dust admixture is judged to possess optimum physic-mechanical properties.
Keywords
Carbonized palm kernel shell; Ifon clay; Porosity; Physic-mechanical properties; Saw dust admixture
Introduction
Porous ceramic materials with high mechanical stability have been produced via novel processing route, while retaining the intrinsic porosity of the porous powder from which they are manufactured [1, 2]. They have applications in various industrial areas, such as catalyst supports for heterogeneous chemical reactions, filters, membranes, thermal insulators, and bio ceramics. [3]. It has been reported that porous materials have porosity between 20% and 95% pore space of the total volume of the solid body [4]. Generally, pores are classified into two; open pores which are connected to the surface of the ceramic body, and closed pores which are isolated from the surface.
The physical properties of such ceramic materials are dependent on the pore structure. Porosity have a great deal of influence on the chemical reactivity of solid and the physical interaction of solids with gases and liquids [4]. The conventional methods for producing porous cordierite ceramics include the solid-state sintering of individual oxides of magnesium, aluminium and silicon of the corresponding chemical composition of cordierite, or sintering of the natural raw materials such as kaolinite and talc or from fly ash, technical silica and feldspar with the MgO, Al2O3 and SiO2 content [5].
Many researchers have worked on clay bond carbon related ceramic. Oke et al., [6] worked on production and characterization of clay bonded carbon refractory from Ifon clay and spent graphite electrode. The varied the sintering temperature between 700°C and 900°C. They concluded that the samples sintered at 700°C possessed the optimum property. Similarly, Aramide and Oke [7] reported their findings on the production and characterization of clay bonded carbon refractory from carbonized palm kernel shell. They varied the clay contents between 40% and 60%, and fired their samples at 950°C. They concluded that the sample with 60% clay content possessed the optimum property. The chemical and phase composition of the clay sample from Ifon deposit has been well discussed [8, 9].
The aim of the present work is to investigate the effects of varying the pore volume of the ceramic sample on its physic-mechanical properties.
Materials and method
The materials utilized in this research work are Ifon clay and Carbonized palm kernel shell. The Ifon clay was collected from Ifon (an area fond to be rich in fireclay), Ose Local Government Area of Ondo State (latitude 7O52`N and longitude 7O28`60 E). The clay lumps were crushed, grounded and sieved.
Clay processing procedure
This clay samples as obtained was soaked in water for three days to dissolve the clay and at the same time to form slurry. The resulting slurries were then sieved to remove dirt and other foreign substances using a sieve. These were then allowed to settle down for seven days after which the floating clear liquids were decanted. The settled fine clays is then poured into Plaster of Paris (P.O.P) moulds and left undisturbed for three days in other to allow the liquid present to drain out completely. The resulting plastic clay mass were sun dried and subsequently dried in a laboratory oven at 110°C for 24 hours to remove moisture content completely. The resulting dried clay samples were milled at 300 rev/ min for 4 hour to an average particle size of about 300μm. The carbonized palm kernel shell was produced as described by Ekpete and Horsfall [10], with the exception that the carbonization took place at 700°C. A mixture of clay, saw dust and carbonized palm kernel shell was made using ball-mill for six hours using the ratio shown in Table 1.
The crucibles containing the samples were placed in a muffle furnace and then fired (sintered) at 950°C, held at the temperature for 1hr. The percentage weights ratio of the mix is presented in Table 1:
Table 1. Percentage mass of representative samples
|
Samples |
Carbonized palm kernel shell (%) |
Ifon clay (%) |
Saw dust |
|
A |
50 |
50 |
0 |
|
D |
47.5 |
47.5 |
5 |
|
E |
45 |
45 |
10 |
Figure 1 shows the flow sheet for the methods.
Figure 1. Flow sheet of the method
Each mixture was made thoroughly with a little addition of water to induce some plasticity. The samples were then compressed uniaxial inside a standard stainless steel die. The compressed samples were placed in a ceramic crucible, properly sealed to limit the amount of air that will be in contact with the samples during firing.
Apparent porosity
Produced clay bonded carbon refractory samples were dried for 12 hours at 110°C. The weight of the dried samples were taken and recorded as D. The samples were immersed in water for 6 hours to soak and weighed while been suspended in air. The weight was recorded as W. Finally, the specimen was weighed when immerse in water. This was recorded as S.
The apparent porosity will then be calculated from Eq. (1):
![]() (1)
(1)
Where: p – apparent porosity; W - represents weight of the suspended sample; D - represents weight of dried sample; S - represents weight of soaked sample.
Cold compression strength (CCS)
Cold compression strength test was used to determine the compression strength to failure of each sample, an indication of its probable performance under load. The standard samples were dried in an oven at a temperature of 110°C, and then allowed to cool. The cold compression strength test was performed on INSTRON 1195 at a fixed crosshead speed of 10mm min-1.
Samples were prepared according to ASTM D412 (ASTM D412 1983) and tensile strength of standard and conditioned samples can be calculated from the Eq. (2):
![]() (2)
(2)
Where: CCS - represents cold compression strength of the sample; Load to Fracture - represent load or force that fractured the sample.
Water absorption Test
Water absorption tests were carried out following standard procedures. Samples of each composite grade were oven dried before weighing and the weights recorded were reported as the initial weight of the composites. The samples were then placed in distilled water maintained at room temperature (25°C) and at time intervals of 24h, the samples were removed from the water, cleaned using a dry cloth and weighed. The weight measurements were taken periodically at time intervals of 24h. The amount of water absorbed by the composites (in percentage) was calculated using the Eq. (3):
![]() (3)
(3)
Where: Soaked wt - represents weight of soaked sample; Dried wt - represents weight of dried sample.
Bulk density
The test specimens were dried at 110°C for 12 hours to ensure total water loss. Their dry weights were measured and recorded. They were allowed to cool and then immersed in a beaker of water. Bubbles were observed as the pores in the specimens were filled with water. Their soaked weights were measured and recorded. They were then suspended in a beaker one after the other using a sling and their respective suspended weights were measured and recorded. Bulk densities of the samples were calculated using the formula below, Eq. (4):
![]() (4)
(4)
Where: D - weight of dried specimen; S - weight of dried specimen suspended in water; W - weight of soaked specimen suspended in air.
Qualitative and Quantitative XRD
The samples were prepared for XRD analysis using a back loading preparation method [11]. They were analysed using a PANalytical X’Pert Pro powder diffractometer with X’Celerator detector and variable divergence- and receiving slits with Fe filtered Co-Kα radiation. The phases were identified using X’Pert Highscore plus software.
The receiving slit was placed at 0.0400. The counting area was from 50 to 700 on a 2θ scale. The count time was 1.5 s. The temperature-scanned XRD data were obtained using an Anton Paar HTK 16 heating chamber with Pt heating strip. Graphical representations of the qualitative result follow below.
The relative phase amounts (weight %) were estimated using the Rietveld method (Autoquan Program) as reported by Young et al [12]. Amorphous phases, if present were not taken into consideration in the quantification.
Results and discussion
Figures 1, 2, 3, 4, 6 and 7 show the effects of saw dust admixture on the various physic-mechanical properties of the samples while Table 2 shows the physic-mechanical properties of the various samples as affected by the amount of saw dust admixture.
Table 2. Physic-mechanical property of the samples
|
Percentage Saw dust (%) |
Apparent Porosity (%) |
Bulk Density (g/mm3) |
Water Absorption (%) |
Absorbed Energy (J) |
Cold Crushing Strength (MPa ) |
Young’s Modulus (MPa ) |
|
0 |
5.15 |
2.27 |
3.04 |
3.7720 |
226.100 |
19103.0 |
|
5 |
21.80 |
2.01 |
13.31 |
1.7220 |
76.700 |
6394.0 |
|
10 |
22.00 |
1.79 |
13.54 |
1.4593 |
24.9 |
3400.8 |
Figure 2 and Table 2 show the effect of percentage saw dust admixture on the apparent porosity of the ceramic samples. From the Figure 2, it is clearly seen that the apparent porosity of the sample increases with increased saw dust admixture. The apparent porosity of the sample
Figure 2. Effect of percentage saw dust content on the apparent porosity of the samples
was 5.15% when the was no saw dust in the it (at 0% saw dust), it then increased rapidly to 21.80% and 5% saw dust admixture was added to the sample, further increase in the saw dust admixture to 10% only resulted into the apparent porosity slightly increase to 22%. This is because when the ceramic samples were subjected to sintering, the saw dust particles in the samples would burn off, leaving pores within the ceramic body as postulated by Aramide, 2012 [2]. The more the saw dust admixture the more pore spaces would be left behind after sintering of the ceramic samples [13, 14].
Figure 3 and Table 2 show the effect of percentage saw dust on the bulk density of the ceramic samples.
Figure 3. Effect of percentage saw dust on the bulk density of the samples
From the Figure 3, it is observed that the bulk density of the samples decreased with increased amount of saw dust admixture. The bulk density of the was 2.27 g/cm3 when the saw dust admixture was 0%, it reduced to 2.01 g/cm3 as the saw dust admixture was increased to 5%. Further increase in the saw dust admixture resulted into further reduction in the bulk density of the sample to 1.79 g/cm3. As earlier discussed, the saw dust got burnt off when the samples were subjected to firing, this leave pores within the ceramic body. The more the pore (porosity) the less matter is contained in the sample; hence the reduction in the bulk density as the saw dust admixture is increased [2].
Figure 4 and Table 2 depict the effect of percentage saw dust on the water absorption of the samples.
Figure 4. Effect of percentage saw dust on the water absorption of the samples
From the Figure 4, it is observed that the relationship between water absorption of the samples and saw dust admixture follows the same trend with of the apparent porosity and the saw dust admixture. The water absorption of the samples increased with increased saw dust admixture in the samples. Water absorption of the sample was 3.04% when the saw dust admixture was 0%. It increased sharply to 13.31% when the saw dust admixture was increased to 5%. Further increase in the saw dust admixture to 10% leads to a slight increase in the water absorption of the sample. This is because the amount of saw dust admixture is directly related to the amount of pores spaces left after sintering the samples. It is a general knowledge that pores are classified into two; open and closed pores. There are also pores that are open to the surface on one end only but closed on the other end. The water absorption of the samples are directly dependent on the open pores but not on the closed pores.
Figure 5 and Table 2 show clearly the effect of percentage saw dust on the cold crushing strength of the samples.
Figure 5. Effect of percentage saw dust on the cold crushing strength of the samples
From the figure 5 it can be seen that the cold crushing strength of the samples reduced with increased amount of saw dust admixture. It is observed that the cold crushing strength of the sample was 226.1 MPa when the amount of saw dust admixture was 0% it reduced to 76.7 MPa when the saw dust admixture was increased to 5%. Further increase in the amount of saw dust admixture leads to further reduction in the cold crushing strength of the samples. This is because with increase in the amount of saw dust admixture, the porosity of the sample increased [15] as discussed earlier.
Figure 6 shows the effect of apparent porosity on the cold crushing strength of the samples.
Figure 6. Effect of apparent porosity on the cold crushing strength of the samples
It is also clearly depicted in Figure 6 which shows the corresponding influence of the apparent porosity (consequence to increased saw dust admixture) on the cold crushing strength of the sample. From the figure 6, it is observed that the cold crushing strength of the samples reduced with increased apparent porosity. Increase in apparent porosity of the samples means there are less matter available in the sample to bear the load applied in determining cold crushing strength, hence it will bear less load [2, 16].
Figure 7 shows the effect of percentage saw dust on the Young’s Modulus of elasticity of the ceramic samples.
Figure 7. Effect of percentage saw dust on Young's Modulus of elasticity of the samples
From the figure 7, it can be observed that the Young’s modulus of the samples decreased with the increase in the amount of saw dust admixture. The Young’s modulus of the sample was 19103 MPa when the saw dust admixture was 0%, it reduced to 6394 MPa as the amount of saw dust admixture was increased to5%. Further increase in the saw dust admixture to 10% lead to the Young’s modulus being further reduce to 3400.8 MPa. This means that increase in the amount of saw dust admixture (and consequently increase in the apparent porosity) leads to reduction in the stiffness of the samples [17, 18, 19].
Figure 8 depicts the effect of percentage saw dust admixture on the absorbed energy of the sample.
Figure 8. Effect of percentage saw dust on the absorbed energy of the samples
From the Figure 8, it is seen that the absorbed energy of the samples followed the same trend followed by the cold crushing strength and Young’s Modulus of the sample with the increase in the amount of saw dust admixture. It can be observed that the absorbed energy of the samples reduced with increased amounts of saw dust admixture. The absorbed energy of the sample was 3.772 J when the saw dust admixture was 0%, it was reduced to 1.722 J when the saw dust admixture was increased to 10%. Further increase in the saw dust admixture resulted in the absorbed energy being reduced to 1.4593 J.
Figures 9, 10 and 11 show the scanning electron microscope (SEM) images and the electron dispersive spectroscopy (EDS) of the samples with 0%, 5% and 10% saw dust respectively. From these figures the pores volumes in each could be compared.
|
|
|
||||||||||||||||||||||||||||||||||||||||||
|
|
|
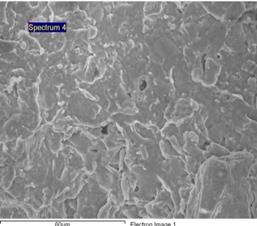
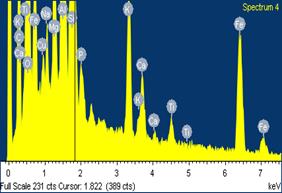
Figure 9. SEM/EDS images and data of clay bonded carbonized palm kernel ceramic samples with 0% saw dust admixture
It could be observed that pores could hardly be seen in the sample with 0% saw dust admixture (Figure 9).
|
|
|
|||||||||||||||||||||||||||||||||
|
|
|
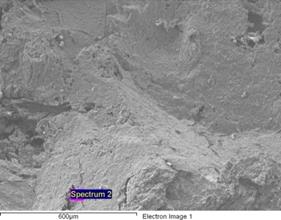
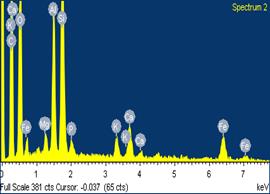
Figure 10. SEM/EDS images and data of clay bonded carbonized palm kernel ceramic samples with 5% saw dust admixture
|
|
|
||||||||||||||||||||||||||||||||||||
|
|
|
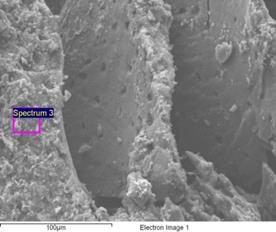
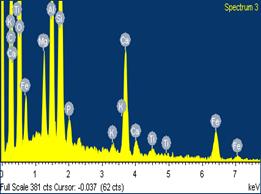
Figure 11. SEM/EDS images and data of clay bonded carbonized palm kernel ceramic samples with 10% saw dust admixture
Moreover, it could be observed from the EDS data that the carbon contents in the samples also increased with percentage saw dust admixture. This could be attributed to the carbonization of the sawdust admixture after sintering/firing leaving behind within the ceramic matrix carbon residue of the sawdust.
Conclusions
From the data discussed, it could be concluded that: apparent porosity and water absorption of the clay bonded carbonized palm kernel shell ceramic increased with increased amount of saw dust admixture. Cold crushing strength, Young’ modulus of elasticity and absorbed energy of the sample reduced with increased amount of saw dust admixture. The sample with 0% saw dust admixture is judged to possess optimum physic-mechanical properties.
Acknowledgments
The financial assistance of the National Research Foundation (NRF) towards this research is hereby acknowledged. Opinions expressed and conclusions arrived at, are those of the author and are not necessarily to be attributed to the NRF.
References
1. Sheng J., Vitrification of borate waste from nuclear power plant using coal fly ash. (I) Glass formulation development, Fuel, 2001, 80, p. 1365–1369.
2. Dibandjo P., Bois L., Estournes C., Durand B., Miele P., Silica, carbon and boron nitride monoliths with hierarchical porosity prepared by spark plasma sintering process, Micropor. Mesopor. Mat., 2008, 111 (1–3), p. 643–648.
3. Aramide F.O., Production and characterization of porous insulating fired bricks from Ifon clay with varied sawdust admixture, Journal of Minerals and Materials Characterization and Engineering, 2012, 11, p. 970-975.
4. Gregg S.J., Sing K.S.W., Adsorption, surface area and porosity, 2nd Edition, Academic Press, London, 1995.
5. Valášková M., Martynková G.S., Microporous cordierite ceramics prepared from clay mineral mixtures containing vermiculite, Journal of Scientific Conference Proceedings, 2010, 2, p. 49–52.
6. Oke S.R., Talabi H.K., Olorunniwo O.E., Atanda P.O., Aramide F.O., Production and characterization of clay bonded carbon refractory from Ifon clay and spent graphite electrode, International Journal of Metallurgical Engineering, 2015, 4 (2), p. 33-39.
7. Aramide F.O., Oke S.R., Production and characterization of clay bonded carbon refractory from carbonized palm kernel shell, ACTA TEHNICA CORVINIENSIS - Bulletin of Engineering, 2014, 4 (VII), p. 133-140.
8. Aramide F.O., Effects of sintering temperature on the phase developments and mechanical properties ifon clay, Leonardo Journal of Sciences, 2015, 14 (26), p. 67-82.
9. Aramide F.O., Alaneme K.K., Olubambi P.A, Borode J.O., Characterization of some clay deposits in south west Nigeria, Leonardo Electronic Journal of Practices and Technologies, 2014, 13 (25), p. 46-57.
10. Ekpete O.A., Horsfall M., JNR, Preparation and characterization of activated carbon derived from fluted pumpkin stem waste (Telfairia occidentalis Hook F), Research Journal of Chemical Sciences, 2011, 1 (3), p. 10-17.
11. Kleeberg R., Monecke T., Hillier S., Preferred orientation of mineral grains in sample mounts for quantitative XRD measurements: How random are powder samples? Clays and Clay Minerals, 2008, 56 (4), p. 404-415.
12. Young R.A, Sakthivel A., Moss T.S., Paiva-Santos C.O., Rietveld analysis of X-ray and neutron powder diffraction patterns, School of physics, Georgia Institute of Technology, Atlanta, U.S.A. 1994.
13. Chesti A.R., Refractories: Manufacture, properties, and applications, Prentice-Hall of India Private Limited, Delhi, 1986.
14. Li L.P., Wu Z.G., Li Z.Y., He Y.L., Tao W.Q., Numerical thermal optimization of the configuration of multi-holed clay bricks used for constructing building walls by the finite volume method, International Journal of heat and mass transfer, 2008, 51 (3), p. 3669-3682.
15. Kadir A.A., Mohajerani A., Roddick F., Buck-Eridge J., Density, strength, thermal conductivity and leachate characteristics of light-weight fired clay bricks incorporating cigarette butts, International Journal of Civil and Environmental Engineering, 2010, 2 (4), p. 1035-1040.
16. Norton F. H., Refractories, 4th Edition, McGraw-Hill, New York, 1968.
17. Aramide F.O, Oladele I.O., Folorunso D.O., Evaluation of the effects of fiber volume fraction on the mechanical properties of a polymer matrix composite, Leonardo Electronic Journal of Practices and Technologies, 2009, 14, p. 134-141.
18. Callister W.D., Materials science and engineering an introduction. New York: John Wiley and Sons, 2000.
19. Aramide F.O., Ibitoye S.A., Oladele I.O., Borode J.O., Effects of carburization time and temperature on the mechanical properties of carburized mild steel, using activated carbon as carburizer, Materials Research, 2009, 12 (4), p. 483-487.