Engineering, Environment
Estimating the shear strength of concrete with coarse aggregate replacement
Folagbade Olusoga Peter ORIOLA, George MOSES, Jacob Oyeniyi AFOLAYAN and John Engbonye SANI*
1Department of Civil Engineering, Nigerian Defence Academy, Kaduna, Nigeria
E-mails: fooriola@nda.edu.ng; mgeorge@nda.edu.ng; ajoyeniyi@nda.edu.ng; *jesani@nda.edu.ng
*Corresponding author, phone: +2348038752773
Received: July 15, 2017 / Accepted: December 27, 2017 / Published: December 30, 2017
Abstract
For economic, environmental and practical reasons, it is desirable to replace the constituents of concrete with wastes and cheaper alternative materials. However, it is best when such replacements are done at optimum replacement levels. In view of this, a laboratory investigative test was carried out to evaluate the shear strength of concrete with coarse aggregate replacement by Coconut Shell and by Waste Rubber Tyre. The coarse aggregate replacement was done at recommended optimum proportions for compressive strength of 25% and 10% by volume for Coconut shell and Waste Rubber tyre respectively. Test results revealed that at the levels of replacement, the concrete can still be classified as dense concrete with densities above 2200kg/m3. Furthermore, the compressive strengths of concrete with replacement were about 92% and 83% of corresponding normal aggregate concrete. However, the concrete shear strengths for concrete mixes with aggregate replacement were not significantly different from those of normal concrete of comparable compressive strength. Therefore, a regression equation was developed to estimate the shear strength of concrete with coarse aggregate replacement not beyond these levels of replacement. The coefficient of variation of the test result with the regression equation was at an acceptable level of 7.33%, which is considered within the limit of experimental error. So, the regression equation can be used as a predictive tool.
Keywords
Shear strength; Coconut shell; Waste rubber tyre; Coarse aggregate replacement
Introduction
Concrete is one of the most, if not the most widely used construction material in the world [1-3]; though current world statistics are not available, it has been reported that 25 billion tonne of concrete was produced in the world in 2009. [4] reported that in Nigeria like many other developing countries, concrete is the primary construction material as it is cheaper and readily more available. They further concluded from their questionnaire-based study that concrete is a more suitable material for sustainable construction in the Nigerian Construction industry. This massive usage of concrete is as a result of its versatility, durability and ease of production. However, it is generally accepted that concrete consumes a large quantity of non-renewable raw material directly and indirectly and it has a large carbon footprint [2]. Normal concrete is made up of water, cement, and fine aggregate in form of sand and coarse aggregate in form of rock or stone particles. Water, fine and coarse aggregates are often direct natural raw material, while cement the only manufactured product consumes a large quantity of limestone and other non-renewable raw material. Furthermore, the production of cement is known to be environmentally unfriendly producing about 900kg of CO2 per ton production.
Therefore, recent researches have been focused at not only improving the quality of concrete as a material but also the replacement of concrete constituents with other renewable materials or waste/by products. The most successful attempt at this is the replacement of fine or coarse aggregate with agricultural and industrial wastes and by products. For cement, replacement materials that have been explored include Pulverized Fuel Ash (PFA), Silica Fume (SF), Cement Kiln Dust (CKD), Rice Husk Ash (RHA), etc. [5-8]. For aggregate replacement materials that have been explored are Steel balls, Glass beads, Coconut Shell, Palm Kernel Shell, Periwinkle Shell, Rubber, manufactured light aggregates, etc. [9-13]. In Africa and developing countries, the most popular replacement materials are agricultural waste and by products due to low level of industrialization. In this study one agricultural waste, coconut shell and an industrial waste, waste rubber tyre has been investigated as part of the ongoing research for the utilization of such waste in concrete works.
Coconut shell is an agricultural waste which is obtained from the coconut palm, it is the shell just after the coconut husk and it serves as a protective shell to the coconut fruit itself. It is an abundant not-easily-degradable agricultural waste material and its disposal has been a challenge for farmers and consumers alike. The widespread usage of coconut shell in concrete will solve two major problems; the problem of the economic disposal of a solid waste and the problem of depletion of natural resources that are used in the production of concrete. Researchers have shown that coconut shell can be utilized in concrete as cement replacement material in form of Coconut Shell Ash (CSA) or when unprocessed, as aggregate replacement material[14], [11], [15] and [16]. Of relevance to the current study is a research conducted by [17] on the comparative cost analysis and strength characteristics of concrete produced using crushed granular coconut and palm kernel as substitute for conventional coarse aggregate. The coarse aggregate was replaced in ratios of 0%, 25%, 50%,75% and 100% in two different concrete mixes. Their results showed that the compressive strength of the concrete decreased as the percentage of the shell increased in the two mixes, though coconut shell concrete exhibited a higher compressive strength than palm kernel shell concrete. Moreover cost reduction of 30% and 42% for concrete produced from coconut shell and palm kernel shell were observed. Considering the strength/economic ratio it was concluded that coconut shell is more suitable than palm kernel shell when used as a partial replacement for conventional aggregate in concrete. Also, [18], in an experiment carried-out by varying the percentage of replacement of coarse aggregates with coconut shell, it was discovered that 25% replacement mix gave an average compressive strength of about 94.25% strength of normal concrete, while the percentages for 50% and 100% replacement were 62% and 23% of control strength respectively. Similar results were obtained for Tensile Splitting and Flexural Strength. They therefore recommended 25% as an optimum replacement level though [16] recommended 18.5%.
Waste Rubber tyres as shown in Figure 1 are among the largest and most problematic sources of waste, due to the large volume discarded and their durability.
|
a) Indiscriminate dumping |
b) Air pollution and visibility impairment |
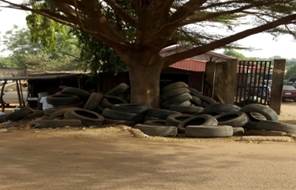

Figure 1. Environmental problems of waste rubber tyre in Nigeria
In Nigeria, close to 100 percent of used tyres condemned annually are either disposed of in an unfriendly environmental way or burned openly to extract steel wires thereby causing environmental hazards of visibility and air pollution (see Figure 1). But, the same characteristics that make waste tyre problematic, their cheapness, availability, bulk, and resilience, also make them attractive targets for recycling for use in other areas, hence the idea of using them as aggregate replacement material in concrete. Researches have shown that waste rubber tyre can be effectively used as aggregate replacement material but with effects on the resulting concrete depending on the percentage of replacement, research reports indicate that while compressive, tensile and flexural strengths decreased with addition of rubber in one form or the other, other properties such toughness, impact resistance and the plasticity of the concrete increased by addition some amount of rubber into concrete [19], [10] and [20]. In [21] reported a reduction of up to 50% with just 14% replacement though strengths may be improved by other treatment such as air entrainment.
Most of the reported works have concentrated on the effect of replacement on direct properties such that may be measured on control specimens with few on structural performance of the resulting concrete. Shear failure is one of the most important failure modes, being an ultimate limit state.
The present study aims at establishing an equation that may be used to obtain the shear strength of concrete with coarse aggregate replacement, especially when replacement is done at recommended optimum replacement level for concrete compressive strength.
Materials and method
The following materials were used in the experimentation:
· Sharp river sand was sourced from local suppliers in Zaria, Kaduna State Nigeria.
· Granite chippings, 20mm maximum aggregate size was procured from the local quarry in Samaru, Zaria Nigeria.
· Waste rubbertyres were procured from local vulcanizes in Samaru Zaria and cut manually into small irregular shaped pieces of size not greater than 20mm,to make the Waste Tyre Rubber aggregate (WRTA).
· Coconut shell was obtained from local coconut sellers from the Coconut depot in Sabo market area, Zaria, Kaduna State Nigeria. The coconut shell’s husk was removed and the shell broken manually with hammer to achieve maximum size of 20mm. The coconut shell was then washed and air dried for at least a week and before usage as Coconut Shell aggregate (CS).
· Ordinary Portland cement grade 42.5 was sourced from the local market in Samaru area of Zaria, Kaduna State, Nigeria.
· Clean drinkable tap water was gotten from the Concrete laboratory of the Department of Civil Engineering, Ahmadu Bello University (A.B.U.), Zaria.
· Steel reinforcing bars were obtained from the local supplier in Samaru, Zaria and properties of the 16mm diameter main bars were determined from the Material laboratory of Civil Engineering Department of, A.B.U Zaria according to [26].
Mixing, casting and curing of concrete beams and control specimens
Workable mixes for normal concrete of grades between 20 and 40N/mm2 were targeted and produced in the Laboratory through trial mixes. The final prescribed mixes adopted were; 0.6/1:2:3, 0.55/1:1.5:3, 0.5/1:1.5:2, 0.42/1:1:2 and 0.37/1:1:1; the proportioning was by weight. However, to achieve workable mix, replacement of the coarse aggregate proportion was by an equivalent volume of the percentage of the coarse aggregate to be replaced. For coarse aggregate replacement by coconut shell, the percentage replacement was 25% while for waste rubber tyre, the coarse aggregate replacement was 10%. Concrete beams for the Shear Strength tests were cast in wooden moulds shown in Figure 2.
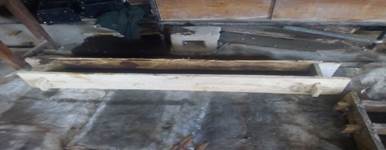
Figure 2. Wooden mould for casting of beams
Each beam had two 16mm rods as main reinforcement as shown in Figure 3, 8 mm diameter stirrups were placed at the ends and in the flexural area of the beam span and two 6mm plain roads were used as hangers to hold the main bars and stirrups in place.
|
1200mm (a) Beam longitudinal details |
150mm
200
2Y16
(b) Section 1-1 |
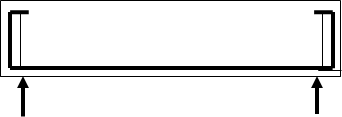

Figure 3. Beam details
Just before full casting of the beam, the hanger bars were then cut off and removed. Beams were casts in three layers with compaction achieved manually with 25 mm diameter poker rod until bubbles were no longer coming out. All specimens and 150mm cube control specimens were removed from the moulds after 24 hrs and then cured under water in the Laboratory under ambient temperature (ambient temperature in Kaduna is 25-300C) for 28 days before removal for immediate testing.
Testing
The following tests were conducted on the aggregates, wet concrete and hardened concrete according to the relevant British Standards:
i) Particle size distribution: Sieve analysis was conducted on all the aggregates, according to [22] to determine their suitability for concrete work.
ii) Workability: Workability of mixes was assessed by the simple Slump test performed according to [25].
iii) Density: Density of concrete mixes was determined on the 28day using the concrete cubes according to [29].
iv) Compressive Test: Compressive strength of the mixes was determined with 3No. 150mm cubes per mix according to [28].
v) Beam shear Test: The four-point bending test set up was adopted with a constant shear span/effective depth ratio of 2.5d as shown in Figures 3 and 4. Loading was via a 2500kN Compression machine operating at the slow mortar loading rate. Because it was difficult to apply incremental loading approach with the machine, constant loading rate was used but the machine was halted at interval to mark cracking and crack growth, until failure.
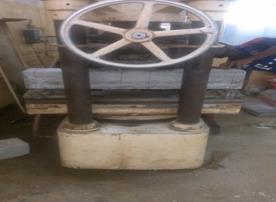
Figure 4. Typical beam test set up
Analysis of concrete shear strength result
For estimating the design strength of the concrete section without web reinforcement, BS8110 [24] recommends the use of Eq. (1) which is an empirically derived formula which takes care of all the factors that are known to contribute to or affect the strength of such elements in shear.
![]() (1)
(1)
Where: vc- is the characteristic concrete shear strength; γm- is a partial factor of safety for shear; bv is the shear breadth; As- is the quantity of longitudinal reinforcement; fcu- is the characteristic concrete cube strength; d - is the effective depth of tensile reinforcement.
Equation 1 is subject to these limitations:
a) ![]()
b) ![]()
c) ![]()
d) ![]() .
.
Since, it is an experimental work and not design, γm has been equated to 1.0. So, for the basis of direct comparison of experimental result with the BS8110 provision, Eq. (1) transforms to Eq. (2) below and was used.
![]() (2)
(2)
Where: vc - is the characteristic concrete shear strength; bv is the shear breadth; As - is the quantity of longitudinal reinforcement; fcu - is the characteristic concrete cube strength; d - is the effective depth of tensile reinforcement.
Eq. (2) is assumed to be of the form of Eq. (3):
![]() (3)
(3)
Where: c is a constant, vc - is the characteristic concrete shear strength; bv - is the shear breadth; As - is the quantity of longitudinal reinforcement; fcu - is the characteristic concrete cube strength; d - is the effective depth of tensile reinforcement.
When the terms![]() and
and ![]() are maintained constant,
it may be assumed that their contributions remained the same and the influence
of changes in the concrete strength is the only variation, a new C may then be
obtained by correlation of experimental result.
are maintained constant,
it may be assumed that their contributions remained the same and the influence
of changes in the concrete strength is the only variation, a new C may then be
obtained by correlation of experimental result.
To obtain the best fit for the trend of the effect of the compressive strength, three variations of the Eq. (3) were explored Eq. (4) is the variation with the concrete strength term raised to a power of a third.
![]() (4)
(4)
Where: c1 - is the constant for the equation with the term of Concrete strength being a cube root, vc - is the characteristic concrete shear strength; bv - is the shear breadth; As - is the quantity of longitudinal reinforcement; fcu - is the characteristic concrete cube strength; d - is the effective depth of tensile reinforcement.
Equation 5 is the variation of Eq. (3) with the concrete strength term raised to a power of a half.
![]() (5)
(5)
Where: c2 - is the constant for the equation with the term of concrete strength being a square root, vc - is the characteristic concrete shear strength; bv - is the shear breadth; As - is the quantity of longitudinal reinforcement; fcu - is the characteristic concrete cube strength; d - is the effective depth of tensile reinforcement.
Equation 6 is the variation of Eq. (3) with the concrete strength term raised to a power of two-third.
![]() (6)
(6)
Where: c2 - is the constant for the equation with the term of concrete strength being twice cube root, vc - is the characteristic concrete shear strength; bv - is the shear breadth; As - is the quantity of longitudinal reinforcement; fcu - is the characteristic concrete cube strength; d - is the effective depth of tensile reinforcement.
The correlation constants, C’s were obtained for the normal concrete and for the concrete with aggregate replacement and then compared.
The work algorithm is as shown below in figure 5:
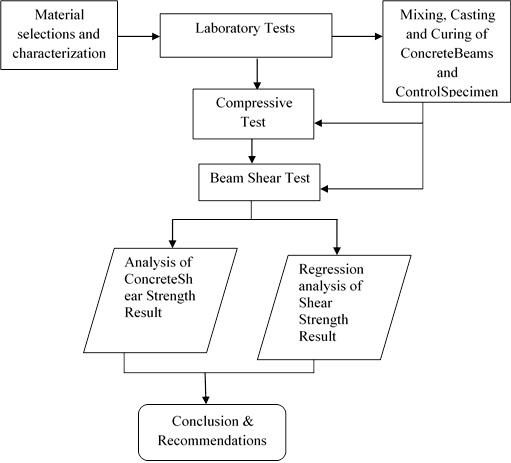
Figure 5. Work algorithm
Results and Discussion
Particle size distribution of aggregates
The results of the Sieve analysis on the various aggregates are presented in Tables 1-4.
Table 1 shows that the fine aggregate is a well-graded sand which falls within the fine grading classification of [23].
Table 1. Particle size distribution of fine aggregate
|
S/N |
Sieve Size |
Percentage Passing (%) |
|
1 |
4.76mm |
100 |
|
2 |
2.36mm |
96.41 |
|
3 |
1.18mm |
90.10 |
|
4 |
600μm |
85.44 |
|
5 |
300μm |
13.36 |
|
6 |
150μm |
3.55 |
|
7 |
75μm |
2.05 |
|
8 |
Pan |
0.00 |
Table 2 shows that the coarse aggregate (granite chippings) is also well-graded with grading within the limits for standard 20 mm maximum size coarse aggregate for concrete of [23].
Table 2. Particle size distribution of normal coarse aggregate
|
S/N |
Sieve Size |
Percentage Passing (%) |
|
1 |
38.1mm |
100 |
|
2 |
25.4mm |
100 |
|
3 |
19.05mm |
98.7 |
|
4 |
16.0mm |
70.8 |
|
5 |
12.7mm |
50.5 |
|
6 |
9.52mm |
35.1 |
|
7 |
6.35mm |
15.0 |
|
8 |
4.76mm |
0.06 |
|
9 |
Pan |
0.00 |
Table 3 shows the particle size distribution of the waste rubber tyre aggregate. It is a gap graded aggregate.
Table 3. Particle size distribution of waste rubber tyre aggregate
|
S/N |
Sieve Size |
Percentage Passing (%) |
|
1 |
38.1mm |
100 |
|
2 |
25.4mm |
100 |
|
3 |
19.05mm |
100 |
|
4 |
16.00mm |
33.6 |
|
5 |
12.7mm |
0.0 |
|
6 |
4.76mm |
0.0 |
|
7 |
Pan |
0.0 |
Due to the difficulties of manually cutting the tyres, very small sizes were not obtained and only two size ranges were obtained; 16mm-19mm (66%) and 12.7mm to 16mm (34%). The particle size distribution of the Coconut shell aggregate is as given in Table 4, it is also well graded.
Table 4. Particle size distribution of coconut shell aggregate
|
S/N |
Sieve Size |
Percentage Passing (%) |
|
1 |
38.1mm |
100 |
|
2 |
25.4mm |
100 |
|
3 |
19.05mm |
100 |
|
4 |
16mm |
99 |
|
5 |
12.7mm |
96 |
|
6 |
9.52mm |
30 |
|
7 |
6.35mm |
15 |
|
8 |
4.76mm |
0 |
|
9 |
Pan |
0 |
Properties of reinforcing steels
The result of tensile test on the main reinforcement is as presented in Table 5.
Table 5. Strength properties of 16mm diameter reinforcing steel
|
S/N |
Property |
Value |
|
1 |
Average Yield Strength |
395.6N/mm2 |
|
2 |
SD of Yield Strength |
5.92N/mm2 |
|
3 |
Characteristic Yield Strength |
385.9N/mm2 |
|
4 |
Average Ultimate Strength |
615.5N/mm2 |
|
5 |
SD of Ultimate Strength |
5.5N/mm2 |
|
6 |
Characteristic Ultimate Strength |
606.5N/mm2 |
|
7 |
Average Ultimate Strain |
0.168 |
|
8 |
SD of Ultimate Strain |
0.010 |
|
9 |
Characteristic Ultimate Strain |
0.160 |
The characteristic yield strength of the reinforcing bar is 385.9N/mm2 as indicated in Table 5, this is below 460-500N/mm2 for high yield steel specified by [24] but this is normal for most reinforcing steel in Nigeria. However, the yield strength is much higher than 250N/mm2 which is that of Mild Steel, so it can be classified as High Yield Steel reinforcement.
Properties of concrete mixes
Presented in Table6 are the results of workability, density and compressive strength tests on mixes and observations are as presented as follows:
Table 6. Properties of concrete mixes
|
S/N |
Mix ID |
Slump (mm) |
Characteristic Density (kg/m3) |
Mean Compr. Strength (fcum) (N/mm2) |
Std. Deviation (σc) (N/mm2)
|
Char. Compr. Strength (fcu) (N/mm2) |
% of Control Compr. Strength |
|
1. |
C1 |
11 |
2421 |
22.2 |
0.88 |
20.8 |
100 |
|
2. |
C2 |
25 |
2499 |
26.8 |
1.34 |
24.6 |
100 |
|
3. |
C3 |
29 |
2413 |
30.5 |
1.83 |
27.5 |
100 |
|
4. |
C4 |
46 |
2308 |
34.3 |
2.57 |
30.1 |
100 |
|
5. |
C5 |
66 |
2294 |
39.4 |
1.81 |
36.4 |
100 |
|
6. |
CSC1 |
14 |
2293 |
21.0 |
1.34 |
18.8 |
90 |
|
7. |
CSC2 |
28 |
2237 |
24.3 |
1.41 |
21.8 |
89 |
|
8. |
CSC3 |
62 |
2268 |
28.6 |
2.20 |
25.0 |
91 |
|
9. |
CSC4 |
50 |
2326 |
32.4 |
1.61 |
29.8 |
99 |
|
10. |
CSC5 |
30 |
2212 |
36.5 |
1.73 |
33.6 |
92 |
|
11. |
WRTC1 |
28 |
2348 |
19.0 |
2.86 |
14.3 |
69 |
|
12. |
WRTC2 |
37 |
2240 |
23.3 |
0.68 |
22.1 |
90 |
|
13. |
WRTC3 |
90 |
2317 |
27.7 |
0.68 |
26.6 |
97 |
|
14. |
WRTC4 |
49 |
2499 |
31.3 |
2.06 |
27.9 |
77 |
|
15. |
WRTC5 |
66 |
2299 |
35.2 |
2.06 |
31.8 |
87 |
|
C-
control (no replacement), CSC – coconut shell concrete, WRTC – waste rubber
tyre concrete, Compr. - compressive, Char. - characteristic and |
|||||||
a) Workability: The workability of all mixes was low to medium workability as shown in Table 6. Slump test results indicated that replacement of coarse aggregate at the percentages chosen generally increased the workability of the concrete.
b) Concrete density: Densities of concrete with coconut shell replacement of coarse aggregate (CSC) and those of waste rubber tyre crumbs replacement of coarse aggregate (WRTC) were generally lower than those of corresponding controls (C). This observation is expected because denser granite was being replaced by lighter coconut shell or waste rubber tyre. However, the densities of CSC mixes were on the average about2267kg/m3, while those of WRTC mixes were on the average about 2341kg/m3 as compared with the Control with an average characteristic density of 2386kg/m3. Thus, the replacement of the coarse aggregate at the level chosen in this study did not significantly reduce the density nor lower it to light weight concrete range.
c) Compressive strength: The characteristic compressive strengths of CSC mixes were generally lower than those of normal concrete or control mixes at an average of about 92%, this conforms to the findings of [18]. Similarly, the characteristic compressive strengths of WRTC mixes were lower than those of normal concrete or control at an average of about 84%.
d) Results of beam Test
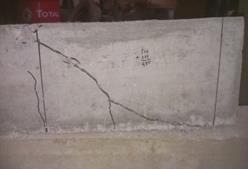
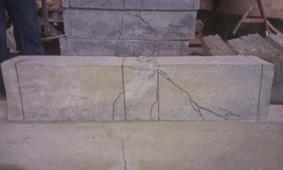
Figure 5. Shear Compression Failure of Beam Specimens
(i) Cracking and failure mode: All the beams failed in the Shear Compression mode as shown in Figure 5; failure of the beam occurred at the crushing of the compression zone at the head of the flexural shear crack closest to the flexural span. In all the beams, very few cracks were formed, maybe because of the small number of reinforcing bars used
(ii) Shear strength of beams: Table 7 shows the shear strengths of beams with the corresponding concrete compressive strength for all concrete mixes.
Table 7. Shear Strength of Concrete Beams
|
Beam/Mix ID |
Concrete grade (fcu) [N/mm2] |
Shear strength (vc) [N/mm2] |
|
C1 |
20.8 |
1.623 |
|
C2 |
24.6 |
1.710 |
|
C3 |
27.5 |
1.950 |
|
C4 |
30.1 |
2.491 |
|
C5 |
36.4 |
2.601 |
|
CS1 |
18.8 |
1.520 |
|
CS2 |
21.8 |
1.626 |
|
CS3 |
25.0 |
1.991 |
|
CS4 |
29.8 |
2.115 |
|
CS5 |
33.6 |
2.380 |
|
WRTC1 |
14.3 |
1.532 |
|
WRTC2 |
22.1 |
1.805 |
|
WRTC3 |
26.6 |
2.015 |
|
WRTC4 |
27.9 |
1.956 |
|
WRTC5 |
31.8 |
2.241 |
As may be observed from Table 7, the shear strength of different type’s concrete cannot be compared easily because the grades of concrete for the different kind on concrete did not tally. However, the general trend within each concrete type is that the shear strength increased with increasing concrete strength. For comparison between concrete types, values in Table 7 have been plotted in Figures 6, 7 and 8 and the trends compared with curves of equations 2, 4, 5 and 6.C1 = 1.272, C2 = 1.266 and C3 = 1.262were used for equations 4, 5 and 6 respectively, as determined in Table 8.
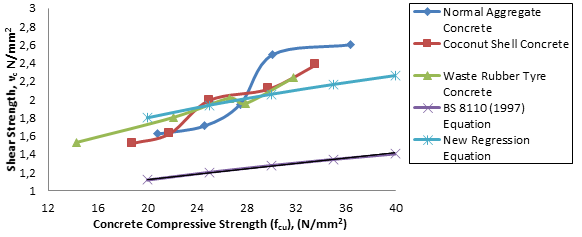
Figure 6. Trend of shear strength result compared with values from equation 4

Figure 7. Trend of shear strength result compared with values from equation 5
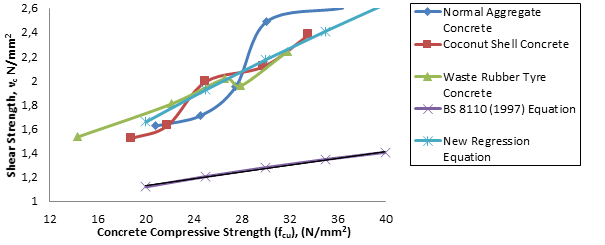
Figure 8. Trend of shear strength result compared with values from equation 6
As may be observed from Figures 6, 7 and 8, concrete shear strength of [24] presented earlier as Equation 2 forms a very low lower bound for all the results, it thus seriously under estimate the shear strength of both normal aggregate concrete and those with coarse aggregate replacement. However, the three-new regression equation are closer to the results but values predicted by Equation 6 followed the trend of the experimental data more closely and thus represented the trend better. The regression curve for Equation 6plotted in Figure 8 lie in the middle of all the data with even distribution of experimental data below and above the curve. This is a confirmation of the calculation in Table 8.
Table 8. Values of correlation constant (C) for different concrete
|
Beam ID |
Concrete strength (Fcu) [N/mm2] |
Shear strength (vc) N/mm2] |
Constant (C1) [Nil] |
Mean of C1 |
Constant (C2) [Nil] |
Mean of C2 |
Constant (C3) [Nil] |
Mean of C3 |
|
C1 |
20.8 |
1.623 |
1.130 |
1.306 |
1.166 |
1.282 |
1.202 |
1.260 |
|
C2 |
24.6 |
1.710 |
1.126 |
1.129 |
1.132 |
|||
|
C3 |
27.5 |
1.950 |
1.237 |
1.218 |
1.199 |
|||
|
C4 |
30.1 |
2.491 |
1.533 |
1.487 |
1.442 |
|||
|
C5 |
36.4 |
2.601 |
1.503 |
1.412 |
1.326 |
|||
|
CS1 |
18.8 |
1.520 |
1.095 |
1.246 |
1.148 |
1.241 |
1.204 |
1.237 |
|
CS2 |
21.8 |
1.626 |
1.114 |
1.140 |
1.166 |
|||
|
CS3 |
25.0 |
1.991 |
1.304 |
1.304 |
1.304 |
|||
|
CS4 |
29.8 |
2.115 |
1.306 |
1.269 |
1.232 |
|||
|
CS5 |
33.6 |
2.380 |
1.413 |
1.345 |
1.280 |
|||
|
WRTC1 |
14.3 |
1.532 |
1.209 |
1.265 |
1.327 |
1.275 |
1.457 |
1.289 |
|
WRTC2 |
22.1 |
1.805 |
1.232 |
1.256 |
1.284 |
|||
|
WRTC3 |
26.6 |
2.015 |
1.293 |
1.280 |
1.266 |
|||
|
WRTC4 |
27.9 |
1.956 |
1.235 |
1.213 |
1.191 |
|||
|
WRTC5 |
31.8 |
2.241 |
1.355 |
1.302 |
1.250 |
|||
|
Average |
1.272 |
|
1.266 |
|
1.262 |
|
||
|
Standard deviation (SD) |
0.136 |
0.102 |
0.093 |
|
||||
|
Coefficient of Variation (COV) |
10.7% |
8.09% |
7.33% |
|
||||
|
Characteristic value |
1.049 |
|
1.099 |
|
1.109 |
|
||
From Table 8, it can be observed that the values of shear strength for corresponding compressive strength for different kinds of concrete are not significantly different as the Coefficients of Variation (COV) for Eq. (4- 6) for all the concrete types are below the practical limit of 15%. Therefore, any of Eq. (4-6) could have been used to represent the experimental results. However, Eq. (6) which appears to follow the trend of the results better (Figure 8) and with the lowest COV of 7.33%is the preferable choice. Eq. (6) is expected to predict the shear strength of both normal concrete and those with coarse aggregate replacement at the prescribed level. For safer design however, the design strength could be obtained from the characteristic value of C3 = 1.109. With this value, all the results will be above the regression line and there may be no need to further apply the partial factor of safety for shear recommended by BS 8110.
This study has revealed
that when the coarse aggregate portion of the concrete mix is replaced at
recommended optimum percentages for compressive strength, which is about 25%
for coconut shell and 10% for waste rubber tyre, the density of the resulting
concrete though lower is still within the normal aggregate concrete density
range. The study further revealed that the shear strength of the concrete at
these levels of replacement as well as that of normal concrete are not
significantly different at comparable compressive strength. For design
purposes, the concrete shear strength of normal concrete and concrete with
coarse aggregate replacement at optimum percentage for compression may be
determined from the regression equation developed:![]() .
.
References
1. Cement Sustainability Initiative (CSI), Recycling concrete, World Business Council for Sustainable Development WBCSD, ISBN: 978-3-940388-49-0, 2009.
2. Crow J.M., The concrete conundrum, Chemistry World, March 2008, p. 62-66 www.chemistryworld.org.
3. Concrete (n.d). Retrieved June 30, 2017 from https://en.wikipedia.org/wiki/Concrete
4. Jatau J., Alufohai A., An evaluation of construction materials as a means to achieving sustainable construction in Nigeria: A comparison of concrete V steel, The Construction, Building and Real Estate Research Conference of the Royal Institution of Chartered Surveyors held in Toronto Canada, 2016, p. 20-22.
5. Shatat M.R., Hydration behaviour and mechanical properties of blended cement containing various amounts of rice husk ash in presence of metakaolin, Arabian Journal of Chemistry, 2014, p. 1-6.
6. Autade P.B., Shirke A.H., Characteristic evaluation of blended cement concrete, International Journal of Engineering Research and General Science, 2015, 3 (2), p. 1064-1072.
7. Siddique R., Khan M.I., Supplementary cementing materials, Springer-Verlag Berlin Heidelberg, 2011.
8. Namagga C., Atadero R., Optimization of fly ash as a replacement for cement and filler material, World of Coal Ash (WOCA) Conference, Lexington, KY, USA, 2009.
9. AshwinManjunath B.T., Partial replacement of e-plastic wastes as coarse aggregate in concrete, Procedia Environmental Sciences, 2016, 35, p. 731-739.
10. Alam I., Mahmood U.A., Khattak N., Use of rubber as aggregate in concrete: A review, International Journal of Advanced Structures and Geotechnical Engineering, 2015, 4 (2), p. 92-96.
11. Shelke A.S., Ninghot K.R., Kunjekar P.P and Gaikwad S.P., Coconut shell as partial replacement of coarse aggregate: A review, Int. Journal of Civil Engineering Research, 2014, 5(3), p. 2110-2114.
12. Gautam S.P., Srivastava V., Aganwal V.C., Use of glass wastes as fine aggregate in concrete, Journal of Acad. Industr. Res, 2012, 1 (6), p. 320-322.
13. Choi Y.W., Moon D.J., Kim Y.S., Lachemi M., Characteristics of mortar and concrete containing fine aggregate manufactured from recycled polyethylene terephthalate bottles, Construction and Building Materials, 2009, 23, p. 2829-2835.
14. Kamalali P.S., Mathapah S.R., Application of coconut shell as coarse aggregate in concrete: A technical review, Journal of Engineering Research and Applications, 2014, 4 (4), p. 498-501.
15. Kukami V.P., Gaikwad S.J.B., Comparative study on coconut shell aggregate with conventional concrete, International Journal of Engineering and Innovative Technology, 2013, 2 (12), p. 67-70.
16. Osei D.Y., Experimental assessment on coconut shells on aggregate in concrete, International Journal of Engineering Science Invention, 2015, 2 (51), p. 07-11.
17. Olanipekun E.A., Olusola K.O., Ata O.A., Comparative study of concrete properties using coconut shell and palm kernel shell as coarse aggregates, Building and Environment, 2006, 41 (3), p. 297 – 301.
18. Damodhara S., Roddy B.D., Jyotty S.A., Experimental analysis of the use of coconut shell as coarse aggregate, IOSR Journal of Mechanical and Civil Engineering, 2014, 10 (6), p. 6-13.
19. Kumar S., Gupta R.C., Thomas B.S., Mehra P., Aggregate replacement and its usefulness in cement concrete for sustainable development – A study on rubber, jarosite and sandstone aggregate, Springer International Publishing, Switzerland, 2016.
20. Siddique R., Naik T.R., Properties of concrete containing scrap-tire rubber– An overview. Journal of Waste Management Elsevier, 2004, 24, p. 563-569.
21. Felipe J.A., Santos J., The use of recycled polymers and rubbers in concrete, Florida 2004.
22. BS 812:103: Method for determination of particle size distribution - Sieve tests, British Standards Institution, London, 1992.
23. BS 882: Specification for aggregates from natural sources for concrete, British Standards Institution, London, 1985.
24. BS 8110: Part 1: Structural use of concrete: Code of practice for design and construction, British Standards Institution, London, 1997.
25. BS 1881: Part 102: Method of determination of slump, British Standards Institution, London, 1983.
26. BS 4449: Carbon steel bars for the reinforcement of concrete, British Standards Institution, London, 2006.
27. BS EN 12390: Part 2: Testing hardened concrete: Making and curing of concrete for strength Test, British Standards Institution, London, 2000.
28. BS EN 12390: Part 3: Testing hardened concrete: Compressive strength Test specimen, British Standards Institution, London, 2000.
29. BS EN 12390: Part 7: Testing hardened concrete: Density of hardened concrete, British Standards Institution, London, 2000.