Engineering, Environment
Comparative studies on the effects of additives on the electrochemical behaviour of Mullite-Carbon ceramic composite
Fatai Olufemi ARAMIDE 1, 2* and Patricia Abimbola POPOOLA2
1 Department of Metallurgical and Materials Engineering, Federal University of Technology, P.M.B. 704, Akure, Nigeria
2 Department of Chemical, Metallurgical and Materials Engineering, Tshwane University of Technology, Staatsartillerie Road, Pretoria West, South Africa
E-mail(s): 1 AramideFO@tut.ac.za; foaramide@futa.edu.ng; 2 PopoolaAPI@tut.ac.za
* Corresponding author phone: +2348038509288 or +27813778360
Received: February 16, 2018 / Accepted: May 11, 2018 / Published: June 30, 2018
Abstract
Effects of sintering temperature with varied amount of silicon carbide and titania additives on electrochemical behaviour of sintered mullite-carbon ceramic composite in sulfuric acid was investigated. The samples were produced through solid-state reaction sintering of kaolinite and graphite after incorporating varied amount of the mentioned additives. The raw materials were mixed through ball mill. Standard sample were produced and sintered at temperature range of 13000C to 15000C. The samples were characterized for porosity and bulk density. The porosity of the samples was determined. Electrochemical behaviour of the samples was investigated using potentio-dynamic method. It was observed that due to decreased porosity, corrosion resistance of samples without additive increased initially with sintering temperature. Increased porosity makes the samples to be more susceptible to attack in the corrosive media. 4% titania improves on corrosion resistance of the sample in sulphuric acid. Sample C1 is highly resistant to corrosive action of 0.8 M sulfuric acid. 4% silicon carbide improved on the corrosion resistance of the sintered ceramic samples. The sample with 3% titania and 5% silicon carbide in 0.5 M sulfuric acid is more resistant to corrosion at 14000C. Sample C1 sintered at 13000C is considered to possess excellent corrosion resistance in 0.8 M sulphuric acid.
Keywords
Corrosion resistance; Corrosion rate; Apparent porosity; Ceramic composite; Mullite; Sintering temperature
Introduction
Ceramics due to the strong covalence bond that bond there elements together are generally more stable and strongly resistant to degradation in corrosive environments when compared to metallic materials [1]. The corrosion behaviour in ceramics is significantly govern by solubility while it is an electrochemical process that controls corrosion in metals [2, 3]. The vital roles being played by ceramics in the current technological development cannot be overemphasized. Ceramics are being utilized in the electrochemical treatment of wastewater, in which pollutants are transformed into non-toxic materials. This is being achieved through various methods by using ceramic based diaphragms, for illustration polluted streams of water can be treated through electro-coagulation [4] and ultra-filtration [5]. Ceramic based membranes had been modified to achieve improved selectivity, for cation transfer, which enables treatment through electro-dialysis [6]. Furthermore, micro-porous ceramic diaphragms offer stability against oxidizing agents, enabling their use in the electro dialytic removal of heavy metal cations [7].
For the electrochemical treatment of wastewater, fabricated ceramic membranes commercially available are highly expensive. Recently in order to reduce cost, research work is being focused on readily available and inexpensive raw materials such as raw clay, kaolin, fly ash, graphite and apatite to mention but few [8-18].
Advanced structural ceramics have been made used of in various applications for several decades [19]. The important service properties that made such ceramics attractive in such applications like heat exchanger and recuperators [20, 21], chemical processing facilities [22], durable electronic packaging [23], efficient engines [24].
However, the development of the applications of these advanced structural ceramic materials in the listed areas is faced with some challenges. These include brittle fracture susceptibility of such structural ceramics [25], sensitivity to environmentally induced corrosion [26] and the effects of such corrosion on the physico-mechanical properties and thermal performance of such ceramics [27].
Many researchers have focused their research activities on the corrosion phenomenon in ceramic based/related materials. Walkowicz et al. [28] investigated the effect of the compositional, structural and morphological properties of oxide ZrO2 and oxynitride ZrON films on the mechanical and corrosion characteristics of the ceramic coatings prepared for stainless steel substrates. They observed that the corrosion parameters are significantly increased in the cases of both oxynitride and oxide coatings in comparison with the stainless steel (AISI 316) substrates. Sudagar et al. [29] investigated corrosion behaviour of polymer-derived ceramics in aqueous hydrofluoric acid and sodium salts. The observed that the sample was resistant to attack in sodium chloride but highly susceptible to attack in sodium silicate at 10000C in 24 hours. They also observed that oxide based ceramics were degraded into powder form in hydrofluoric acid while non-oxide based ceramics were stable.
The aim of the present work is to investigate the effects of sintering temperature, silicon carbide and titania additives on the corrosion properties of mullite-carbon ceramic composites in varied concentrations of sulfuric acid.
Materials and Method
Raw materials
Clay sample used for this study was sourced from Okpella, Edo State southern part of Nigeria, Graphite were sourced (from Pascal Chemicals, Akure), and this were used to maintain the granulometry of the mixture.
Processing of raw materials (Graphite and Kaolin)
The raw materials (graphite and kaolin) were crushed into a coarse particle size, of about 10 mm for graphite and less than 2 mm for kaolin; the crushed samples were further reduced by grinding using Herzog rod mill. The powdered samples were sieved using 600 μm sizes aperture according to ASTM standards in an electric sieve shaker. The undersize that passed through the 600 μm sieve aperture were used in the samples making.
Phase and mineralogical composition of raw kaolin and graphite
The kaolin clay and graphite samples were carefully prepared for these analyses by digesting in reagents as described by Nabil and Barbara [30]. The mineralogical phases present in the samples were determined using X-ray diffractometry (XRD).
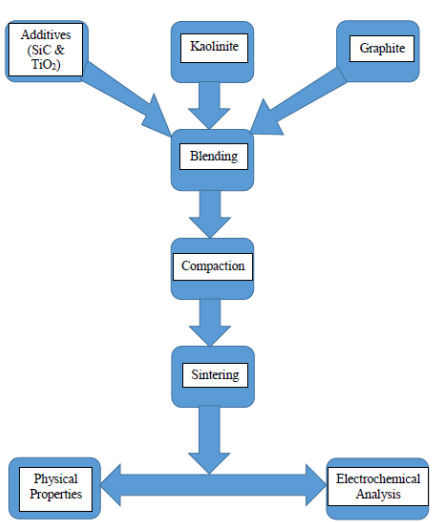
Figure 1. Flowsheet of methods
The samples were prepared for XRD analysis using a back loading preparation method. They were analysed using a PANalytical X’Pert Pro powder diffractometer with X’Celerator detector and variable divergence- and receiving slits with Fe filtered Co-Kα radiation. The phases were identified using X’Pert High score plus software. The receiving slit was placed at 0.040°. The counting area was from 5 to 70° on a 2θ scale. The count time was 1.5 s. The temperature-scanned XRD data were obtained using an Anton Paar HTK 16 heating chamber with Pt heating strip Graphical representations of the qualitative result follow below. The relative phase amounts (weight %) was estimated using the Rietveld method (Autoquan Program) as reported by Young et al. Amorphous phases, if present were not taken into consideration in the quantification.
Composition calculation using the rule of mixtures technique
Rule of Mixtures is a method of approach to approximate estimation of composite material properties, based on an assumption that a composite property is the volume weighed average of the phases (matrix and dispersed phase). According to Rule of Mixtures [31] the density of composite materials are estimated as follows Eq. (1-2):
ρmixture = Wtf kaolin × ρ kaolin + Wtf.graphite × ρgraphite (1)
Mmixture = ρmixture × vol. mould. (2)
Where: ρmixture - density of the mixture; Mmixture - the mass of the mixture; Wtf. kaolin - the weight fraction of kaolin; ρkaolin - the density of kaolin; Wtf.graphite - the weight fraction of graphite; ρgraphite - the density of graphite and vol.mould - volume of mould.
Composites production
The raw materials in the samples making were 3:2 vol % of kaolin and graphite. The mixture were blended thoroughly for proper distribution of constituents materials in a ball mill for 3 hours at a speed of 72 rev/min after weighing via electronic weighing balance in accordance with the composition calculation initially prepared [32, 33].
The resulting blended compositions were mixed with 10% water of the amount of kaolin content in each composition; this was in order to enhance the plasticity of the mixture during compaction.
The mixed samples were subjected to uniaxial compaction, which was carried out mechanically under pressure. The moulded materials were fired at varying temperatures (13000C, 14000C and 15000C). After which the samples were subjected to various test, to examine the phase analysis, evaluate their physical and mechanical properties.
The Table 1 below shows the percentage amount of various raw materials used in producing the samples.
Table 1. Showing the compositions of various samples used for this research investigation
|
Samples |
A |
B1 |
B2 |
C1 |
C2 |
D |
|
% Kaolin |
60 |
58.8 |
57.6 |
57.6 |
55.2 |
55.2 |
|
% Graphite |
40 |
39.2 |
38.4 |
38.4 |
36.8 |
36.8 |
|
% SiC |
_ |
_ |
_ |
4 |
8 |
5 |
|
% TiO2 |
_ |
2 |
4 |
_ |
_ |
3 |
Sintering process
The moulded materials were fired at varying temperatures (13000C, 14000C and 15000C) in an electric furnace. The rate of firing differs with increased temperature (room temperature to 5000C the sintering rate was 250C/minute, 5010C to 10000C the sintering rate was 100C/minute while above 10000C the sintering rate was 10C/minute). On reaching the various sintering temperatures, the samples were held for one hour at the temperature before the furnace was switch off and the samples were allowed to cool in the furnace. The samples were subjected to various tests to examine the phase analysis, evaluate their physical and mechanical properties.
Apparent porosity
Test samples from each of the ceramic composite samples were dried out for 12 hours at 110°C. The dry weight of each fired sample was taken and recorded as D. Each sample was immersed in water for 6 hours to soak and weighed while being suspended in air. The weight was recorded as W. Finally, the specimen was weighed when immersed in water [32, 33]. This was recorded as S. The apparent porosity was then calculated from the Eq. (3):
% apparent
porosity = ![]() (3)
(3)
Where: D - weight of dried specimen, S - weight of dried specimen suspended in water, and W - weight of soaked specimen in air.
Electrochemical measurements
The electrochemical experiments were carried out using AUTOLAB PGSTAT 204N (Galvanostat/Potentiostat) device equipped with a computer, GPES (General purpose electrochemical system) Nova software. The experiment was performed using three electrode electrochemical cell set-up comprising of mullite-graphite ceramic composite as the working electrode, saturated Ag/Agcl electrode as the reference electrode, and platinum rod as the counter electrode.
The analysis was carried out using different concentrations of sulphuric acid (0.5M and 0.8M H2SO4 solution) as the electrolyte. The working electrode (ceramics composite electrode) was immersed in a test solution for 30 minutes until a stable open circuit potential was attained. Other electrodes were immersed in the solution, and all the electrodes are connected to the potentiostat. The potentiostat allows variable potential to be effected in the composite sample in a controlled manner and measured the current that flows as a function of potential. Electrochemical behaviour of mullite-carbon ceramic composite electrodes were determined by using Auto lab (General Purpose Electrochemical System) both control potential (potentiostat) and controlled current (Galvanostatic) polarization is useful. When the polarization is done potentiostatically, current is measured, and when it is done galvanostatically, potential is measured.
The electrochemical characteristics such as corrosion current, corrosion rate and polarization resistance were used to verify the electrochemical behaviours of the ceramics composite electrodes in the acidic electrolyte.
Results and Discussion
Effect of sintering temperatures and porosity on the electrochemical behaviour of the samples A
Figures 2 and 4 show the effects of sintering temperatures on the electrochemical behaviour of the ceramic samples A, without any additive. Figure 2 shows the effect of sintering temperature on the apparent porosity of the sample. It is not within the scope of this article to discuss the phases developed in the sample; this has been taken discussed in Aramide et al. [34].
Figure 2 shows the effects of sintering temperature on the corrosion resistance (polarization resistance) of the samples with no additive in varied concentration of sulphuric acid.
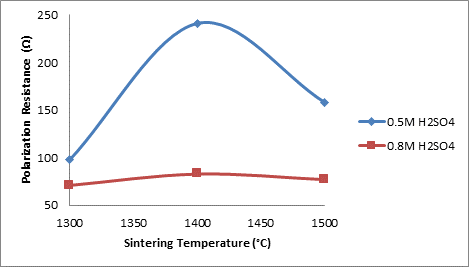
Figure 2. Effects of sintering temperature on the corrosion resistance of the samples A
From the Figure 2, it is observed that the corrosion resistance of the samples in both media increased initially with increased sintering temperature. For the 0.5 M H2SO4 the corrosion resistance of the sample was initially 97.835 Ω at 13000C. The corrosion resistance then increased with increased sintering temperature to 241.13 Ω as the sintering temperature increased to 14000C.
Further increase in the sintering temperature resulted in the corrosion resistance reduced to 158.02 Ω. Comparing this with Figure 2 in which the relationship between the corrosion resistance of the ceramic samples and their porosities is clearly shown.
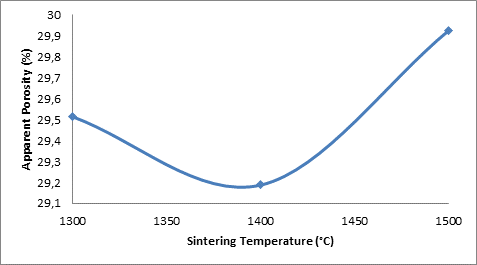
Figure 3. Effect of sintering temperature on the apparent porosity of the samples A
From the Figure 3 the porosity of the sample in 0.5M H2SO4 was initially 29.513% when the corrosion resistance was 97.835Ω (i.e. at 1300°C) it is observed that as the porosity decreased to 29.188% the corrosion resistance of the sample increased to 241.13Ω (i.e. at 1400°C). The corrosion resistance is observed to reduce to 158.02Ω (at 1500°C) as the porosity of the sample is further increased to 29.926%. The initial increase in the corrosion resistance of the samples in both media is due to reduction in the apparent porosity of the samples. It could be inferred that increase in porosity of a ceramic sample makes it to be more susceptible to attack in a corrosive medium.
Furthermore, from Figure 2 the samples in 0.8M H2SO4 is observed to follow the same trend with those in 0.5M H2SO4, only with lower corrosion resistance. This is because higher concentration of the acid could attack the ceramic more. For both media, the optima corrosion resistance is observed at 1400°C. As it is clearly observed, the corrosion (polarization) resistance increases with decreased porosity and decreases with increased porosity. This is similar to the relationship between thermal conductivity and porosity as explained by Aramide [35]. In fact, the more porous a ceramic material is the more susceptible is it to attack in a corrosive environment [36]. Just like in the rate of reaction, the surface area is one of the factors that affect the rate of chemical reaction. The more porous a body is the higher its surface area. This is the reason the corrosion (polarization) resistance of the samples increased with decreased porosity and reduced with increased porosity. It is equally observed that the corrosion resistance of the samples is higher in 0.5M H2SO4 than it is in 0.8M H2SO4.
Figure 4 shows the effects of sintering temperature on the corrosion rate of the samples in the various media.
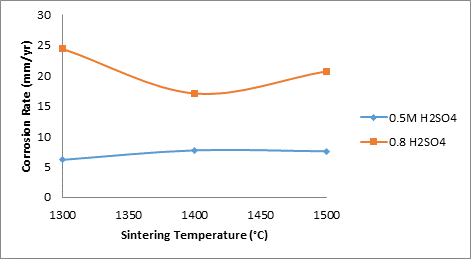
Figure 4. Effects of sintering temperatures on the corrosion rate of the samples
From the Figure 4, it is conspicuously seen that the corrosion of the samples in 0.8M H2SO4 is much higher than in 0.5M H2SO4. This is expected as the corrosion rate of the sample could be said to be synonymous to the rate of acid attach on the sample. This is equal to rate of chemical reaction of the acid with the constituents of the ceramic samples. Comparing this with Figure 3, it is clearly seen that the relationship of porosity of the sample with the corrosion rate is directly proportional. The corrosion rate increase with increase percentage porosity of the samples.
Effect of Titania additive on the electrochemical behaviour of the samples
Figures 5 and 7 show the effects of sintering temperature and titania additive on the electrochemical behaviour of the samples, while Figure 6 shows the effect of sintering temperature on the apparent porosity of the samples. From Figure 4 the relationship between the sintering temperature of the samples and the corrosion resistance of the samples with titania additive is clearly depicted. It is observed that for samples with 2% titania (B1) the corrosion resistance of the sample in 0.5M H2SO4 reduces with increased sintering temperature. At 13000C the corrosion resistance of the sample was 470.86 Ω, as the sintering temperature was increased to 14000C, the corrosion resistance is observed to reduce to 122.84 Ω further increase in the sintering temperature to 15000C resulted in the corrosion resistance being reduced to 74.125 Ω.
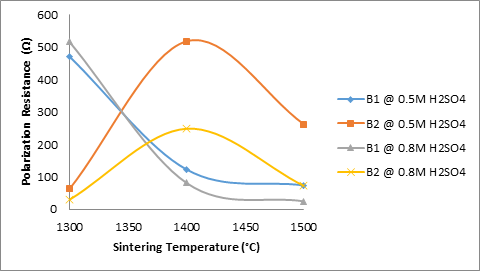
Figure 5. Effects of sintering temperatures and TiO2 additives on the corrosion resistance of the samples
Comparing this with the behaviour of the same sample in 0.8M H2SO4, it is observed that the sample followed the same trend; the corrosion resistance reduced with increased sintering temperature. At 1300°C the corrosion resistance of the sample was 516.27 Ω, as the sintering temperature was increased to 1400°C, the corrosion resistance is observed to reduce to 81.309 Ω further increase in the sintering temperature to 1500°C resulted in the corrosion resistance being reduced to 25.015 Ω. Moreover, comparing this with Figure 7, which shows how porosity of the samples B1 relates with their corrosion resistance, it is observed that the porosity the samples was 31.667% (at 1300°C), it the reduced to 30.743% as the sintering temperature was increased to 1400°C. It then increased to 31.49% with further increase in the sintering temperature. The behaviour of samples B2 (4% titania) is somehow different from that of samples B1; both in 0.5M and 0.8M H2SO4.
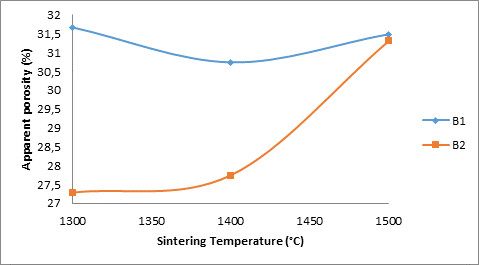
Figure 6. Effects of apparent porosity of the B1 samples on their corrosion resistance
It is observed that from Figure 6 that the corrosion resistance of the samples B2 in both media initially increased with increased sintering temperature and then later reduced with further increase in the sintering temperature of the samples. Comparing this with Figure 6 which shows how porosity of the samples B2 relates with their corrosion resistance, it is observed that the porosity of the samples was 27.28% (at 1300°C), it then increased to 27.748% as the sintering temperature was increased to 1400°C. It then increased to 31.309% with further increase in the sintering temperature. The difference in the behaviour of the samples can be attributed to the increase in the amount of the titania additive in the sample. Corrosion resistance supposed to increase with reduction in the apparent porosity of the samples and reduce with increase in apparent porosity of the samples. Only sample B1 in both media obeyed the rule, but sample B2 (4%) titania did not in the initial time. This could be that the 4% titania additive improves the corrosion resistance of the samples at 1400°C.
Moreover, Figures 7 shows the effects of sintering temperature and titania additives on the corrosion rate of the samples in varied concentrations of sulphuric acid. From Figure 9 it is observed that for samples B1 (2% titania), corrosion rate initially increased with increase in sintering temperature for both media. Further increase in the sintering temperature resulted in reduction of the corrosion rate of the sample in both media. It is equally observed that the corrosion rate of the sample in 0.8M H2SO4 is higher than in 0.5M H2SO4. Juxtaposing this with Figure 10 which shows the effect of porosity on the corrosion rate of sample B1 in the varied concentration of sulphuric acid, it is observed that the corrosion rate of the samples initially increased with reduced apparent porosity. But as the porosity increased, the corrosion rate then reduced. This could be the effect of the 2% titania additive on the sintered ceramic sample.
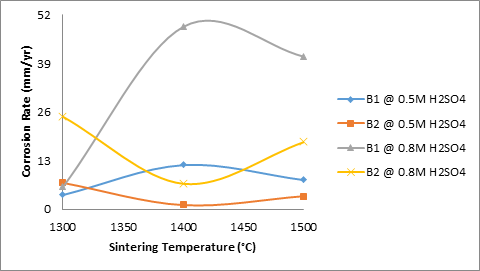
Figure 7. Effects of sintering temperature and TiO2 additives on the corrosion rate of the samples
Furthermore, from Figure 7 it is also observed that the corrosion rate of the sample B2 (4% titania) initially reduced with increased sintering temperature. Further increase in the sintering temperature beyond 1400°C resulted in the corrosion rate being increased. It is equally observed that the corrosion rate of sample B2 in 0.8M H2SO4 at a sintering temperature of 1400°C and 1500°C is much lower than that of B1 in 0.8M H2SO4. Also the corrosion rate of sample B2 in 0.5M H2SO4 at a sintering temperature of 1400°C and 1500°C is much lower than that of B1 in 0.5M H2SO4. It could be inferred that 4% titania additives improves on corrosion resistance of the sintered ceramic sample in sulphuric acid. This also clearly depicted in Figure 6.
Effect of Silicon carbide additive on the electrochemical behaviour of the samples
Figures 8 and 10 show the effects of sintering temperature and silicon carbide additives on the electrochemical behaviour of the sintered ceramic samples in varied concentration of sulphuric acid. From Figure 8 the effect of sintering temperature and silicon carbide additives on the corrosion resistance of the sintered ceramic samples is clearly depicted. It is observed that sample C1 (4% silicon carbide) sintered at 13000C and 15000C is highly resistant to corrosive action of 0.8M H2SO4. This is followed by sample C2 (8% silicon carbide) sintered at 13000C is highly resistant to corrosive action of 0.5M H2SO4. It could be inferred that 4% silicon carbide improved on the corrosion resistance of the ceramic sample within the mentioned parameters.
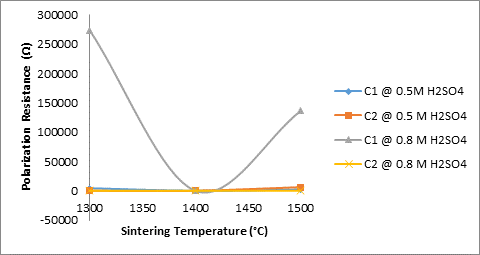
Figure 8. Effects of sintering temperatures and SiC on the corrosion resistance of the samples
Furthermore, Figure 10 shows the effects of sintering temperature and silicon carbide additives of the corrosion rate of the sintered ceramic samples in the varied concentration of sulphuric acid.

Figure 9. Effect of sintering temperature on the apparent porosity of the samples C
From figure 10 it is observed that the corrosion rate of sample C1 (4%) silicon carbide in 0.8M H2SO4 is the lowest. This is closely followed by sample C1 in 0.5M H2SO4, while the corrosion rate of sample C2 (8%) silicon carbide in 0.8M H2SO4 was observed to be the highest.
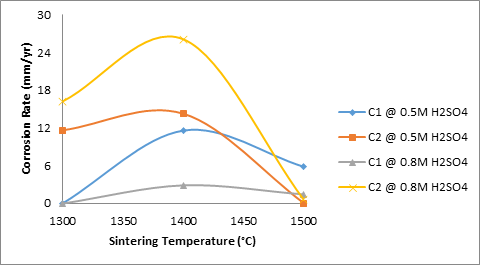
Figure 10. Effects of sintering temperatures and SiC additives on the corrosion rate of the samples
This confirms the inference that 4% silicon carbide improved on the corrosion resistance of the sintered ceramic samples. Figure 9 which showed the effects of sintering temperature on the apparent porosity of the samples corroborate this inference.
Combined effects of Silicon carbide and Titania additives on the electrochemical behaviour of the samples
Figures 11 and 13 show the effects of sintering temperature with combination of silicon carbide and titania additives on the electrochemical behaviour of the sintered ceramic samples (containing 5% silicon carbide and 3% titania) in varied concentration of sulphuric acid. Figure 12 also showed the effects of sintering temperature on the apparent porosity of the samples. Figure 11 depicts the effects of sintering temperature with combination of silicon carbide and titania additives on the corrosion resistance of the sintered ceramic samples in varied concentration of sulphuric acid. From the figure it can be observed that the corrosion resistance of the sample in 0.5M H2SO4 initially increased with increased sintering temperature from 526.65 Ω (at 1300°C) to 907.04 Ω (at 1400°C). Further increase in the sintering temperature of the samples resulted in the reduction in the corrosion resistance of the sample to 149.9 Ω (at 1500°C). Comparing this with the behaviour of the sample in 0.8M H2SO4, it is observed that the corrosion resistance of the sample reduces linearly with increased sintering temperature. Similarly, from Figure 12 which shows showed the effects of sintering temperature on the apparent porosity of the samples, it is observed that the porosity of the samples have a great influence on their corrosion resistance.
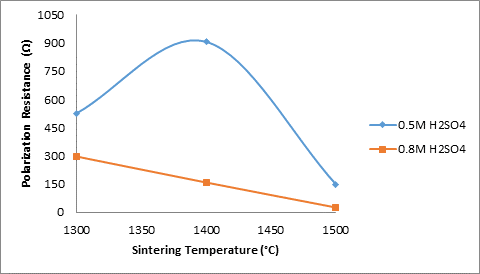
Figure 11. Effects of sintering temperature with SiC and TiO2 additives on the corrosion resistance of the samples
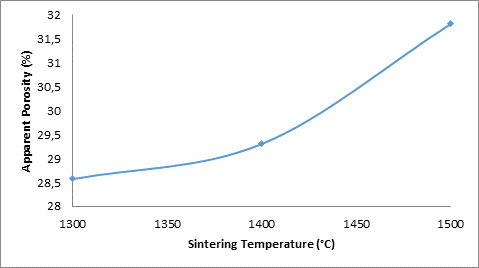
Figure 12. Effect of sintering temperature on apparent porosity of sample D
From the Figure 12, it is observed that the corrosion resistance of the sample in 0.5M H2SO4 initially increased with increased apparent porosity of the sample. Then further increase in the apparent porosity resulted in the corrosion resistance being reduced. But for the sample in 0.8M H2SO4, the corrosion resistance of the sample is observed to reduced progressively with increased apparent porosity of the samples.
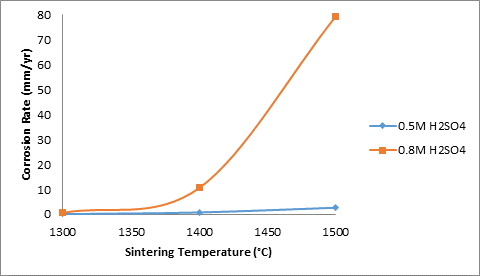
Figure 13. Effects of sintering temperatures with SiC and TiO2 additives on the corrosion rate of the samples
Moreover, Figure 13 shows the effects of sintering temperature with the combination of 5% silicon carbide and 3% titania additives on the corrosion rate of the sintered ceramic samples in varied concentration of sulphuric acid. From the figure it is observed that the corrosion rate of the samples in both media increased with increased sintering temperature. But the corrosion rate of the samples in 0.8M H2SO4 is more pronounced and increased sharply with increased sintering temperature. It can also be observed that the corrosion rate of the samples followed the same trend with increased apparent porosity of the samples (Figure 12).
Conclusion
The corrosion resistance of the samples without additive in both media increased initially with increased sintering temperature, this was due to decrease in the apparent porosity of the samples; The increase in porosity of a ceramic sample makes it to be more susceptible to attack in the corrosive media; 4% titania additives improves on corrosion resistance of the sintered (1400°C) ceramic sample in sulphuric acid; Sample C1 (4% silicon carbide) sintered at 1300°C and 1500°C is highly resistant to corrosive action of 0.8M H2SO4; 4% silicon carbide improved on the corrosion resistance of the sintered ceramic samples; The sample with 3% titania and 5% silicon carbide in 0.5M H2SO4 is more resistant to corrosion at 1400°C; Sample C1 (4% silicon carbide) sintered at 1300°C is considered to possess excellent corrosion resistance in 0.8M sulphuric acid.
Acknowledgments
The financial assistance of The World Academy of Science (TWAS) in collaboration with National Research Foundation (NRF) towards this research is hereby acknowledged. Opinions expressed and conclusions arrived at, are those of the author and are not necessarily to be attributed to TWAS and NRF.
References
1. Jacobson N.S., Opila E.J., Lee K.N., Oxidation and corrosion of ceramics and ceramic matrix composites, Current Opinion in Solid State and Materials Science, 2001, 5, p. 301–309.
2. C´urkovic´ L., Jelač M.F., Kurajica S., Corrosion behaviour of alumina ceramics in aqueous HCl and H2SO4 solutions, Corros. Sci., 2008, 50, p. 872–878.
3. Lee D.B., Nguyen T.D., Kim D.J., High-temperature SO2-gas corrosion of TiN–Ti5Si3 composites prepared by polymer pyrolysis, Corros. Sci., 2011, 53, p. 283–289.
4. Li M., Wu G., Guan Y., Zhang X., Treatment of river water by a hybrid coagulation and ceramic membrane process, Desalination, 2011a, 280 (1–3), p. 114–119.
5. Linkov V.M., Belyakov V.N., Novel ceramic membranes for electro dialysis, Sep. Purif. Technol., 2001, 25 (1–3), p. 57–63.
6. Gringer N., Hosseini S.V., Svendsen T., Undeland I., Christensen M.L., Baron C.P., Recovery of biomolecules from marinated herring (Clupea harengus) brine using ultrafiltration through ceramic membranes, Food Sci. Technol., 2015, 63 (1), p. 423–429.
7. Linkov V. and Belyakov V.N., Novel ceramic membranes for electro dialysis, separation and purification technology, 2001, 25 (1), p. 57-63.
8. Dzyazko Y.S., Mahmoud A., Lapicque F., Belyakov V.N., Cr(VI) transport through ceramic ion-exchange membranes for treatment of industrial wastewaters, J. Appl. Electrochem., 2007, 37 (2), p. 209-217.
9. Schillo M.C., Park L.S., Chiu W.V., Verweij H., Rapid thermal processing of inorganic membranes, J Membr Sci., 2010, 362, p. 127-133.
10. Zhu J., Fan Y., Xu N., Preparation and characterization of alumina membranes on capillary supports: effect of film-coating on crack-free membrane preparation, Chin. J. Chem. Eng., 2010, 3, p. 377-383.
11. Qin W., Peng C., Lv M., Wu J., Preparation and properties of high-purity porous alumina support at low sintering temperature, Ceram Int., 2014, 40, p. 13741-13746.
12. Wang Y.H., Tian T.F., Liu X.Q., Meng G.Y., Titania membrane preparation with chemical stability for very hash environments applications, J. Membr Sci., 2006, 280, p. 261-269.
13. Palacio L., Bouzerdi Y., Ouammou M., Albizane A., Bennazha J., Ceramic membranes from Moroccan natural clay and phosphate for industrial water treatment, Desalination, 2009, 245, p. 501-507.
14. Khemakhem M., Khemakhem S., Ayedi S., Amar R.B., Study of ceramic ultrafiltration membrane support based on phosphate industry sub product: application for the cuttlefish conditioning effluents treatment, Ceram. Int., 2011, 37, p. 3617-3625.
15. Khemakhem M., Khemakhem S, Ayedi S., Cretin M., Amar R.B., Development of an asymmetric ultrafiltration membrane based on phosphates industry sub-products, Ceram Int., 2015, 49, p. 10343-10348.
16. Zenikheri F., Boudaira B., Bouzerara F., Guechi A., Foughali L., A new and economic approach to fabricate resistant porous membrane supports using kaolin and CaCO3, J. Eur. Ceram. Soc., 2014, 34, p. 1329-1340.
17. Cao J., Dong X., Li L., Dong Y., Hampshire S., Recycling of waste fly ash for production of porous mullite ceramic membrane supports with increased porosity, J. Eur. Ceram. Soc., 2014, 34, p. 3181-3194.
17. Jedidi I., Saïdi S., Khemakhem S., Larbot A., Elloumi-Ammar N., Elaboration of new ceramic microfiltration membranes from mineral coal fly ash applied to waste water treatment, J. Hazard Mater., 2009, 172, p. 152-158.
18. Ayadi S., Jedidi I., Rivallin M., Gillot F., Lacour S., Elaboration and characterization of new conductive porous graphite membranes for electrochemical advanced oxidation processes, J. Membr. Sci., 2013, 446, p. 42-49.
19. Katz R.N., Opportunities and prospects for the application of structural ceramics, in structural ceramics, J.B. Wachtman, Jr., ed., Treatise on Materials Science and Technology, Academic Press, 1989, 29, p. 1-26.
20. Van der Biest O., Van de Voorde M., and McCauley R.A., Ceramics for high temperature heat exchangers, in high temperature equipment, A.E. Sheindlin, ed., Hemisphere Publishing Corporation, 1986, p. 323-352.
21. Dapkunas S.J., Ceramic heat exchangers, Ceram. Bull., 1988, 67 (2), p. 388-391.
23. Shumay Jr. W.C., Corrosion in electronics, Advanced Materials & Processes Inc., Metal Progr., 1987, 132 (3), p. 73-77.
22. Huckins H.A., Apply advanced ceramics more widely in chemical processes, Chem. Eng. Progr., 1991, 87 (2), p. 57-60.
24. Bryzik W. and Kamo R., Adiabatic engines, Worldwide Review, SP-571, Society of Automotive Engineers, Inc., 1984.
25. Pask J.A., Structural ceramics, J. Mater. Eng., 1989, 11 (4), p. 267-274.
26. Sheppard L.M., Corrosion-resistant ceramics for severe environments, Ceram. Bull., 1991, 70 (7), p. 1146-1166.
27. Munro R.G., Begley E.F. and Baker T.L., Strengths and deficiencies in published Advanced Ceramics Data, Ceram. Bull., 1990, 69 (9), p. 1498-1502.
28. Walkowicz J., Zavaleyev V., Dobruchowska E., Murzynski D., Donkov N., Zykova A., Safonov V. and Yakovin S., Corrosion properties of zirconium-based ceramic coatings for micro-bearing and biomedical applications, 19th International Summer School on Vacuum, Electron and Ion Technologies (VEIT2015) IOP Publishing, Journal of Physics: Conference Series, 2016, 700, 012026 doi:10.1088/1742-6596/700/1/012026
29. Sudagar J., Sujith R. and Ravi K., Corrosion of polymer-derived ceramics in hydrofluoric acid and sodium salts, Advances in Science and Technology, 2014, 89, p. 82-87.
30. Nabil R.B. and Barbara Z., Sample preparation for atomic spectrometric analysis: an overview, Advances in Applied science research, 2012, 3 (3), p. 1733 – 1737.
31. Surappa M.K., Aluminium matrix composites: Challenges and opportunities, Sadhana, 2003, 28, Parts 1 & 2, p. 319 – 334.
32. Aramide F.O., Effects of sintering temperature on the phase developments and mechanical properties ifon clay, Leonardo Journal of Sciences, 2015, 26, p. 67 – 82.
33. Aramide F.O., Alaneme K.K., Olubambi P.A., and Borode J.O., Effects of 0.2Y‐9.8ZrO2 addition on the mechanical properties and phase development of sintered ceramic produced from Ipetumodu clay, Faculty Engineering Hunedoara-International Journal of Engineering, 2014, 7 (4), p. 343 – 352.
34. Aramide F.O., Akintunde I.B., Oyetunji A., Insitu synthesis and characterization of mullite-carbon refractory ceramic composite from Okpella kaolin and graphite, Usak University Journal of Material Sciences, 2016, p. 25-42.
35. Aramide F.O., Production and characterization of porous insulating fired bricks from ifon clay with varied sawdust admixture, Journal of Minerals and Materials Characterization and Engineering, 2012, 11, p. 970 ‐ 975.
36. Hench L.L., Bioactive glasses help heal, repair and build human tissue, Glass Res., 2002–2003, 12 (1–2), p. 18 - 32.
Appendix A
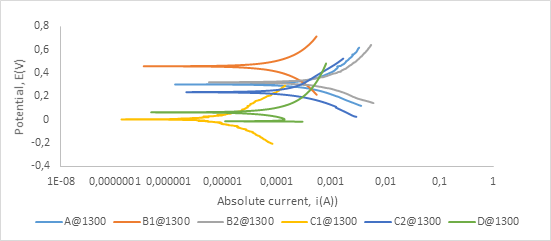
Figure A1. Polarization curves showing anodic and cathodic components of current for samples sintered at 1300°C in 0.5M H2SO4 electrolyte with scan rate of 1 mV/s
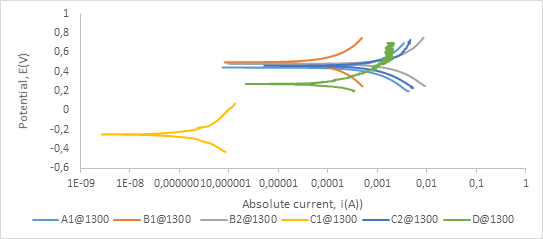
Figure A2. Polarization curves showing anodic and cathodic components of current for samples sintered at 1300°C in 0.8 M H2SO4 electrolyte with scan rate of 1 mV/s
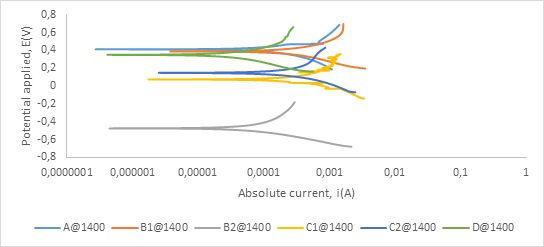
Figure A3. Polarization curves showing anodic and cathodic components of current for samples sintered at 1400°C in 0.5 M H2SO4 electrolyte with scan rate of 1mV/s
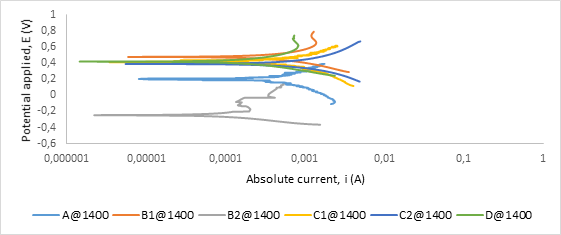
Figure A4. Polarization curves showing anodic and cathodic components of current for samples sintered at 1400°C in 0.8 M H2SO4 electrolyte with scan rate of 1 mV/s
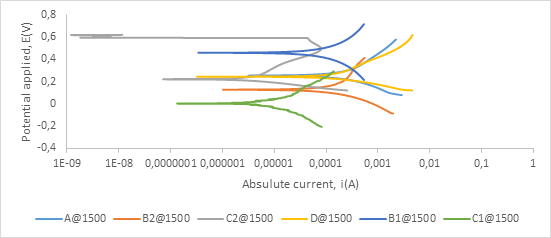
Figure A5. Polarization curves showing anodic and cathodic components of current for samples sintered at 1500°C in 0.5 M H2SO4 electrolyte with scan rate of 1 mV/s
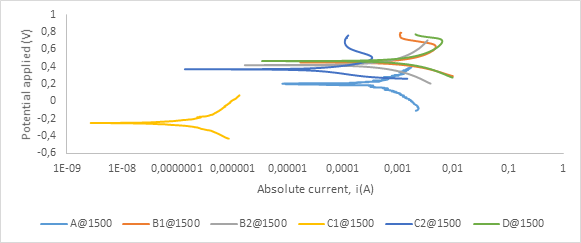
Figure A6. Polarization curves showing anodic and cathodic components of current for samples sintered at 1500°C in 0.8 M H2SO4 electrolyte with scan rate of 1 mV/s