Engineering, Environment
A mathematical correlation of porosity and permeability for Niger Delta depobelts formation using core analysis
Boniface Aleruchi ORIJI1*, Chidinma Udochi OKPOKWASILLI2
1 Department of Petroleum Engineering, University of Port Harcourt, Nigeria.
2 Institute of Petroleum Studies, University of Port Harcourt/IFP, Nigeria.
E-mail(s): 1 aloriji2000@yahoo.com
* Corresponding author, phone: +2347057094558,
Received: March 20, 2018 / Accepted: May 25, 2018 / Published: June 30, 2018
Abstract
There has been no universal mathematical relationship developed for porosity and permeability for Niger Delta Depobelts formation using Core Analysis. The existing mathematical relationship between porosity and permeability developed from wireline logs has been complex due to the incorporation of several variables. Accurate estimation of rock property from core analysis is essential and needed for efficient reservoir characterization. A common practice to draw relationship between these two parameters (porosity & permeability) is usually graphical, for instance using picket plots for general trends in the well logs data. Trends from picket plots are mostly explicit and subjective, that is, limited to each well and cannot be extrapolated to full field if the degree of heterogeneity is significant. However, core analysis gives a better representation of the sample; therefore, developing a mathematical relationship for it becomes necessary. Statistical methods, that is regression analysis and probability distribution were developed using appropriate core data. These techniques ultimately helped in developing a linear mathematical model for prediction. This work focused on correlating porosity and permeability using data obtained from core analysis in two (2) depobelts in Niger Delta. Each depobelt had several reservoirs along with their corresponding pressures. Also, for best estimates, semi-log graphs were used to generate decent goodness of fits. Also, the use of residual plots was presented to deal with outliers that normally come from heterogeneity. Conclusively, from the correlations generated, more precise estimates of reserves/resources and production forecast can be made.
Keywords
Permeability; Mathematical Model; Core analysis; Depobelts
Introduction
Porosity and permeability are the essential controls in the reservoir potential. Better porosity measurements have long been a focus for research in the industry since the 1950s. Some reservoir engineers proposed complex methods to estimate essential reservoir properties; such as porosity and permeability. However, early attempts to model pore dimensions and permeability in reservoirs were not very successful, either as representation of fluid movement or as tools to predict production rates. In coring industries, errors are made in obtaining reservoir permeability and porosity because wrong values are gotten from the machines (i.e. porosimeter). Therefore, a background idea of these parameters during drilling could guide the lab technologist in evaluating these values. There is a relationship between each pair of three fundamental petrophysical properties; porosity, absolute permeability and water saturation [1].
Krumbien and Monks in [2] plotted permeability against grain size on a log-log graph, and they concluded that permeability (k) decreases as grain length decreases.
Coring is also a means of obtaining additional information about the reservoir, unavailable from other sources such as well logs [3]. Field analysis of cores can be highly expensive due to the requirement of portable equipment and skilled operators at the well site. For this reason, many companies decide against undertaking analysis at the well site, opting to transport core samples to the laboratory instead [4].
Naeem et al in [5] implemented a well-known regression analysis strategies using Shapiro-Wilk test, Quantile-Quantile (Q-Q) plot, Cook’s distance and residual plots to address outliers which normally come from heterogeneity. These strategies helped expand a linear mathematical model for prediction. Average values obtained with this method are more dependable than the ones received using simple averaging methods. Regression technique could be used for any porosity – permeability statistics regardless of rock kind and source, and a fairly sturdy linear mathematical version can be used for prediction. Naeem and Abid in [5] applied a regression evaluation on porosity- permeability data following a step smart manner and subsequently derived a linear mathematical model for predicting the permeability from porosity.
Ubanatu et al in [6] did a correlation of permeability – porosity – saturation for Niger Delta with the use of log data. Permeability was measured using wire line logs and a correlation which enabled fast and easy dedication of permeability for Niger Delta reservoir. Over 250 reservoirs were analyzed and about 247 data points were used for the development of the correlation using wireline log data. Afterwards, DATAFIT 9.0 was used to develop a non-linear multiple variable regression correlation. The calculation was accomplished with excel and the values were imported into DATAFIT 9.0 which completed the regression.
This study is aimed at accurately determining porosity and permeability for Niger Delta reservoirs by developing and validating mathematical models from the results gotten from experimental core analysis on core samples taken from wells in Niger Delta.
Material and method
Core analysis data was obtained from eleven (11) reservoirs spanning across 2 depobelts within the Niger Delta. Some of the reservoirs having comparable depobelts had been analysed together and in the process, two (2) depobelts have been analysed: Greater Ughelli Depobelt and Northern Delta Depobelt.
Each of the reservoirs was analysed by plotting porosity to permeability and outliers were removed until acceptable coefficients of regression (R2 value) were obtained after which unique equations for the different wells were generated.
Among numerous transformations, R2 value of 50% is the minimum acceptable for Niger Delta porosity and permeability correlation as derived from the graphs.
Permeability could be represented mathematically with the following equations Kozeny in [7] defined permeability as Eq. [1]:
![]() (1)
(1)
Where: Kz - Kozeny equation constant; Sv - surface area exposed to fluid per unit volume of solid material; ɸ - porosity and K - absolute permeability.
Morris and Briggs in [8] presented that Eq. [2]
 (2)
(2)
Where: ɸ - porosity; C = 250 for oil and 79 for gas; Swi - irreducible water saturation in fraction and K - permeability (mD).
Permeability for this study was estimated using the Darcy's equation presented in Eq. [3] below:
![]() (3)
(3)
Where: Q - flow rate (cm3sec-1), μ- fluid viscosity (cp), L- sample length (cm), A - sample cross-sectional area (cm2), ΔP - differential pressure across core (psi), K- permeability (mD)
Regression evaluation
Using the Analysis Tool Pack add-in in Microsoft Excel, regression analysis was employed to know if the data analysed was an excellent fit, determine the error margin and verify the confidence level of the data. The following are ways of interpreting correlation using regression analysis were adopted for this study.
1. The coefficient of determination, R2, way that close to x% of the variation inside the based variable is defined by the independent variables.
2. Significant F should be < 0.05. If it is > 0.05, it is not statistically significant.
3. P value should be < 0.05 and so, the null hypothesis should be rejected and this means that there is an effect between the dependent and independent variable.
4. Residual Plots: This showed the randomness of data. A good residual plot should be a random plot centred on zero and this shows that none of the predictors are missing. The random pattern of the data indicates that a linear model gives a decent fit to the data.
In Figure 1 we have the flow chart diagram:
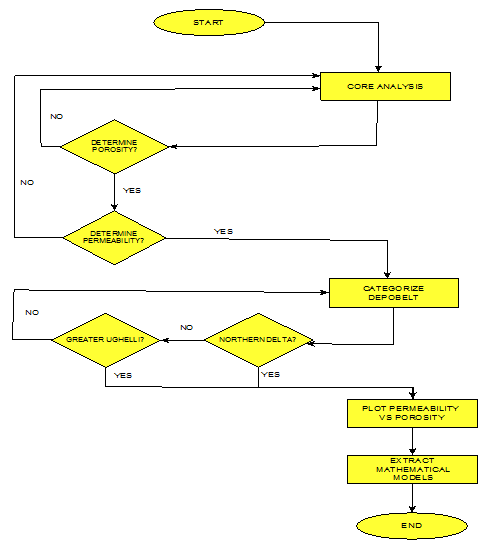
Figure 1. Study flow chart
Results and discussion
To establish a correlation between permeability and porosity using core data, plot of effective permeability against porosity was made on a graph for different depobelts. Figures 2 to 19 shows the permeability-porosity plots for reservoirs A to I in the Northern Delta depobelt while Figures 20 to 24 shows the permeability-porosity plots for reservoirs K and L in the greater Ughelli depobelt. Tables 1 to 9 shows the data analysis summary for reservoirs A to I in the Northern Delta depobelt while Tables 10 and 11 shows the data analysis summary for reservoirs K and L in the greater Ughelli depobelts. Table 12 shows a summary of all mathematical correlations developed for reservoirs A to L. It shows the mathematical models derived from the plots of permeability against porosity and their corresponding normalized forms.
Data analysis for Northern Delta Depobelt
1. Reservoir A – 1000 psi
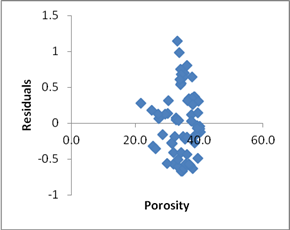
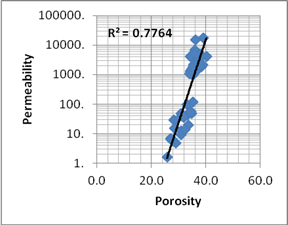
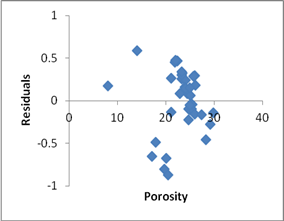
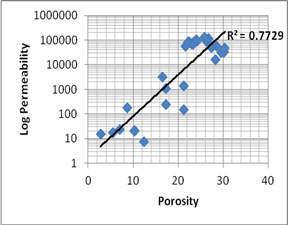
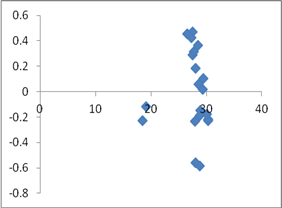
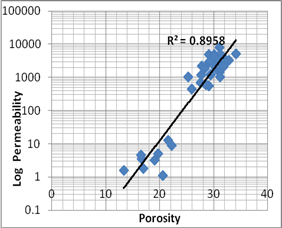
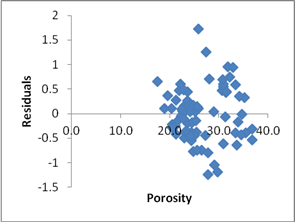
Figure 2 shows the permeability-porosity plot for reservoir A while Figure 3 is the residual plot of reservoir A which shows the randomness of the plotted data.
|
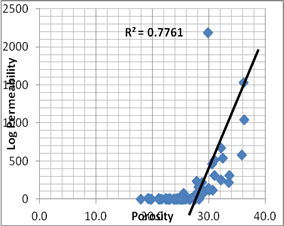
Figure 2. Permeability and porosity for reservoir A in Northern Delta depobelt at a pressure of 1000 psi |
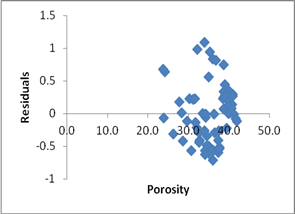
Figure 3. Residual plot for reservoir A in Northern Delta depobelt at a pressure of 1000 psi |
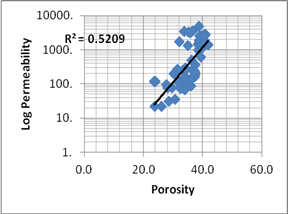
From Figure 2, among various transformations, R2 square value of 52% was achieved for porosity and permeability on semi-log scale after outliers were removed. Due to the fact that both parameters never assumed to be absolutely dependent on each other, R2 up to 52% was accepted to be sufficient.
Slope and intercept for semi-log linear model was obtained as βo = 0.1025 and β1 = -1.032 respectively. Mathematical model is shown in Table 12.
Figure 3 above shows the randomness of data. It is a good residual plot as it is a random plot centred on zero and this shows that none of the predictors are missing. The random pattern of the data indicates that a linear model gives a decent fit to the data.
Table 1 shows the summary of regression and statistical data obtained for reservoir A.
Table 1. Data analysis for reservoir A in Northern Delta depobelt at a pressure of 1000 psi
|
Coefficient of determination |
52% |
|
Significance F Value |
1.7E-11 |
|
Confidence Interval |
0.077529 ≤ β ≥ 0.127426 |
From Table 1, the coefficient of determination, R2 of 52% means that close to 52% of the variation in the dependent variable is explained by the independent variable.
2. Reservoir B – 1500 psi
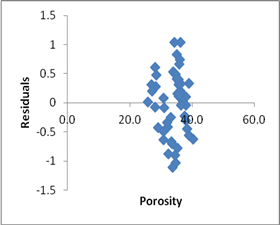
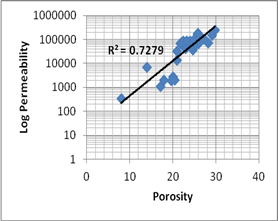
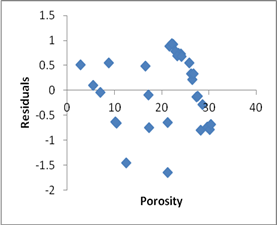
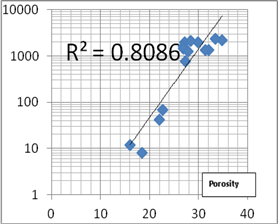
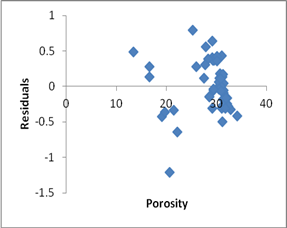
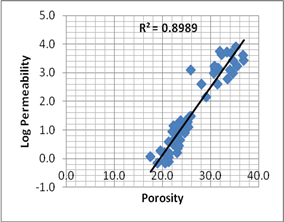
Figure 4 shows the graph of permeability against porosity for Reservoir B in Northern Delta depobelt at a pressure of 1500psi while Figure 5 shows the randomness of the plotted data.
|
Figure 4. Permeability and porosity for reservoir B in Northern Delta depobelt at a pressure of 1500psi |
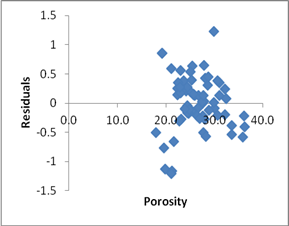
Figure 5. Residual plot for reservoir B in Northern Delta depobelt at a pressure of 1500 psi |
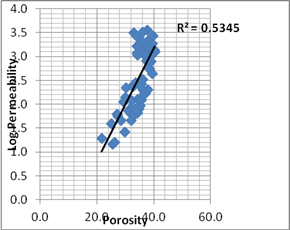
From Figure 4, among various transformations, R2 square value of 53% was achieved for porosity and permeability on semi-log scale after outliers were removed. Due to the fact that both parameters never assumed to be absolutely dependent on each other, R2 up to 53% was accepted to be sufficient.
Slope and intercept for semi-log linear model was obtained as βo = 0.1175 and β1 = -1.5344. Mathematical model is shown in Table 12.
Figure 5 above shows the randomness of data. It is a good residual plot as it is a random plot centred on zero and this signifies that none of the predictors are missing. The random pattern of the data indicates that a linear model provides a decent fit to the data.
Table 2 shows the summary of regression and statistical data obtained for reservoir B.
Table 2. Data analysis for reservoir B in Northern Delta depobelt at a pressure of 1500 psi
|
Coefficient of determination |
53% |
|
Significance F Value |
6.91E-12 |
|
Confidence Interval |
0.089697 ≤ β ≥ 0.145392 |
From Table 2, the coefficient of determination, R2 of 53% means that close to 53% of the variation in the dependent variable is explained by the independent variable.
3. Reservoir C– 1639 psi
Figure 6 shows the graph of permeability against porosity for Reservoir C in Northern Delta depobelt at a pressure of 1639 psi while Figure 7 shows the randomness of the plotted data.
|
Figure 6. Permeability and porosity for reservoir C in Northern Delta depobelt at a pressure of 1639 psi |
Figure 7. Residual plot for reservoir C in Northern Delta depobelt at a pressure of 1639 psi |
From Figure 6, among various transformations, R2 square value of 78% was achieved for porosity and permeability on semi-log scale after outliers were removed. Due to the fact that both parameters never assumed to be absolutely dependent on each other, R2 up to 78% was accepted to be sufficient.
Slope and intercept for semi-log linear model was obtained as βo = 0.2809 and β1 = -7.062. Mathematical model is shown in Table 12.
Figure 7 above shows the randomness of data. It is a good residual plot as it is a random plot centred on zero and this shows that none of the predictors are missing. The random pattern of the data indicates that a linear model gives a decent fit to the data.
Table 3 shows the summary of regression and statistical data obtained for reservoir C.
Table 3. Data analysis for reservoir C in Northern Delta depobelt at a pressure of 1639 psi
|
Coefficient of determination |
78% |
|
Significance F Value |
6.93E-18 |
|
Confidence Interval |
0.23811≤ β ≥ 0.323767 |
From Table 3, the coefficient of determination, R2 of 78% means that close to 78% of the variation in the dependent variable is explained by the independent variable.
4. Reservoir D – 2012 psi
Figure 8 shows the graph of permeability against porosity for Reservoir D in Northern Delta depobelt at a pressure of 2012 psi while Figure 9 shows the randomness of the plotted data.
|
Figure 8. Permeability and porosity for reservoir D in Northern Delta depobelt at a pressure of 2012 psi |
Figure 9. Residual plot for reservoir D in Northern Delta depobelt at a pressure of 2012 psi |
From Figure 8, among various transformations, R2 square value of 73% was achieved for porosity and permeability on semi-log scale after outliers were removed. Due to the fact that both parameters never assumed to be absolutely dependent on each other, R2 up to 73% was accepted to be sufficient.
Slope and intercept for semi-log linear model was obtained as βo = 0.1455 and β1 = 1.1936. Mathematical model is shown in Table 12.
Figure 9 above shows the randomness of data. It is a good residual plot as it is a random plot centred on zero and this shows that none of the predictors are missing. The random pattern of the data indicates that a linear model gives a decent fit to the data.
Table 4 shows the summary of regression and statistical data obtained for reservoir D.
Table 4. Data analysis for reservoir D in Northern Delta depobelt at a pressure of 2012 psi
|
Coefficient of determination |
73% |
|
Significance F Value |
1.03E-11 |
|
Confidence Interval |
0.115432 ≤ β ≥ 0.175579 |
From Table 4, the coefficient of determination, R2 of 73% means that close to 73% of the variation in the dependent variable is explained by the independent variable.
5. Reservoir E – 2031 psi
Figure 10 shows the graph of permeability against porosity for Reservoir E in Northern Delta depobelt at a pressure of 2031 psi while Figure 11 shows the randomness of the plotted data.
|
Figure 10. Log (K)-φ plot |
Figure 11. Residual Plot |
From Figure 10, among various transformations, R2 square value of 77% was achieved for porosity and permeability on semi-log scale after outliers were removed. Due to the fact that both parameters never assumed to be absolutely dependent on each other, R2 up to 77% was accepted to be sufficient. Slope and intercept for semi-log linear model was obtained as β0 = 0.1687 and β1 = 0.22. Mathematical model is shown in Table 12.
Figure 11 above shows the randomness of data. It is a good residual plot as it is a random plot centred on zero and this shows that none of the predictors are missing. The random pattern of the data indicates that a linear model gives a decent fit to the data.
Table 5 shows the summary of regression and statistical data obtained for reservoir E.
Table 5. Data analysis for reservoir E in Northern Delta depobelt at a pressure of 2031 psi
|
Coefficient of determination |
77% |
|
Significance F Value |
7.65E-11 |
|
Confidence Interval |
0.133935 ≤ β ≥ 0.203371 |
From Table 5, the coefficient of determination, R2 of 77% means that close to 77% of the variation in the dependent variable is explained by the independent variable.
6. Reservoir F – 2302 psi
Figure 12 shows the graph of permeability against porosity for Reservoir F in Northern Delta depobelt at a pressure of 2302 psi while Figure 13 shows the randomness of the plotted data.
|
Figure 12. Permeability and Porosity for reservoir E in Northern Delta depobelt at a pressure of 2302 psi |
Figure 13. Residual plot for reservoir E in Northern Delta depobelt at a pressure of 2302 psi |
From Figure 12, among various transformations, R2 square value of 81% was achieved for porosity and permeability on semi-log scale after outliers were removed. Due to the fact that both parameters never assumed to be absolutely dependent on each other, R2 up to 81% was accepted to be sufficient. Slope and intercept for semi-log linear model was obtained as βo = 0.1485 and β1 = -1.3015. Mathematical model is shown in Table 12.
Figure 13 above shows the randomness of data. It is a good residual plot as it is a random plot centred on zero and this shows that none of the predictors are missing. The random pattern of the data indicates that a linear model gives a decent fit to the data.
Table 6 shows the summary of regression and statistical data obtained for reservoir F.
Table 6. Data analysis for reservoir F in Northern Delta depobelt at a pressure of 2302 psi
|
Coefficient of determination |
71% |
|
Significance F Value |
5.12E-06 |
|
Confidence Interval |
0.105231 ≤ β ≥ 0.191832 |
From Table 6, the coefficient of determination, R2 of 71% means that close to 71% of the variation in the dependent variable is explained by the independent variable.
7. Reservoir G – 2414 psi
Figure 14 shows the graph of permeability against porosity for Reservoir G in Northern Delta depobelt at a pressure of 2414 psi while Figure 15 shows the randomness of the plotted data.
|
Figure 14. Permeability and Porosity for reservoir G in Northern Delta depobelt at a pressure of 2414 psi |
Figure 15. Residual plot for reservoir G in Northern Delta depobelt at a pressure of 2414 psi |
From Figure 14, among various transformations, R2 square value of 72% was achieved for porosity and permeability on semi-log scale after outliers were removed. Due to the fact that both parameters never assumed to be absolutely dependent on each other, R2 up to 72% was accepted to be sufficient. Slope and intercept for semi-log linear model was obtained as βo = 0.1738 and β1 = -1.9553. Mathematical model is shown in Table 12.
Figure 15 above shows the randomness of data. It is a good residual plot as it is a random plot centred on zero and this shows that none of the predictors are missing. The random pattern of the data indicates that a linear model gives a decent fit to the data.
Table 7 shows the summary of regression and statistical data obtained for reservoir G.
Table 7. Data analysis for reservoir H in Northern Delta depobelt at a pressure of 2414 psi
|
Coefficient of determination |
72% |
|
Significance F Value |
2.33E-06 |
|
Confidence Interval |
0.120024 ≤ β ≥ 0.227569 |
From Table 7, the coefficient of determination, R2 of 72% means that close to 72% of the variation in the dependent variable is explained by the independent variable.
8. Reservoir H – 2426 psi
Figure 16 shows the graph of permeability against porosity for Reservoir H in Northern Delta depobelt at a pressure of 2426 psi while Figure 17 shows the randomness of the plotted data.
|
Figure 16. Permeability and porosity for reservoir H in Northern Delta depobelt at a pressure of 2426 psi |
Figure 17. Residual plot for reservoir H in Northern Delta depobelt at a pressure of 2426 psi |
From Figure 16, among various transformations, R2 square value of 82% was achieved for porosity and permeability on semi-log scale after outliers were removed. Due to the fact that both parameters never assumed to be absolutely dependent on each other, R2 up to 82% was accepted to be sufficient. Slope and intercept for semi-log linear model was obtained as β0 = 0.2141 and β1 = -3.0236. Mathematical model is shown in Table 12.
Figure 17 above shows the randomness of data. It is a good residual plot as it is a random plot centred on zero and this shows that none of the predictors are missing. The random pattern of the data indicates that a linear model gives a decent fit to the data.
Table 8 shows the summary of regression and statistical data obtained for reservoir H.
Table 8. Data analysis for reservoir H in Northern Delta depobelt at a pressure of 2426 psi
|
Coefficient of determination |
82% |
|
Significance F Value |
4.37E-08 |
|
Confidence Interval |
0.164142 ≤ β ≥ 0.264037 |
From Table 8, the coefficient of determination, R2 of 82% means that close to 82% of the variation in the dependent variable is explained by the independent variable.
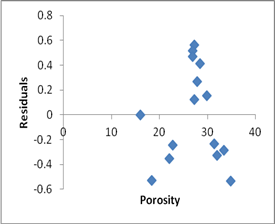
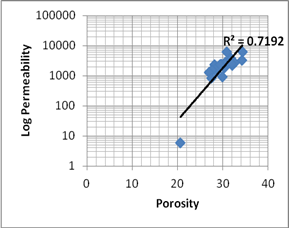
9. Reservoir I – 2532 psi
Figure 18 shows the graph of permeability against porosity for Reservoir I in Northern Delta depobelt at a pressure of 2532 psi while Figure 19 shows the randomness of the plotted data.
|
Figure 18. Permeability and porosity for reservoir I in Northern Delta depobelt at a pressure of 2532 psi |
Figure 19. Residual plot for reservoir I in Northern Delta depobelt at a pressure of 2532 psi |
From Figure 18, among various transformations, R2 square value of 90% was achieved for porosity and permeability on semi-log scale after outliers were removed. Due to the fact that both parameters never assumed to be absolutely dependent on each other, R2 up to 90% was accepted to be sufficient.
Slope and intercept for semi-log linear model was obtained as βo = 0.1943 and β1 = -3.1849. Mathematical model is shown in Table 12.
Figure 19 above shows the randomness of data. It is a good residual plot as it is a random plot centered on zero and this shows that none of the predictors are missing. The random pattern of the data indicates that a linear model gives a decent fit to the data.
Table 9 shows the summary of regression and statistical data obtained for reservoir I.
Table 9. Data analysis for reservoir I in Northern Delta depobelt at a pressure of 2532 psi
|
Coefficient of determination |
90% |
|
Significance F Value |
3.45E-28 |
|
Confidence Interval |
0.207876 ≤ β ≥ 0.260481 |
From Table 9, the coefficient of determination, R2 of 90% means that close to 90% of the variation in the dependent variable is explained by the independent variable.
Data analysis for greater Ughelli Depobelt
1. Reservoir K – 1340 psi
Figure 20 shows the graph of permeability against porosity for Reservoir K in greater Ughelli depobelt at a pressure of 1340 psi while Figure 21 shows the randomness of the plotted data.
|
Figure 20. Permeability and Porosity for reservoir K in Greater Ughelli depobelt at a pressure of 1340 psi |
Figure 21. Residual plot for reservoir K in Greater Ughelli depobelt at a pressure of 1340 psi |
From Figure 20, among various transformations, R2 square value of 90% was achieved for porosity and permeability on semi-log scale after outliers were removed. Due to the fact that both parameters never assumed to be absolutely dependent on each other, R2 up to 90% was accepted to be sufficient.
Slope and intercept for semi-log linear model was obtained as β0 = 0.3018 and β1 = -5.198. Mathematical model is shown in Table 12.
Figure 21 above shows the randomness of data. It is a good residual plot as it is a random plot centred on zero and this shows that none of the predictors are missing. The random pattern of the data indicates that a linear model gives a decent fit to the data.
Table 10 shows the summary of regression and statistical data obtained for reservoir K.
Table 10. Data analysis for reservoir K in Greater Ughelli depobelt at a pressure of 1340 psi
|
Coefficient of determination |
90% |
|
Significance F Value |
3.45E-28 |
|
Confidence Interval |
0.207876 ≤ β ≥ 0.260481 |
From Table 10, the coefficient of determination, R2 of 90% means that close to 90% of the variation in the dependent variable is explained by the independent variable.
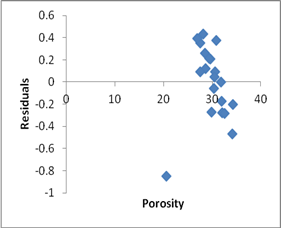
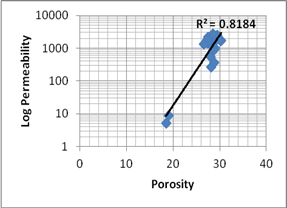
2. Reservoir L – 1550 psi
Figure 22 shows the graph of permeability against porosity for Reservoir L in greater Ughelli depobelt at a pressure of 1550 psi while Figure 23 shows the randomness of the plotted data.
|
Figure 22. Permeability and Porosity for reservoir L in Greater Ughelli depobelt at a pressure of 1550psi |
Figure 23. Residual plot for reservoir L in Greater Ughelli depobelt at a pressure of 1550psi |
From Figure 22, among various transformations, R2 square value of 78% was achieved for porosity and permeability on semi-log scale after outliers were removed. Due to the fact that both parameters never assumed to be absolutely dependent on each other, R2 up to 78% was accepted to be sufficient.
Slope and intercept for semi-log linear model was obtained as βo = 0.2342 and β1 = -4.6748. Mathematical model is shown in Table 12.
Figure 23 above shows the randomness of data. It is a good residual plot as it is a random plot centered on zero and this shows that none of the predictors are missing. The random pattern of the data indicates that a linear model gives a decent fit to the data.
Table 11 shows the summary of regression and statistical data obtained for reservoir L.
Table 11. Data analysis for reservoir L in Greater Ughelli depobelt at a pressure of 1550 psi
|
Coefficient of determination |
78% |
|
Significance F Value |
1.79E-22 |
|
Confidence Interval |
0.176364 ≤ β ≥ 0.231009 |
From Table 11, the coefficient of determination, R2 of 78% means that close to 78% of the variation in the dependent variable is explained by the independent variable.
Table 12 is a summary of the mathematical models derived in this study together with their corresponding normalized forms.
Table 12. Summary of the mathematical models derived
|
Reservoir name |
Reservoir pressure |
Mathematical model |
R2 (%) |
|
NORTHERN DELTA DEPOBELT |
|||
|
Reservoir A |
1000 psi |
Log (k) = 0.1025φ - 1.032 K = 0.0929 (100.1025φ) |
52 |
|
Reservoir B |
1500 psi |
Log (k) = 0.1175φ - 1.5344 K = 0.0292 (100.1175φ) |
53 |
|
Reservoir C |
1639 psi |
Log (k) = 0.2809φ - 7.062 K = 8.6696*10-8 (100.2809φ) |
78 |
|
Reservoir D |
2012 psi |
Log (k) = 0.1455φ + 1.1936 K = 15.6171 (100.1455φ) |
73 |
|
Reservoir E |
2031 psi |
Log (k) = 0.1687φ + 0.22 K = 1.6596 (100.1687φ) |
77 |
|
Reservoir F |
2302 psi |
Log (k) = 0.1485φ - 1.3015 K = 0.0499 (100.1485φ) |
71 |
|
Reservoir G |
2414 psi |
Log (k) = 0.1738φ - 1.9553 K = 0.011084 (100.1738φ) |
72 |
|
Reservoir H |
2426 psi |
Log (k) = 0.2141φ - 3.0236 K = 9.4711*10-4 (100.2141φ) |
82 |
|
Reservoir I |
2532 psi |
Log (k) = 0.1943φ - 3.1849 K = 6.5328*10-4 (100.1943φ) |
90 |
|
GREATER UGHELLI DEPOBELT |
|||
|
Reservoir K |
1340 psi |
Log (k) = 0.3018φ - 5.198 K = 6.3388*10-6 (100.3018φ) |
90 |
|
Reservoir L |
1550 psi |
Log (k) = 0.2342φ - 4.6748 K = 2.1145*10-5 (100.2342φ) |
78 |
Conclusions
Steps for regression analysis can be applied on any of the reservoir’s data and linear mathematical equations developed using this model to obtain a very good linear scale on log (K) – φ scale. This helped for a fundamental linear relationship between permeability and porosity for Niger Delta depobelts from core analysis.
The permeability values derived from core analysis and those derived from the developed model were very close with minimum error of less than 1%.
References
1. Archie G.E., The electrical resistivity log as an aid in determining some reservoir characteristics, AIME, 1942, 142, p. 54-62.
2. Krumbien W.C., Monk G.D., Permeability as a function of the size parameters of unconsolidated sand, AIME technical publication, 1942, (ZDB-ID 2589114) 1492, p. 153-163.
3. Darling T., Well logging and formation evaluation, Elsevier, 2005.
4. Ubani C.E, Adeboye, Y.B, Oriji A.B., Advances in coring and core analysis for reservoir formation evaluation, journal of petroleum and coal, 2012, 54 (1), p. 42-51.
5. Naeem H.D., Abid A.B., Linear mathematical model developed using statistical methods to predict permeability form porosity, Proceedings of the SPE Pakistan section Annual Technical Conference, 24-27 November, Islamabad, Pakistan, 2014, SPE-174716-MS, p. 1-10.
6. Ubanatu S.I., A permeability-porosity-saturation for Niger Delta, Asia Pacific Journal of Multidisciplinary Research, 2014, 2 (2), p. 20-23.
7. Kozeny J., Ueber kapillare leitung des wassers im Bodem, Sitzungsber Akad, 1927, Wiss, Wien, 136 (2a), p. 271-306.
8. Morris R.L., Biggs W.P., Using log derived values of water saturation and porosity, Trans. SPWLA Ann. Logging symp., 1967, p. 10-26.