Engineering, Environment
Evaluation of compaction properties of some semi-arid zone soils
Emmanuel Wadzani Gadzama*1, Paul Yohanna2, Ishaya Dauda Wadai3 and Charles Malachy Okechukwu Nwaiwu4
1Department of Civil Engineering Modibbo Adama University of Technology, Yola, Nigeria
2Department of Civil Engineering, Ahmadu Bello University Zaria. Kaduna State, Nigeria
3Ministry of Water Resources Maiduguri, Borno State. Nigeria
4Department of Civil Engineering, Nnmadi Azikiwe University Awka, Anambra State, Nigeria
E-mails: 1gadzymo@yahoo.com, 2paulyohanna45@yahoo.co.uk, 3idwadai@gmail.com
* Corresponding author, phone: +2348054358847
Received: January 11, 2018 / Accepted: June 26, 2018/ Published: June 30, 2018
Abstract
Compaction property of some semi-arid zone soils was studied. The soils falls within the range of A-2-4 and A-3 using the American Association of State Highway and Transportation Officials (AASHTO), CL, SM and SC using the ASTM-USCS. Tests carried out include Atterberg limits, sieve analysis, pH test, electrical conductivity, free swell, specific gravity and compaction test using the energy level of British Standard light, BSL, West African Standard, WAS and British Standard heavy, BSH. Mini-tab R15 software and XLSTART 2017 statistical tool incorporated as an add-in in Microsoft Excel were used for the regression modeling, correlation and principal component analysis (PCA) respectively. Results show that the grading modulus and maximum dry density (MDD) decreased with increase in fines content in the range of 10-90%, while the optimum moisture content (OMC) increased with increase in the fines content. The MDD increase with increase in grading modulus of the soils while the OMC decreased with increase in the grading modulus of the soils. Generally, statistical evaluation of the test results using regression, correlation and principal component analysis showed a strong relationship between the dependent variables (MDD and OMC) and independent variables (Clay content Ci, Silt content Si, Sand content Sa, Specific gravity Gs, Grading Modulus Gm and Compactive Effort CE). The regression models showed some level of correlation between the measured compaction properties (MDD and OMC) gotten by laboratory tests and values predicted from the models with correlation coefficients R = 0.771 and 0.903 for MDD and OMC respectively. Biplots and cluster plots from PCA showed that CE, Gm, Sa and Gs greatly influence the compaction properties of semi-arid zone soils and is recommended to carefully monitor these variables during field compaction or in any geotechnical application.
Keywords
Semi-arid zone; Regression, correlation; Principal component analysis (PCA); Fines content; Grading Modulus; Gm; Compactive Effort CE
Introduction
An arid ecosystem differs in many respects from that one of tropical or temperate zones. Unlike temperate zones, a typical arid zone is characterized by a low rainfall, high temperature, low relative humidity, high solar radiation, and high rate of evaporation [3]. According to [4], the frequency of rainfall does not describe accurately the type of arid zone nor does the amount of precipitation govern the type of vegetation. Nevertheless, precipitation serves as a criterion for the subdividing of arid zones. Generally, 57-300 mm mean annual rainfall is typical of an arid zone, while 300-550 mm is that of a semi-arid zone. The dry climate of the world occurs in five great geographical areas lying between 15° and 35° latitudes which is not far from the study area. The largest of the five, known as the African-Eurasian dry zone, being the Sahara Desert from the Atlantic coast [4].
The term soil has different meanings, depending on the area of specialization in which it is being considered. To the Geologist, soil is the material in the relatively thin surface zone within which roots occurs. To the Agriculturalist, soil is the substance existing on earth's surface which grows and develops plants life. But to the Engineer, soil is any un-cemented or weakly cemented accumulation /deposits of mineral particles containing air and water which is also considered as complex materials produced by the weathering of the solid rock. It includes widely different materials ranging from boulders, sand, gravels, silts and clays having particle sizes between the ranges of (200 mm - 0.002 mm). It is important to note that soils are natural materials and as such they are complex, they are materials that are not ‘made to order ‘like other engineering materials (cement, steel reinforcement etc.) and thus do not always exhibit the properties desired for construction purposes. Therefore, modification of soils at the site to improve their engineering properties is essential [5]. Due to this, soil property differs not only from one location to another but also among the horizons of a given profile. These characteristics should, however, be kept in mind when handling soils.
Arid/semi-arid soil have general engineering properties of strength, stiffness and permeability similar to other soils but in an arid environment, soils acquire some peculiar characteristics features. An excess evaporation over infiltration leads to negative pore water pressure as water is removed from the soil, this consequently leads to poor engineering performance of the soils. The most widely used treatment to overcome the susceptibility to low engineering performance of these soils is either to densify by compaction, modify or stabilize it with additives. A lot of stabilizers, admixtures like cement, lime, pozzolanic, wastes and other chemical additives have been developed to stabilize and improve the properties of expansive clays [6; 7]. And these have achieved limited success because the improvement in the properties of a soil largely depends on the chemical reaction and bonding between a soil stabilizer/admixture and the soil mineral and chemical composition [8].
[9] reported that addition of lime contributes towards the improvement of soil workability and not increase in strength. Because semi-arid zone soils have characteristics behaviors that can be easily altered by some of the environmental factors such as compacting due to rainfall, alternative wetting and drying etc. Therefore, this study is aimed at examining the compaction characteristics of these soils, so that it can serve as a reference for road construction in the near future and to bring awareness among practicing engineers and public in semi-arid areas to the risks associated with construction on such soils.
Semi-arid zone soils are those whose properties have been conditioned by an arid climate. An arid climate can be considered as one in which precipitation is less than evaporation on an annual basis. Such soils differ from those in temperate or humid climate mainly in the role played by water, as a result of climatic changes due to man's activities. These soils are often characterized by amongst other things, lack of vegetation cover, they are easily transported by wind, and are frequently unsaturated and highly cemented (usually carbonated) where the water tables are deep. Soils that are found in these region are also known as unsaturated soils, which include both expansive and collapsible soils which are known also as problem soils when considered for engineering applications. Structures built on such soils (buildings and roads) suffer a lot of distress through cracks and or settlement whose repeated maintenance always proved unsuccessful or difficult [10].
According to [7], expansive soils are the main cause of damages to many civil engineering structures such as spread footings, roads, highways, airport runways, and earth dams constructed with dispersive soils. Although previous studies have improved the fundamental understanding on the behavior of CBR in unsaturated soils, there is still a need for further experimental data to clarify the dependencies of CBR on other practical aspects covered in unsaturated soils [11]. Difficulties with such type of soil can arise if the environment is modified during or after construction, which ultimately results in a localized change in soil water regime, since most semi-arid soils are subjected to natural cycles of wetting and drying including collapsible and expansive soils [12], he concluded that California Bearing Ratio of the compacted collapsible soils was correlated to the liquid limit, and also his study supports the use of compaction to treat the collapsible soils prior to construction of the foundations. Studies by [13], reported that in Nigeria, there are more than a few constructions of highways, and since highways also comprise foundation, which means geotechnical aspects are likewise important in the highway construction. However, highway engineers always have a preference for using CBR test to determine the proper strength for designing road pavement [11].
[13], established a relationship between unconfined compressive strength (UCS) and the California Bearing Ratio (CBR) and concluded that the relationship established can close the gap between geotechnical and highway engineer in unconfined compressive strength aspect for road pavement design in Nigeria. A similar study by [14], made a similar conclusion on the relationship between (UCS) and the (CBR). Also a study by [8], on samples around the study area have arrived at the following conclusions: Soaked CBR value of 17%, and the Un-soaked CBR value of 36% these values fall below the minimum requirements of 80 % and 30 % as specified by [15], for use as base and sub-base course. Previous studies by [16], on some coarse-grained arid/semi-arid soils reported that: the specific gravity ranged between 2.57 -2.67, according to them, the results are consistent with materials which are predominantly carbonates. They also reported that Chemical analysis of samples in accordance with the rapid titration method of [17], gave carbonate content ranging from 0.61% - 27.5%.
A study by [18], have established a strong relationship between undrained triaxial compressive strength (UTSC) and CBR of lateritic soils with a correlation coefficient of 0.9458, which is a strong indication of possible substitution of the (UTSC) with CBR test and vice versa, when evaluating lateritic soils for pavement design and construction work. A similar study by [19] reported an increase in the soaked CBR values of the natural lateritic soils from 8, 9 and 5.9 % to 143.94, 126.75 and 212 % when Lateritic soils were stabilized with Lateralite. So also the uncured unconfined compressive strength values of the natural soils increased from 50.20 kN/m2, 47.19 kN/m2 and 79.84 kN/m2 to 311.27 kN/m2, 281.62 kN/m2 and 792.08 kN/m2 cured UCS values which also followed a similar trend as that of CBR.
Studies by [20] reported that the electrical conductivity of a dry soil appears to approach zero in compacted soil that has remained in an unsaturated state, they further stated that previous researchers have established relationships between electrical conductivity of soil and volumetric water content, but did not investigate the effect of compaction effort on them. In a related study, [21], reported that soil electrical conductivity can be used as good tool in obtaining a useful information of a soil, so also is the Cation exchange capacity (CEC), they concluded that soil texture can significantly be expressed by its electrical conductivity, they also concluded that there exists a negative correlation between electrical conductivity and bulk density of dry soils. In similar vein, [22], reported that clay soils are highly conductive while sandy soils are poor conductors.
[23] have pointed out the importance of using electrical conductivity in the characterization of soils in geotechnical engineering, they also gave a typical range of pH values for geotechnical investigations to range between 4.20 to 9.0, which according to [22], ranged between strongly acidic and strongly alkaline soils. They further gave a clue as to how an acidic soil are formed, through mineral percolation, decay of acidic plant, industrial waste, acid rain and certain microbial activities. On the other hand, soils that contains high sodium, potassium, magnesium and calcium are responsible for alkaline soils. [24], reported that acidic soils are the main causes of serious corrosion to construction materials like steel, cast iron and zinc coating, they also reported that more acidic soils shows high electrical conductivity which is also a reciprocal of less electrical resistivity.
The purpose of this research is to investigate the compaction characteristics of semi-arid zone soils. The objectives are to evaluate their suitability for use as subgrade/subbase material and to evaluate using statistical techniques the compaction behavior of semi-arid zone soils. The study is however restricted to 25 samples brought from within and around Maiduguri particularly from Damboa road, Bama road and within the University of Maiduguri premises.
Materials and methods
Soil
The soil samples used in this studies were collected in different locations within Maiduguri, Borno state, Nigeria. Geographically Maiduguri is located at latitude 11°N, longitude 13.5°E. Geologically Maiduguri is located on the Chad formation [25].
Index properties: Laboratory tests were carried out to determine the index properties of the soils according to the procedure outlined in [15].
Atterberg limit: The Atterberg Limits (Liquid Limit, Plastic Limit, and the Plasticity index), were carried out in accordance with [15].
Free swell test: about 10 g of air dried soil passing through sieve 425μm; the sample was then slowly poured into 100 cm3measuring cylinder to which water was added to the 100 mark. The content was then shaken to obtain a homogenous mixture and allowed to settle for at least 24 hours before the final level was recorded. This test was conducted according to methods used by [26].
Compaction: Compaction tests were carried out based on the procedure outlined [17] to determine the compaction characteristics of the soils using three energy levels of British Standard light (BSL) and British Standard Heavy (BSH) compaction energy while the West African Standard (WAS) compaction is the effort derived from 4.5 kg rammer falling through 45 cm onto five layers, each receiving ten blows, as recommended by [15].
Set-up of experimental data for statistical analysis
Laboratory experiments were carried out on the soil samples to measure the various soil parameters used for the statistical analysis. Parameters measured include; Optimum moisture content OMC, maximum dry density MDD, Clay content Cl, Silt content Si, Sand content Sa, Specific gravity Gs, Grading Modulus Gm and Compactive Effort CE. The maximum dry density MDD and optimum moisture content OMC were the assumed dependent variables used while Clay content Cl, Silt content Si, Sand content Sa, Specific gravity Gs, Grading modulus Gm and Compactive Effort CE were the independent variables used. Laboratory based results obtained were used to develop regression models for predicting MDD and OMC from laboratory results. Mini-tab R15 software was used to generate the regression equations obtained for MDD and OMC respectively. These equations were used for the prediction and analysis. Correlation and principal component analyses were carried out the same dependent and independent variables using the Tools of Analysis XLSTART 2017 software incorporated into Microsoft EXCEL as an add-in.
The work algorithm is as shown in Figure 1, below.
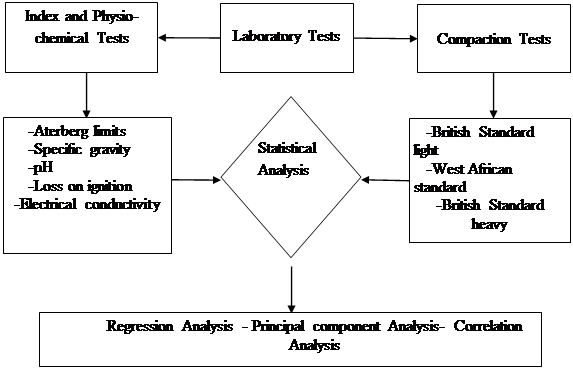
Figure 1. Working algorithm
Results and Discussion
Basic geotechnical properties of the soils
From the index properties of the 25 soil samples investigated, the following are the breakdown of the classification: According to [1], 1 sample was classified as A-2-4 soil, 1 sample was classified as A-2-6 soil, 1 sample as A-7-5, while the remaining 22 samples were A-3 soils. Using the classification methods by [2], 1 sample was classified as CL, 5 samples were classified as SM, while the remaining 19 samples were classified as SC. Details on physio-chemical properties and classification of the soils is given in Table 1.
Table 1. Physio-chemical properties and classification of the soils
|
Sample No. |
Free swell |
pH in water |
Loss on ignition |
Electrical conductivity |
Specific gravity |
AASHTO
|
USCS |
|
1 |
10 |
4.93 |
10.00 |
0.02 |
2.59 |
A-2-4 |
SC |
|
2 |
65 |
5.94 |
7.40 |
0.17 |
2.45 |
A-7-5 |
CL |
|
3 |
10 |
5.29 |
12.50 |
0.04 |
2.61 |
A-3 |
SC |
|
4 |
10 |
4.89 |
12.20 |
0.07 |
2.56 |
A-3 |
SC |
|
5 |
20 |
5.31 |
11.00 |
0.03 |
2.64 |
A-3 |
SC |
|
6 |
20 |
6.43 |
9.00 |
0.05 |
2.61 |
A-3 |
SC |
|
7 |
30 |
7.39 |
8.20 |
0.08 |
2.52 |
A-3 |
SC |
|
8 |
20 |
5.91 |
11.50 |
0.03 |
2.61 |
A-3 |
SC |
|
9 |
15 |
6.41 |
12.00 |
0.05 |
2.58 |
A-3 |
SC |
|
10 |
30 |
7.16 |
12.40 |
0.10 |
2.56 |
A-2-6 |
SC |
|
11 |
15 |
6.26 |
3.30 |
0.05 |
2.61 |
A-3 |
SC |
|
12 |
10 |
4.94 |
4.70 |
0.06 |
2.64 |
A-3 |
SC |
|
13 |
20 |
6.87 |
4.70 |
0.07 |
2.60 |
A-3 |
SC |
|
14 |
10 |
7.37 |
5.50 |
0.06 |
2.56 |
A-3 |
SC |
|
15 |
10 |
7.27 |
2.00 |
0.06 |
2.66 |
A-3 |
SC |
|
16 |
10 |
4.73 |
13.00 |
0.03 |
2.59 |
A-3 |
SC |
|
17 |
20 |
5.19 |
7.20 |
0.03 |
2.63 |
A-3 |
SC |
|
18 |
10 |
5.83 |
11.00 |
0.03 |
2.60 |
A-3 |
SC |
|
19 |
10 |
6.52 |
2.50 |
0.31 |
2.61 |
A-3 |
SM |
|
20 |
30 |
7.05 |
12.00 |
0.17 |
2.55 |
A-3 |
SC |
|
21 |
30 |
5.02 |
6.00 |
0.02 |
2.56 |
A-3 |
SC |
|
22 |
10 |
5.89 |
8.00 |
0.06 |
2.61 |
A-3 |
SM |
|
23 |
0 |
6.35 |
10.00 |
0.07 |
2.61 |
A-3 |
SM |
|
24 |
10 |
6.50 |
10.51 |
0.03 |
2.66 |
A-3 |
SM |
|
25 |
10 |
6.26 |
6.40 |
0.03 |
2.57 |
A-3 |
SM |
Free swell
The free swell values of these soils generally ranged between 0 - 30% as shown in Table 1. Relating these to the hydrometer analysis results in table 2, it would be observed that out of the twenty-five samples, only sample 2, has higher clay content, which is also confirmed by the free swell value of 65% which was the highest of all the samples investigated, while the remaining twenty-four are sandy soils with the least sand content being 45 % as shown in Table 2.
pH
The pH values of the soil samples as presented in Table 1 ranged between 4.93 - 7.39 which according to [22], indicated that the soils are strongly Acidic to slightly Basic, these values also fall within the range given by [23], for geotechnical investigations.
Electrical conductivity
From the results shown in Table 1, the values of electrical conductivity ranged between 0.02 - 0.17u/mm. which agrees with [20], that dry soils which remain in unsaturated state for long time have their electrical conductivity approaching zero which are peculiar characteristics to arid/semi-arid regions, which are characterized by evaporation exceeding precipitation on annual basis.
Details of grading and plasticity characteristics of the soils is given in Table 2.
Table 2. Grading and plasticity characteristics of the soil
|
Sample No |
Clay |
Silt |
Sand |
Grading modulus |
LL |
PL |
PI |
|
1 |
27.60 |
10.00 |
62.40 |
0.7 |
19 |
14 |
5 |
|
2 |
62.60 |
20.00 |
17.40 |
0.14 |
48 |
32 |
16 |
|
3 |
22.60 |
7.50 |
69.90 |
0.86 |
- |
NP |
- |
|
4 |
17.60 |
12.50 |
69.90 |
0.91 |
- |
NP |
- |
|
5 |
20.10 |
10.00 |
69.90 |
0.9 |
- |
NP |
- |
|
6 |
17.60 |
10.00 |
72.40 |
0.86 |
- |
NP |
- |
|
7 |
27.60 |
10.00 |
62.40 |
0.87 |
- |
NP |
- |
|
8 |
20.10 |
10.00 |
69.90 |
0.89 |
- |
NP |
- |
|
9 |
17.60 |
12.50 |
69.90 |
0.9 |
- |
NP |
- |
|
10 |
22.60 |
10.00 |
67.40 |
0.85 |
15 |
NP |
15 |
|
11 |
20.10 |
10.00 |
69.90 |
0.92 |
- |
NP |
- |
|
12 |
20.10 |
12.50 |
67.40 |
0.77 |
- |
NP |
- |
|
13 |
17.60 |
12.50 |
69.90 |
0.86 |
- |
NP |
- |
|
14 |
15.10 |
12.50 |
72.40 |
0.89 |
- |
NP |
- |
|
15 |
20.10 |
10.00 |
69.90 |
0.91 |
- |
NP |
- |
|
16 |
25.10 |
2.50 |
72.40 |
0.87 |
- |
NP |
- |
|
17 |
22.60 |
5.00 |
72.40 |
0.88 |
- |
NP |
- |
|
18 |
22.60 |
5.00 |
72.40 |
0.88 |
- |
NP |
- |
|
19 |
20.10 |
35.00 |
44.90 |
0.9 |
- |
NP |
- |
|
20 |
32.60 |
15.00 |
52.40 |
0.54 |
22 |
16 |
6 |
|
21 |
22.60 |
7.50 |
69.90 |
0.69 |
21 |
16 |
5 |
|
22 |
15.10 |
22.50 |
62.40 |
0.66 |
- |
NP |
- |
|
23 |
17.60 |
30.00 |
52.40 |
0.74 |
- |
NP |
- |
|
24 |
15.10 |
35.00 |
44.90 |
0.78 |
- |
NP |
- |
|
25 |
17.60 |
35.00 |
47.40 |
0.68 |
- |
NP |
- |
Compaction characteristics of the soils
The compaction efforts employed are the BSL, BSH and the WAS compactive efforts, the MDD ranged between 1.51 to 2.04 Mg/m3 for BSL, 1.63 to 2.14 Mg/m3 for BSH and between 1.57 to 2.07 Mg/m3 for WAS, while the OMC ranged between 7.60 to 22.80 % for BSL 7.30 to 20.40 % for BSH and between 8.10 to 21.20 % for WAS respectively with Black Cotton soil having the lowest MDD value and highest OMC value in both cases the results are shown in Table 3.
Table 3. Compaction characteristics of the soils
|
Sample No |
BSL |
WAS |
BSH |
|||
|
OMC |
MDD |
OMC |
MDD |
OMC |
MDD |
|
|
1 |
10.20 |
1.94 |
9.60 |
1.97 |
9.40 |
2.00 |
|
2 |
22.80 |
1.51 |
21.20 |
1.57 |
20.40 |
1.63 |
|
3 |
9.40 |
1.92 |
9.00 |
1.99 |
8.60 |
2.00 |
|
4 |
8.60 |
1.89 |
8.60 |
1.89 |
8.20 |
1.91 |
|
5 |
10.60 |
1.90 |
10.60 |
1.93 |
9.00 |
2.02 |
|
6 |
8.40 |
1.77 |
8.20 |
1.93 |
7.40 |
2.00 |
|
7 |
9.00 |
1.96 |
8.40 |
1.99 |
8.10 |
2.06 |
|
8 |
11.50 |
1.94 |
9.40 |
1.97 |
8.30 |
2.04 |
|
9 |
9.20 |
1.86 |
8.10 |
1.93 |
7.90 |
1.96 |
|
10 |
8.90 |
1.94 |
8.80 |
2.07 |
8.10 |
2.14 |
|
11 |
9.10 |
1.89 |
9.00 |
1.92 |
7.90 |
2.01 |
|
12 |
8.60 |
1.89 |
8.50 |
1.96 |
7.60 |
2.05 |
|
13 |
9.00 |
1.94 |
8.20 |
1.96 |
8.00 |
2.01 |
|
14 |
7.90 |
1.90 |
8.40 |
1.94 |
8.00 |
2.05 |
|
15 |
10.80 |
1.87 |
8.70 |
1.94 |
7.80 |
1.99 |
|
16 |
8.90 |
1.89 |
8.50 |
1.95 |
8.30 |
2.02 |
|
17 |
10.20 |
1.90 |
8.20 |
1.95 |
8.10 |
2.02 |
|
18 |
10.20 |
1.89 |
9.30 |
1.96 |
7.30 |
2.07 |
|
19 |
10.20 |
1.94 |
8.70 |
1.99 |
7.10 |
2.04 |
|
20 |
14.40 |
1.82 |
11.70 |
1.87 |
10.80 |
1.91 |
|
21 |
12.60 |
1.88 |
10.30 |
1.91 |
8.90 |
2.00 |
|
22 |
10.20 |
1.72 |
9.70 |
1.80 |
9.30 |
1.88 |
|
23 |
10.50 |
1.72 |
9.80 |
1.80 |
8.90 |
1.86 |
|
24 |
11.00 |
1.73 |
9.60 |
1.79 |
8.00 |
1.86 |
|
25 |
11.30 |
1.79 |
10.00 |
1.84 |
8.30 |
1.99 |
Effect of fines content on the grading modulus
The variation of grading modulus with fines content is shown in Figure 2.
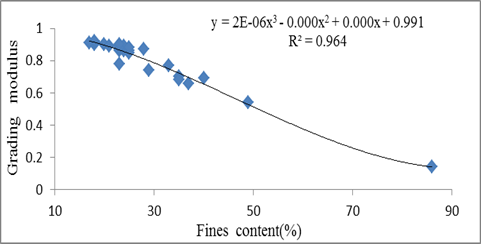
Figure 2. Variation of grading modulus with fines content
A trend of decrease in grading modulus with fines content was noticed using a polynomial relationship. The coefficient of correlation obtained R = 0.964 shows a strong correlation between the grading modulus and the fines content of the soil. This suggest that grading modulus is inversely related to the fines content of the soils. Similar behavior was reported by [27], who worked on effect of fines content on the engineering properties of reconstituted lateritic soils in waste containment application.
Effect of fines content on compaction characteristic
The effect of fines content on the compaction characteristics is shown in Figure 3 and Figure 4.
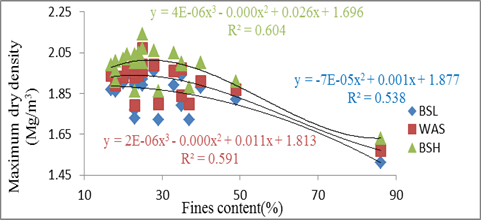
Figure 3. Variation of maximum dry density with fines content
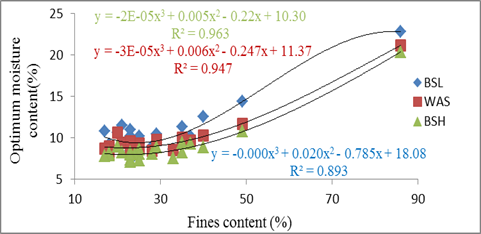
Figure 4. Variation of optimum moisture content with fines content
Generally, it was observed that the maximum dry density decreased with increase in the fines content of the soils. A plot of fines content and maximum dry density shows correlation coefficient values of R= 0.538, 0.591 and 0.604 for BSL, WAS and BSH respectively. This shows a weak relationship between the maximum dry density and the fines content of the soils. As the compactive effort increased, the correlation coefficient decrease which denote a reduction in the relationship with increase in compaction energy. The decrease could be due to breaking of the granular particles of the soils and the packaging of the soils with increase in the compaction energy caused by the energy of the compaction rammer. In the case of optimum moisture content, an increase was observed with increase in fines content. The possible explanation for this behavior could be due to the great affinity of clay size particles for water requiring more water to saturate the surface of the soil leading to increase in the optimum moisture content of the soils. On the other hand, the increase in OMC with increased in fines content could be due to increased total specific surface that required more water to achieve the mobilization of soil particles during the compaction process. This agrees with the findings reported by other researches [27-29].
A comparison of the relationship between fines content and optimum moisture content using a polynomial relationship shows correlation coefficient values of R= 0.893, 0.947 and 0.963 for BSL, WAS and BSH respectively. This shows a strong relationship between the optimum moisture content and the fines content of the soils.
Effect of grading modulus on compaction characteristics
The variation of compaction properties (MDD and OMC) with grading modulus is shown in Figure 5 and 6.
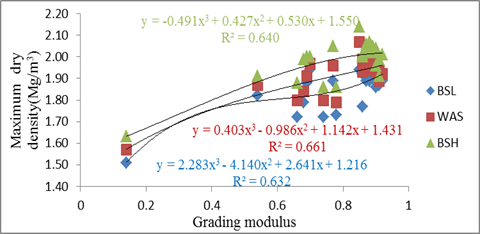
Figure 5. Variation of maximum dry density with grading modulus
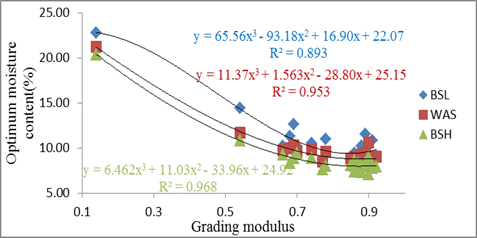
Figure 6. Variation of optimum moisture content with grading modulus
Maximum dry density increased with increase in the grading modulus of the soils using a third order polynomial relationship (see Figure 5). The correlation coefficient values of R= 0.632, 0.661 and 0.640 for BSL, WAS and BSH respectively, was observed. This shows a weak relationship between the maximum dry density and the grading modulus of the soils. As the compactive effort increased, the correlation coefficient increase which implies an increased in the relationship with increase in compaction energy.
In the case of optimum moisture content, a decrease in the optimum moisture content was observed with increase in the grading modulus. A comparison of the relationship between grading modulus and optimum moisture content using a third order polynomial relationship shows correlation coefficient values of R= 0.893, 0.953 and 0.968 for BSL, WAS and BSH respectively. This shows a strong relationship between the optimum moisture content and the grading modulus of the soils. As the compactive effort increased, the correlation coefficient increase which implies an increased in the relationship with increase in compaction energy.
Regression analysis for compaction characteristics
Comparison between measured and predicted compaction properties
The regression model derived for maximum dry density (MDD) using Minitab R15 is shown in Eq. (1).
![]()
![]()
Where: MDD - maximum dry density, Cl - clay content; Si - silt content; Sa - sand content; Gs - specific gravity; CE - compactive effort; Gm - grading Modulus.
The regression equation shows strong relationship between MDD and the independent variables (CL, Si, Sa, Gs, Gm and CE) with coefficient of determination R2 =74.4%. Results show that all the independent variables have positive coefficients except Gs with negative coefficient. This implies that increase in the variables with positive coefficients leads to corresponding increase in MDD of the soil. Therefore, care should be taken to ensure that these variables are properly control during field compaction or in any geotechnical application to achieve desirable results. A plot of Predicted MDDs derived from the regression model shows a strong relationship with the measured MDDs obtained in the laboratory with correlation coefficient R=0.771 (see Figure 7).
In the case of optimum moisture content, (see Eq. (2)) strong correlation was observed between the OMC and the independent variables (CL, Si, Sa, Gs, Gm and CE) which is shown by the coefficient of determination R2 =89.3%.
![]()
![]()
Where: OMC - optimum moisture content, Cl - clay content; Si - silt content; Sa – sand content; Gs - specific gravity; CE - compactive Effort; Gm - grading modulus.
The independent variables have negative coefficients except Gs and Cl with positive coefficient. This suggest that increase in the variables with positive coefficients leads to corresponding increase in OMC of the soil.
Therefore, care should be taken to ensure that these variables are properly control during field compaction or in any geotechnical application to achieve desirable results. A plot of Predicted OMCs derived from the regression model shows a strong relationship with the measured OMCs measured in the laboratory with correlation coefficient R=0.903 (see Figure 8).
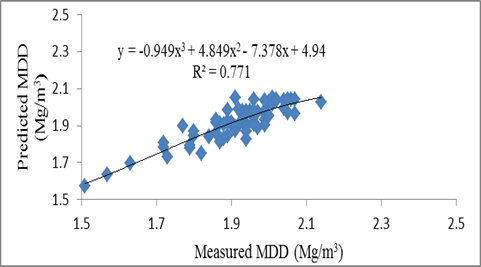
Figure 7. Plot of measured MDD versus predicted MDD values from the model
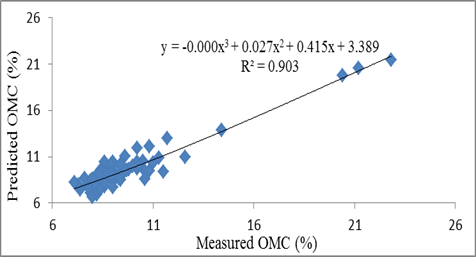
Figure 8. Plot of measured MDD versus predicted MDD values from the model
Principal component analysis (PCA) for compaction characteristics
The principal component analysis (PCA) is a reduction tool that analyzes data table where the observations are described using several inter-correlated quantitative dependent variables. It has been reported by [30], that Principal component analysis relies on the eigen-decomposition of positive semi-definite matrices and upon the singular value decomposition (SVD) of rectangular matrices. The principle of PCA operation is centered on analyzing a data table representing observations by describing the several sets of dependent variables involved in which the dependent variable relies on and are inter-correlated. The aim is to extract the important information from the data table and to represent this information as a set of new orthogonal variables called principal components.
The principal component analysis for maximum dry density was done by assuming the dependent variable (MDD) and the independent variables (CL, Si, Sa, Gs, Gm and CE). Their inter-correlation is presented in Table 4 as principal components (i.e F1, F2, F3)
Table 4. Correlation between variables and factors for maximum dry density
|
Variables/Factors |
F1 |
F2 |
F3 |
|
Clay content, Ci |
-0.814 |
-0.493 |
-0.070 |
|
Silt content, Si |
-0.433 |
0.766 |
0.426 |
|
Sand content, Sa |
0.907 |
-0.246 |
-0.275 |
|
Specific gravity, Gs |
0.684 |
0.529 |
0.054 |
|
Compactive Effort CE |
0.138 |
-0.367 |
0.890 |
|
Grading Modulus, Gm |
0.933 |
0.127 |
-0.063 |
Results show that for principal component 1 (F1) the grading modulus and sand content followed by specific gravity and compactive effort significantly influences the MDD of the soils samples. Generally, this implies that these variables should be carefully monitored during field compaction, specification and control to achieved maximum performance of the road pavement, embankment or in any geotechnical application. Considering the principal component 2 (F2) it is evident that the silt content, specific gravity and grading modulus significantly influence the MDD of the soils. While in principal component 3 (F3) silt content, specific gravity and compactive effort shows significant effect on the MDD of the soils. Figures 9 and 10 shows the biplot and cluster plot from principal component analysis between MDD and the soil variables (CL, Si, Sa, Gs, Gm and CE).It was observed that principal component 1 (F1) influences the MDD of the soils by 52.19% (see figures 9 and 10) while principal component 2 (F2) contributed by 20.60% to the MDD values of the soils. This implies that 52.19% of the value of MDD of the soil is contributed by the grading modulus, sand content, specific gravity and compactive effort applied. Alteration of these variables greatly affects the MDD of the soils samples.
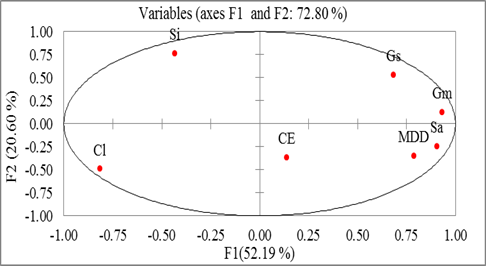
Figure 9. Biplot for maximum dry density variation with soil variables
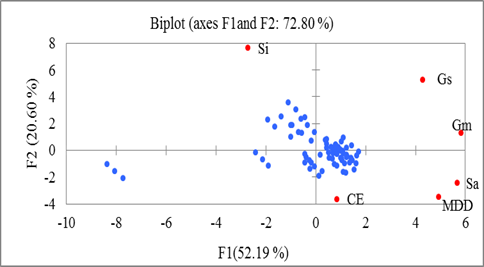
Figure 10. Cluster plot for maximum dry density variation with soil variables
In the case of optimum moisture content (OMC), the inter-correlation between OMC and the soil variables is shown in Table 5 as principal components (i.e F1, F2, F3).
Table 5. Correlations between variables and factors for optimum moisture content
|
Variables/Factors |
F1 |
F2 |
F3 |
|
Clay content, Ci |
-0.886 |
-0.367 |
0.098 |
|
Silt content, Si |
-0.325 |
0.932 |
-0.039 |
|
Sand content, Sa |
0.873 |
-0.459 |
-0.037 |
|
Specific gravity, Gs |
0.735 |
0.378 |
-0.140 |
|
Compactive Effort CE |
0.083 |
0.083 |
0.988 |
|
Grading Modulus, Gm |
0.938 |
-0.020 |
-0.069 |
Results show that for principal component 1 (F1) the entire component significantly influences the OMC of the soils samples except for silt and clay content. Generally, this implies that these variables should be carefully monitored during field compaction, specification and control to achieved maximum performance of the road pavement, embankment or in any geotechnical application. Considering the principal component 2 (F2) it is evident that the silt content, specific gravity and compactive effort significantly influence the OMC of the soils. While clay and sand contents tend to have negative impact on the OMC. However, in principal component 3 (F3) only silt content and compactive effort shows significant effect on the OMC of the soils. Figure 11 and 12 shows the biplot and cluster plot from principal component analysis between OMC and the soil variables (Cl, Si, Sa, Gs, Gm and CE).
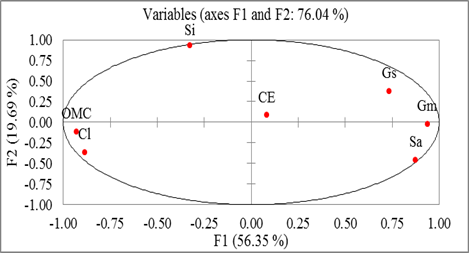
Figure 11. Biplot for optimum moisture content variation with soil variables
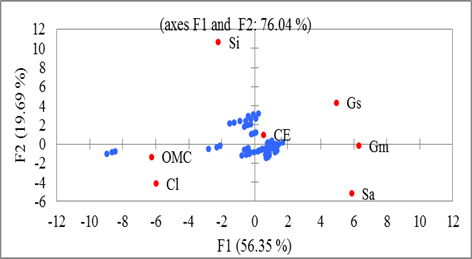
Figure 12. Cluster plot for optimum moisture content variation with soil variables
It was observed that principal component 1 (F1) influences the OMC of the soils by 56.35% (see Figure 11 and 12) while principal component 2 (F2) contributed by 19.69% to the OMC values of the soils. This implies the 56.35% of the value of OMC of the soil was contributed by the grading modulus, sand content, specific gravity and compactive effort applied. Alteration of these variables greatly affects the OMC of the soils samples.
Correlation analysis for compaction characteristics
The use of correlation analysis in engineering applications yielded positive results by [31]. Correlation analysis shows relationships between variables. The relationship between MDD and the soil independent variables (Cl, Si, Sa, Gs, Gm and CE) shows some level of relationships.
Findings from the correlation test revealed that High and positive correlation exist between MDD and Sa (0.857; P˂0.05); Gm (0.857; P˂0.05), Low and positive correlation between MDD and Gs (0.317; P<0.05); CE (0.463; P<0.05) (see Table 6).
Table 6. Correlation matrix (Pearson) for compaction characteristics
|
Variables |
MDD |
Cl |
Si |
Sa |
Gs |
CE |
Gm |
|
OMC |
1 |
-0.476 |
-0.409 |
0.658 |
0.317 |
0.463 |
0.696 |
|
Cl |
0.857 |
1 |
-0.082 |
-0.644 |
-0.715 |
0.000 |
-0.801 |
|
Si |
0.173 |
-0.082 |
1 |
-0.706 |
0.035 |
0.000 |
-0.298 |
|
Sa |
-0.740 |
-0.644 |
-0.706 |
1 |
0.463 |
0.000 |
0.793 |
|
Gs |
-0.598 |
-0.715 |
0.035 |
0.463 |
1 |
0.000 |
0.621 |
|
CE |
-0.262 |
0.000 |
0.000 |
0.000 |
0.000 |
1 |
0.000 |
|
Gm |
-0.866 |
-0.801 |
-0.298 |
0.793 |
0.621 |
0.000 |
1 |
|
MDD - maximum dry density (Upper diagonal); OMC - optimum moisture content (Lower diagonal); Cl - clay content; Si - silt content; Sa - sand content; Gs - specific gravity; CE - compactive effort; Gm - grading modulus. |
|||||||
In the case of MDD and the other variables (Cl and Si) negative correlations was observed, C l (-0.476; P˂0.05); Si (-0.409; P˂0.05).
A comparison of the results shows that the highest correlation coefficient was observed between MDD and Gm (0.696; P˂0.05). The lowest correlation coefficient was observed between MDD and Si (-0.409; P ˂0.05). In the case of OMC, findings from the correlation test revealed that High and positive relationships exist between OMC and Cl (0.857; P˂0.05), Low and positive relationships exist between OMC and Si (0.173; P >0.05) (see table 6). In the case of OMC and other variables, negative relationship was observed, Sa (-0.740; P˂0.05); Gs (-0.598;P˂0.05); CE (-0.262;P˂0.05) and Gm (-0.866;P˂0.05). The highest correlation coefficient was observed between OMC and Cl (0.857; P˂0.05). The lowest correlation coefficient was observed between OMC and CE (-0.262; P ˂0.05).
Conclusions
The natural soils are generally non plastic with the exception of few samples, these falls within the range of A-2-4 and A-3 using AASHTO classification system. Using USCS, the soils falls within CL, SM and SC group. Results show that the grading modulus and maximum dry density (MDD) decreased with increase in the fines content in the range of 10-90%, while the optimum moisture content (OMC) increased with increase in the fines content.
The MDD increase with increase in grading modulus of the soil while the OMC decreased with increase in the grading modulus of the soil. Generally, statistical evaluation of the test results using regression, correlation and principal component analysis showed a strong relationship between the dependent variables (MDD and OMC) and the soils variables used as independent variables and strongly influence the compaction properties of semi-arid zone soils.
Therefore, it is recommended that carefully monitoring of these variables during field compaction or in any geotechnical application will be of great importance. Further studies should consider the used of these statistical techniques to evaluate the effect of these variables on the strength properties of semi-arid zone soils.
References
1. AASHTO, Standard specification for transportation, material and methods of sampling and testing, 14th Edition American Association of State Highway and Transportion Officials. Washington D.C, 1986.
2. ASTM Standard D2487, Standard practice for classification of soils for engineering purposes (unified soil classification system), ASTM International, West Conshohocken, PA, 2000, DOI: 10.1520/D2487-00, 2000.
3. Evenari M., Shanan L., and Tadmor N.H., The Negev, Harvard University Press, Cambridge, Massachusetts, 1971.
4. Perry A.S. and Perry R.Y., Effects in arid regions, Ecotoxicology and Climate, Edited by P. Bourdeau, J. A. Haines, W. Klein and C. R. Krishna Murti Published by John Wiley & Sons Ltd, 1989.
5. Horpibulsuk S., Suddeepong A., Chamket P., Chinkulkijniwat A., Compaction behavior of fine-grained soils, lateritic soils and crushed rocks, Soils and Foundations, 2013, 53(1):166–172. DOI: dx.doi.org/10.1016/j.sandf.2012.12.012.
6. Ogundalu A.O., Oyekan G.L. and Meshida E.A., Effects of steel mill scale on the strength characteristics of expansive clay soils (Black Cotton Clay soil. Civil and Environmental Research, 2013, 3 (12), p. 52-63.
7. Ramasamy S., Arumairaj P.D., The effect of polypropylene fiber on index properties and compaction characteristics of clay soil, Turkish Journal of Engineering, Science and Technology, 2013, 02, p. 35-38.
8. Ogundalu A.O., Oyekan G.L. Mineralogical and geotechnical characterization of maiduguri black cotton soil by X-Ray diffraction (XRD), X-Ray photoelectron (XPS) and scanning electron spectroscopy (SEM), International Journal of Engineering and Technology, 2014, 4 (6), p. 345-353.
9. Ramadas T.L, Dargar Kumar N. and Yesuratnam G., Geotechnical characteristics of three expansive soils treated with lime and fly ash, International Journal of Earth Sciences and Engineering, 2011, 4 (6), p. 46-49.
10. Dafalla M.A., Shamrani M.A., Expansive soil properties in a semi-arid region, Research Journal of Environmental and Earth Sciences, 2012, 4 (11), p. 930-938.
11. Mirzaii A. and Negahban M., California bearing ratio of an unsaturated deformable pavement material along drying and wetting paths, Road Materials and Pavement Design, 2016. 17:1, p. 261-269, DOI: 10.1080/14680629.2015.1067247.
12. Gaaver K.E., Geotechnical properties of Egyptian collapsible soils, Alexandria Engineering Journal, 2012, 51, p. 205–210. DOI: dx.doi.org/10.1016/j.aej.2012.05.002
13. Eme D.B., Nwofor T.C. and Sule S., Correlation between the California bearing ratio (CBR) and unconfined compressive strength (UCS) of stabilized sand-cement of the Niger Delta, International Journal of Civil Engineering, 2016, 3 (3), p. 7-13, DOI: 10.14445/23488352/IJCE-V3I3P103.
14. Kumar K.S.P., Rajeshekhar A., Kumar N.D., Influence of plunger friction on California bearing ratio of low plasticity clay soils, Malaysian Journal of Civil Engineering, 2014, 26 (3), p. 307-325.
15. Nigerian General Specifications: Federal Ministry of Works and Housing. General Specifications for Roads and Bridges, vol. II, Clauses 6220; 6221; 6228. 1997.
16. Fookes P.G. and Gahir J.S, Engineering performance of some coarse grained arid soil in Libyan Fezzan, The Quarterly Journal of Engineering Geology, 1995, 28 (2), p. 105 - 130.
17. B.S. 1377. Method of test for soil for civil engineering purposes, British standard Institution. Hamlet Press. London, 1990.
18. Aboshio A., Comparative study of the California bearing ratio test and undrained triaxial compressive strength test for lateritic soils, Journal of Engineering and Technology, 2010, 5 (2), p. 1-4.
19. Akiije I., Chemical stabilization of selected laterite soils using lateralite for highway pavement, International Journal of Engineering and Technology, 2015, 5 (5), p. 275-282.
20. Kalinski M.E. and Vemuri S.C., A geophysical approach to construction quality assurance testing of compacted soil using electrical conductivity measurements, Earthquake Engineering and Soil Dynamics, Geotechnical Special Publication, 2005, 133, p. 1-10.
21. Chaudhari P.R., Ahire D.V., Chkravarty M. and Maity S., Electrical conductivity as a tool for determining the physical properties of Indian soils, International Journal of Scientific and Research Publications, 2014, 4 (4), p. 1-4.
22. Marx E.S., Hart J. and Stevens R.G., Soil testing interpretation guide, Oregon State University, Corvallis, 1999.
23. Chik Z. and Islam T., Study of chemical effects on soil compaction characterizations through electrical conductivity, International Journal of Electrochemical Science, 2011, 6, p. 6733 - 6740.
24. Ferreira C.A.M., Ponciano J.A.C., Vaitsman D.S. and Pérez D.V., Evaluation of the corrosivity of the soil through its chemical composition, Science of the Total Environment, 2007, 388, p. 250-255.
25. Ola S.A., Geotechnical properties and behavior of some Nigerian lateritic soils, In Ola S.A ed. Tropical soils of Nigeria in engineering practice, 1983.
26. Holtz W.G., Gibbs H.J., Engineering properties of expansive clays, Trans. Am. Soc. Civil Eng. (ASCE), 1956, 121, p. 641–677.
27. Osinubi K.J., Eberemu A.O., Bello A.O. and Adzegah A., Effect of fines content on the engineering properties of reconstituted lateritic soils in waste containment application, Nigerian Journal of Technology, 2012, 31 (3), p. 277- 287.
28. Osinubi K.J., Nwaiwu C.M.O. and Ochepo J., Effect of fines content on the compaction characteristics of laterite soils, NSE Technical Transactions, 2002, 37, (4), p. 10-27.
29. Osinubi K.J., Eberemu A.O. and Kasham L.S., Influence of bagasse ash content on the hydraulic conductivity of compacted lateritic soils at reduced proctor effort, Proceedings of Bi-Monthly Meet-fings/Workshops. Materials Society of Nigeria (MSN) Zaria Chapter. A.B.U. Zaria, 2007, p. 17-25.
30. Herve A., Lynne J.W, Principal component analysis. A review, John Wiley and Sons, Inc. 2010, 2, p. 433-459, DOI: 10.1002/wics.101.
31. Gadzama E.W, Nuhu I. and Yohanna P., Influence of temperature on the engineering properties of selected tropical black clay, Arabian Journal for Science and Engineering. King Fahd University of Petroleum and Mineral Resources Publication. Saudi Arabia, 2017, DOI 10.1007/s13369-017-2485-3.