Engineering, Environment
New approach for optimizing friction stir welding in aluminium composites
Amal NASSAR 1*, Eman NASSAR 2, Mona YOUNIS 3
1,2,3 Department of Mechanical Engineering, Higher Technological Institute, Tenth of Ramadan City, Egypt
E-mail: *amal.nasser@hti.edu.eg
*Corresponding author phone: +201006414107; Fax: +20224924319
Received: June 20, 2018 / Accepted: September 4, 2018 / Published: December 30, 2018
Abstract
Optimal parameters of friction stir welding are an important step to improve mechanical properties of the fusion welding joints for Aluminium Composites. This paper presents a new approach for optimizing these welding parameters. The parameters optimization was done by using 33 full factorial experimental designs. In this paper, based on Taguchi’s L27 orthogonal array, welding experiments were conducted for A356/SiC composite plates using a pin made from tool steel (AISI H13). The welding parameters such as, pin rotation speed, axial force and welding speed are optimized to improve the tensile strength. To correlate the measured tensile strength and the process parameters, a mathematical model has been developed by the nonlinear regression analysis.
Keywords:
Aluminium; Composite; Friction Stir Welding; Taguchi Method
Introduction
Friction stir welding is a solid-state joining technique that uses to make joint between two workpieces without melting [1, 2]. The physical and mechanical behaviour of solid-state joining technique may be found in [3,4] Actually, for the maintenance procedures and the safety, legal constructions, improve fatigue performances, uniform micro structure and high resistance become fundamental in the case of such technology. Thousands of papers are presented in the literature on microstructural, mechanical behaviour and physical of Al alloys friction stir welding, and few papers only study the effects of the processing parameters to obtain joints with a good efficiency in fatigue and tensile properties. Benignant et al [5] studies the effect of the tool geometry on the tensile properties of FSW joints. The results indicate that the rotation speed has a significant influence in determining the mechanical properties. Hong et al [6] and Lemmen et al [7] studied the effect of tool geometry and tool rotation speed on the fatigue strength of 5083 alloys. Kovac, et al., [8] focus on the effect of processing parameters on residual stresses affecting propagation and crack initiation and fatigue life in aluminium alloy. Many researchers were using statistical and finite element methods for controlling and improving welding processes.
Lemmen et al [9] used numerical and experimental analyses to study the effect of the different HAZ on the fatigue crack initiation. In [10] the author focuses the attention on developing a model to predict mechanical performances of FSW joints. Ali et al [11] were performed comprehensive characterization for micromechanics of FSW 2024 aluminium alloy joints in order to modelling the fatigue life. Tarpani [12], Pouget [13] and Fratini et al [14] they concluded that tensile residual stresses increase the rate of crack growth with the increasing in the ratio of effective stress. Zadeh et al [15] has applied Walker and Nicholls models to the crack propagation along 2024 aluminium alloy. The effect of different pre heat treatments on the mechanical properties and the microstructures have been reported by several authors such Wang et al [15], Malarvizhi et al [16], Cabibbo et al [17], Balasubramanian et al [18], Figueiredo et al [19] and Prabhu et al [20].
In this paper, statistical method was used for optimizing the welding parameters on welding A356/SiC composites. The parameters optimization ware made by using 33 full factorial experimental designs, based on Taguchi’s L27 orthogonal array. The welding parameters such as, pin rotation speed, axial force and welding speed are optimized for maximizing mechanical properties.
Material and method
In this investigation, the material used was a composite plate (A356 aluminium alloy reinforced with 1.5 vol. % of Nano Si C) with 50 mm wide, 100 mm long and 2 mm thickness. The plates were cut into the required size by a power hacksaw cutting and grinding. The A356 alloy has the chemical composition of 7.5% Si, 0.38% Mg, 0.02% Zn, 0.001% Cu, 0.106% Fe, and the rest of Al. Silicon carbide (SiC) particles in nano size were used as a reinforcement with average diameter of 50 nm. These composites were fabricated by stir casting method. In order to remove the porosity in the composites samples all casting samples were rolled in hot rolling to 50 X 100 mm2 .In the friction stir welding, tool pin profile made of (H13 steel) was used. The geometry of tool pin is shown in Figure 1. The shoulder diameter is 10 mm; pin diameter is 4 mm and pin length is 8 mm.

SD: 10mm; PD: 4mm; PL: 128mm; PS: SCT, 3F with M4 threads
Figure 1. Tool pin geometry (flat cylindrical tips)
Three traverse speeds of 25, 30 and 70 mm/min at three rotational speeds for welding tool (1000, 1100 and 1300 rpm) and at three axial force (2000, 3000, and 4000 KN) were investigated. The changes in the microstructure were examined by optical microscopy. Figure 2 shows the fabricated machine that used in the investigation.
Five tensile samples of 60 mm in length and 5 mm in width were used to find the ultimate tensile and yield strengths of the metal. Lloyd Testing Machine with 50 kN a maximum load cell capacity was used to investigate the tensile properties (strength and modulus) of the composites. A pin on disc test machine was used to evaluate the wear performances of specimens. The design of the pin on disc apparatus was described in previous work [21]. The specimens were prepared by wire cut machine in cylindrical pin with a height of 5 mm and a diameter of 4 mm and a load of 25 N was applied with a slide speed of 0.14 m/s for a distance of 1200 m.
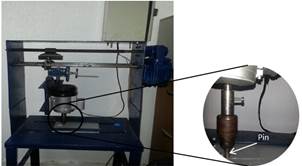
Figure 2. Fabricated friction stir welding machine
From reported by Mohammad et al [21, 23] and Won et al [24] the primary and the secondary process parameters for friction stir welding are welding speed, tool rotation speed and axial force, that effect on the amount of the generated heat during the friction welding process, were selected for this study, Figure 3 shows cause and effect diagram of factors effect on friction stir welding.
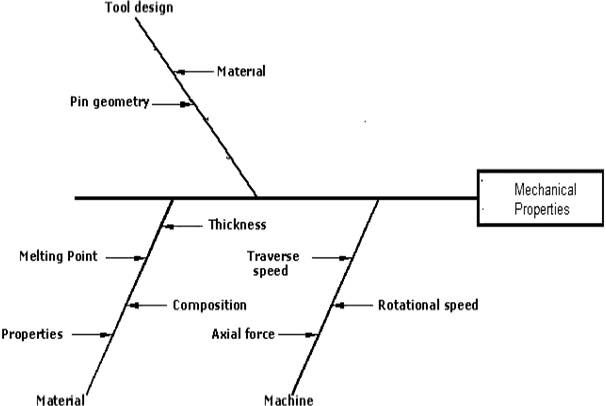
Figure 3. Cause and effect of factors, influencing the friction stir welding
Many trial runs were carried out to find out the working value of each parameter in the friction stir welding process. The working values were decided upon by inspecting the macro-structure of the weld joint. For the macro-structure inspection, the following observations have been made:
- At rotation speed, lower than 1000 RPM, tunnel defect was appeared in the welding area (Figure 5a) this defect can be due to the amount of the heat generated was insufficient.
- Rotation speed of more than 1300 RPM piping and crack defects was observed in the welding area (Figure 5b) this defect may be due to turbulence caused by the high rotation speed of the tool.
- When the speed of welding was lower than 25 mm/min, the tunnel defect was appeared in the welding area (Figure 5c), this defect might be due to the amount of input heat per unit length of weld to excess.
- When the speed of welding was higher than 70 mm/min, the tunnel and crack defects were appeared in the welding area (Figure 5d). This defect may be due to the flow of material was inadequate caused by low amounts of input heat.
- When the axial force was lower than 2 kN, pinhole defect was appeared in the welding area (Figure 5e), this defect can be due to the absence of material flow caused by insufficient down-ward force.
- When the axial force was higher than 4 kN, the tunnel defect was observed in the welding area (Figure 5f). This defect may be due to the high amount of heat input.
Figure 4 represent the working algorithm.
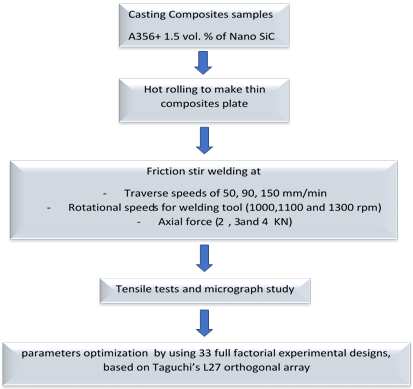
Figure 4. Investigation flowchart
Determination of working values of process parameters
Therefore, the full factorial experimental design (33) with welding speed, tool rotation speed and axial force at three levels are chosen (Table 1).
Table 1. Range and values of each process parameter
|
Process parameter |
Level 1 |
Level 2 |
Level 3 |
|
Speed of Tool rotation (N), RPM |
1000 |
1100 |
1300 |
|
Welding speed (S), mm/min |
25 |
30 |
70 |
|
Axial force (F), KN |
2 |
3 |
4 |
Result and Discussion
Analysis of variance (ANOVA)
In order to assess the influence of parameters on the response, means and signal-to-noise ratios (S/N) for every control factor to be calculated [26]. Signals are indicators of noises are a unit measure of deviations result on the average responses from experimental output. The acceptable S/N quantitative relation must be chosen mistreatment previous information, expertise, and understanding of the method eighteen. During this study, the S/N quantitative relation was chosen in keeping with the criterion, larger-the-best, to maximize response. In Taguchi methodology, the S/N quantitative relation is employed to see deviation of quality characteristics from the desired value. S/N quantitative relation (ηj) in jth experiment is often expressed as Eq. (1).
![]() (1)
(1)
Where: n - number of test and Yijk - experimental value of ith quality characteristics in jth experiment at kth test.
|
|
|
|
|
|
|
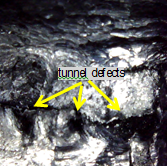
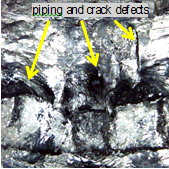
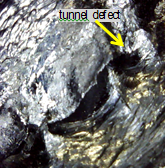
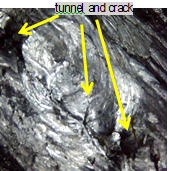
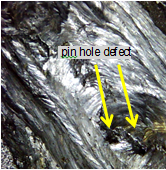
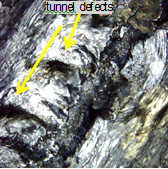
Figure 5. Macro-structure of friction stirs welding in different cases
In the current study, data of tensile strength was used to determine the effect of all friction stirs welding parameters. The results of each experiment were remodelled into means that and S/N ratio as showed in Table 2.
Table 2. Mean response of data and signal noise ratio of the tensile strength at each level
|
DF |
SS |
V |
P% |
||||
|
Average |
S/N ratio |
Average |
S/N ratio |
Average |
S/N ratio |
||
|
Speed of Tool rotation (N), RPM |
2 |
1652 |
8.857 |
826.03 |
4.4286 |
50.71% |
53.86% |
|
Welding speed (S), mm/min |
2 |
1129 |
5.319 |
564.59 |
2.6593 |
33.29% |
32.34% |
|
Axial force (F), KN |
2 |
333.4 |
1.671 |
166.7 |
0.8355 |
9.83% |
10.16% |
|
(N and S) |
4 |
62.59 |
0.2989 |
15.65 |
0.07473 |
0.67 |
0.61% |
|
(N and F) |
4 |
23.7 |
0.0552 |
5.926 |
0.0137 |
0.09 |
0.02% |
|
(S and F) |
4 |
29.04 |
0.1372 |
7.259 |
0.03429 |
0.01% |
0.07% |
|
Error |
8 |
37.243 |
0.213 |
|
5.40% |
2.94% |
|
|
Total |
26 |
3266.973 |
16.5513 |
100 |
100 |
||
Figures 6 and 7 show the mean effect and the S/N ratio of the calculated tensile strength by Minitab 17, the maximum value for TS was when (level 2) N =1100 RPM (level 3), F = 4 kN and (level 2), S = 30 mm/min.
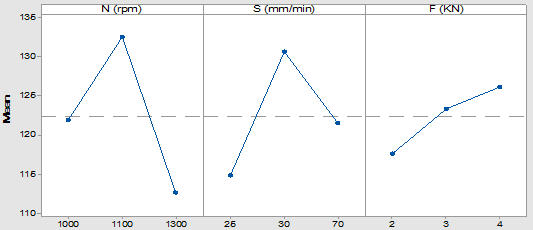
Figure 6. Response graphs (average) of tensile strength
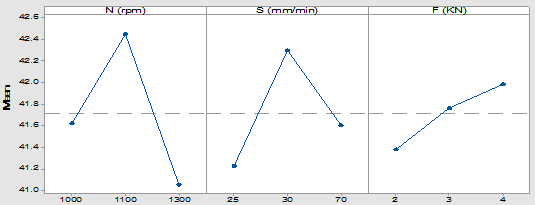
Figure 7. Response graph (S/N ratio) of tensile strength
ANOVA has been done to find out the statistically significant parameters that effect on the tensile strength (Table 3) by using Minitab 17 software. The results of the statistical analysis show that the selected FSW parameters are highly significant affecting on tensile strength for the welding joint. Table 2 shows the mean response and analysis of data and signal noise ratio of the tensile strength at each level. It is observed from Table 4 that high S/N ratio is corresponding to high tensile strength. Subsequently, the ideal level of the parameter is that the level of highest S/N ratio [27].
Table 3. Effect of process parameters on tensile strength
|
Para- meters |
Mean |
Delta |
s/n |
Delta |
||||||
|
Level 1 |
Level 2 |
Level 3 |
L2-L1 |
L3-L2 |
Level 1 |
Level 2 |
Level 3 |
L2-L1 |
L3-L2 |
|
|
N |
115.66 |
120.44 |
117.33 |
4.777 |
-3.11 |
41.23 |
41.62 |
41.38 |
0.398 |
-0.24 |
|
S |
131 |
132.222 |
123.11 |
1.222 |
-9.11 |
42.3 |
42.45 |
41.76 |
0.15 |
-0.69 |
|
F |
113.67 |
119.666 |
125.88 |
6 |
6.222 |
41.05 |
41.98 |
41.6 |
0.927 |
-0.38 |
|
NS |
115.66 |
120.222 |
117.22 |
4.555 |
-3 |
41.42 |
41.2 |
41.62 |
-0.22 |
0.42 |
|
NF |
130.11 |
132.33 |
122.55 |
2.222 |
-9.77 |
42.436 |
42.3 |
41.7 |
-0.136 |
-0.6 |
|
SF |
120.33 |
113.55 |
126.33 |
-6.777 |
12.77 |
41.104 |
41.62 |
41.9 |
0.515 |
0.28 |
Figure 8 illustrates the contribution percentage of all factors (average) and their interactions.
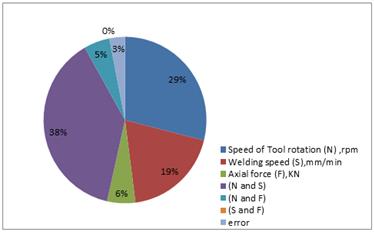
Figure 8. Contribution % of all factors (average) and their interactions
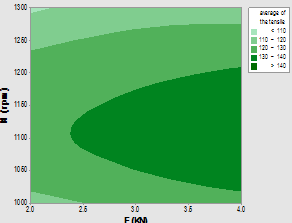
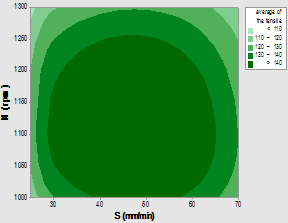
Figure 9 illustrates the contour plot average. Percentage of contribution (P %) is the portion of total variation ascertained within the experiment attributed to every significant process parameter (Figure 9). It is also a function of the total of the squares for every significant item to reduce the value of a variable. Optimum values of tensile already in Table 3 ((level 2) N =1100 RPM; (level 3), F = 4 kN; and (level 2), S = 30 mm/min). The mean response of tensile strength may be calculated by [28, 29] is Eq. (2):
![]() (2)
(2)
Where: T- average of TS; N- average of tensile strength at the second level of tool rotation speed 1100 RPM; S- average of tensile strength at the second level of welding speed 30 mm/min; F- average tensile strength at the third level of axial force.
|
(a) Tensile vs speed of tool rotation (N) rpm; axial force (F) |
(b) Tensile vs speed of tool rotation (N) rpm; welding speed (S) |
|
(c) Tensile vs axial force (F); welding speed (S) |
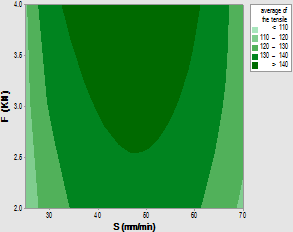
Figure 9. Contour plot of average
Confirmation Test
Confirmation tests were made in the ideal setting of processing parameters, (N= 1100 RPM, S=30 mm/min and F= 4 KN) to compare tensile strength obtained experimentally with that obtained by the numerical model. The measured ultimate tensile strength was 134.4084 MPa, it is It is obviously close to the predicted values by the suggested numerical model. Figure 10 shows the microstructures of FSW joint at the selected parameters. The figure reveals that there is no deformity because of sufficiently high temperature furthermore, also it is discovered that coarse Si particles in base metal are divided into better size and appropriated consistently in the Al grid because of optimum stirring during friction welding.
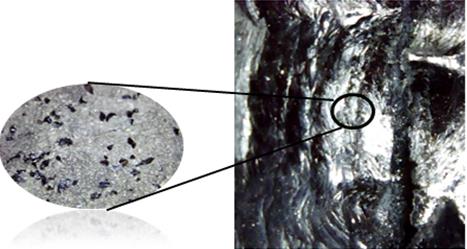
Figure 10. The micro-structures of FSW joint
Regression model
A nonlinear regression model was developed to correlate FSW parameters and tensile strength of joints. The model was based on the experimentally measured tensile strength of A356/SiC composite. Statistical software MINITAB 17 was used to calculate Regression coefficients at 95% level of confidence to estimate tensile strength by using these coefficients.
TS = {139.4 – 4.30 (N) +1.90 (S) + 3.80 (F) - 1.625(NS) - 1.375(NF) + 0.125 (SF) – 16.5 N2 - 13.5 S2 + 4.0 F2}.
The efficiency of the model was examined by using ANOVA, all terms, including N2, S, N, F2 and S2 were found to be considerable at 95% intervals of confidence. The coefficient of Determination (R2) =0. 23456, indicates that more than 98% of all variations is explained by the model.
Effect of welding process parameters on tensile strength
The maximum tensile strength values were obtained at 4 KN, this is due to the improving in the welding joint. The high force during welding process produce high temperature which helped in easy deformation for the welding area as reported by Kurt et al. [30]. Tensile strength increases with an increase in the rotational speed up to 1100 RPM and an increase in the traverse speed up to 30 mm/min, after that the increasing in the rotational speed and traverse speed reduce the fusion in the welding zone which reduce the quality of the welding joint the same results has been reported by Winiczenko et al [31].
Conclusion
Based on Taguchi’s L27 orthogonal array, welding experiments were conducted for A356/SiC composite plates. The welding parameters such as, pin rotation speed, axial force and welding speed are optimized for maximizing tensile strength. The Axial force shows a lower effect on tensile strength comparable to all friction stir parameters. Pin rotation speed is highest significant parameter to deciding the TS of the joint. The maximum TS be observed in welding joints as an ideal setting of processing (N= 1100 RPM, S=30 mm/min and F= 4 KN) this is due to suitable fusion in welding zone. The regression model has been found to be excellent in predicting TS. The regression model may appoint successfully in designing the friction stirs welding process parameters of A356/SiC composite plates.
References
1. Svensson L.E., Karlsson L., Larsson H., Karlsson B., Fazzini M., Karlsson J. Microstructure and mechanical properties of friction stir welded aluminium alloys with special reference to AA 5083 and AA 6082, Science and Technology of Welding and Joining, 2000, 5 (5), p. 285- 296.
2. Dawes C., Thomas W., Friction stir joining of aluminium alloys, TWI Bull., 195, p. 124–127.
3. Mishra R.S., Ma Z.Y., Friction stir welding and processing, Mater. Sci. Eng., 2005, 50, p. 1-78.
4. Simar A, Bréchet Y, de Meester B, Denquin A, Gallais C, Pardoen, Integrated modelling of friction stir welding of 6xxx series Al alloys: Process, microstructure and properties T. Prog Mater Sci., 2012, 57, p. 95–183.
5. Blignault C., Hattingh C., James M.N., Optimizing friction stir welding via statistical design of tool geometry and process parameters, J. Mater. Eng. Perf., 2012, 21 (6), p. 927-935.
6. Hong S., Kim S., Lee C.G., Kim S.J., Fatigue crack propagation behaviour of friction stir welded 5083-H32 Al alloy, J. Mater. Sci., 2007, 42, p. 9888–9893.
7. Lombard H., Hatting D.G., Steuwer A., James M.N., Optimizing FSW process parameters to minimize defects and maximize fatigue life in 5083-H321 aluminium alloy, Engineering Fracture Mechanics, 2008, 75, p. 341-354.
8. Kovac P., Pucovsky V., Gostimirovic M., Savkovic B., Dragan R., Influence of data quantity on accuracy of predictions in modelling tool life by the use of genetic algorithms, Int. Journal of Industrial Engineering, 2014, 21 (2), p. 66-73.
9. Lemmen H.J.K., Alderliesten R.C., Benedictus C., Fatigue initiation behaviour throughout friction stir welded joints in AA2024-T3, Int. J. of Fat., 2010, 32, p. 1928-1936.
10. Ma Y.E., Staron P., Fisher T., Irving P.E., Size effects on residual stress and fatigue crack growth in friction stir welded 2195-T8 aluminium, – Part I: Experiments, Int. J. of Fat., 2011, 33, p. 1417–1425.
11. Ali A., Brown M.W., Rodopoulos C.A., Gardiner S., Characterization of 2024-T351 Friction Stir Welding Joints, J. Fail. Anal. Prev., 2006, 6 (4), p. 83-96.
12. Milan M.T., Bose Filho W.W., Coft R., Tarpani J.R., Fatigue behaviour of friction stir welded AA2024-T3 alloy: longitudinal and transverse crack growth, Fatigue Fracture Engineering Material Structure, 2008, 31, p. 526–538.
13. Pouget G., Reynolds A.P., Residual stress and microstructure effects on fatigue crack growth in AA2050 friction stir welds, Int. J. of Fat., 2008, 30, p. 463–472.
14. Fratini L., Pasta S., Reynolds A.P., Fatigue crack growth in 2024- T351 friction stir welded joints: Longitudinal residual stress and microstructural effects, Int. J. Fat., 2009, 31, p. 495–500.
15. Golestaneh A.F., Ali A., Zadeh M., Modelling the fatigue crack growth in friction stir welded joint of 2024-T351 Al alloy, Mater Des., 2009, 30, p. 2928–2937.
16. Malarvizhi S., Balasubramanian V., Effect of welding processes on AA2219 aluminium alloy joint properties, Trans non Ferr Met Soc China, 2011, 21, p. 962-973.
17. Cavaliere P., Cabibbo M., Panella F., Squillace A., 2198 Al–Li plates joined by friction stir welding: Mechanical and microstructural behaviour, Materials & Design, 2009, 30, p. 3622–3631.
18. Malarvizhi S., Balasubramanian V., Effects of welding processes and post-weld aging treatment on fatigue behaviour of AA2219 aluminium alloy joints, J of Mat Eng., 2011, 20 (3), p. 359-367.
19. Moreira P.M.G.P., de Figueiredo M.A.V., de Castro P.M.S.T., Fatigue behaviour of FSW and MIG weldments for two aluminium alloys, Th. and App. Frac. Mec., 2007, 48 (2), p. 169–177.
20. S. Prabhu A.K., Shettigar K., Rao S., Rao and M. Herbert, Influence of welding process parameters on microstructure and mechanical properties of friction stir welded aluminium matrix composite, Materials Science Forum, 2017, 880, p.50-53.
21. Xun Tong , Youn Ju Woo, Dong-Won Jang , Kap Hwan Kim, Heuristic rules based on a probabilistic model and a genetic algorithm for relocating inbound containers with uncertain pickup times, Int. J. of Ind. Eng., 2015, 22 (1), p. 93-101.
22. Nassar A., Nassar E., Design and fabrication of a wear testing machine, Leonardo Electronic Journal of Practices and Technologies, 2011, p. 39-48.
23. Elangovan K., Balasubramanian V., Influences of pin profile and rotational speed of the tool on the formation of friction stir processing zone in AA2219 aluminium alloy, J. Mater. Sci. Eng. A, 2007, 459, p. 7-18.
24. Elangovan K., Balasubramanian V., Effect of tool pin profile and axial force on the formation of friction stir processing zone in AA6061 aluminium alloy, Int. J. of Adv. Man. Tech., 2008, p. 251-260.
25. Won B.L., Mechanical properties related to microstructural variation of 6061 Al alloy joints by friction stir welding, Materials Transactions, 2004, 45, p. 1700-1705.
26. Elango V., Karunamoorthy L., Effect of lighting conditions in the study of surface roughness by machine vision – an experimental design approach, Int. J. of Adv. Man. Tec., 2008, p. 92-103.
27. Sharma P., Verma A., Sidhu R.K., Panday O.P., Process parameter selection for strontium ferrite sintered magnets using Taguchi L9 orthogonal design, Journal of Materials Processing Technology, 2005, 168, p. 147-151.
28. Mahapatra S.S., Patnaik A., Optimization of wire electrical discharge machining (WEDM) process parameters using Taguchi method, Int. J. of Adv. Man. Tec., 2007, p. 911-925.
29. Ross P.J., Taguchi techniques for quality engineering, McGraw- Hill, New York, 1996, p. 23–42.
30. Kurt A., Uygur I., Paylasan U., Effect of friction welding parameters on mechanical and microstructural properties of dissimilar AISI 1010-ASTM B22 joints, Weld Journal, 2011, 90, p. 102–106.
31. Winiczenko R., Effect of friction welding parameters on the tensile strength and microstructural properties of dissimilar AISI 1020-ASTM A536 joints, Int. J. Adv. Man. Tec., 2016, 84, p. 941–955.