Engineering, Environment
Ceramics application of Mgbom clay: Characterization and micro-structural studies
Mark Agaba ABUH 1*, Ndubuisi Edennaya IDENYI 2, Arit Beka ETUKUDOH 1, Chijioke Gideon ITUMA 2, Chidubem Ignatus OBIOHA 3, Christian Oluchukwu ASADU 3
1Department of Ceramics Research and Production, Projects Development Institute (PRODA), Enugu State, Nigeria
2Department of Physics, Ebonyi State University (EBSU), Abakaliki, Ebony state, Nigeria
3Department of Chemical Engineering, Enugu State University of Science and Technology (ESUT), Enugu, Nigeria
Emails: markabuh1@gmail.com, edennaidenyi@yahoo.com, arit_etukudohproda@yahoo.com, chidubemignatus@gmail.com, itumajohnson2@gmail.com, aasadu@yahoo.com.
Corresponding Author, phone: +234 8039264998
Received: March 11, 2018 / Accepted: October 29, 2018 / Published: December 30, 2018
Abstract
Mgbom clay obtained from Afikpo in Ebonyi state Nigeria was analyzed for its ceramics application. The physical, chemical and spectral characterization of the clay was carried out to obtain more information about this commercially available clay. The FTIR showed vibrational band at 864.7-1148 cm-1 consistent with Si – O stretching and a band at 3448 cm-1 which is due to OH- stretching vibration. Bands consistent with Quartz, Kaolinite and Carbonates were observed. The XRD analysis confirms the presence of Quartz (SiO2), Kaolinite (Al2Si2O5 (OH)4) and Hematite (Fe2O3). The SEM studies shows finely distributed uniform surface with isolated patches of granulated texture. The physical characterization also shows values of modulus of plasticity (1.23) and water of plasticity (46%) which classifies the clay as strong, plastic and expansive. From the chemical composition, value obtained for SiO2 (51.21) is considered suitable for paper, paints, mid-temperature refractory, glazes and earthenware ceramics but low values of Al2O3 (24.33) and high value of Fe2O3 (11.42) has limited the application of this clay to earthenware ceramics and iron glazes.
Keywords
Mgbom Clay; Water of Plasticity; FTIR; XRD; SEM; Physical analysis; Chemical profile
Introduction
Clays are available in different particles sizes and colors depending on their extent of migration from source (primary and or secondary clays), inorganic impurities, organic matters, plasticity and minerals inherent in them. They are anhydrous complexes of alumina (Al2O3) and silica (SiO2) generally represented by the molecular formula Al2O3.2SiO2.2H2O [1]. Some of the clays found in Nigeria have been investigated to suggest possible areas of applications Consequently, such clays as Nkpuma-akpatakpa clay, Ishiagu clay, Ogugu clay, Adiabo clay, Nsu clay, Ukpor clay, Enugu fireclay, Dagbagi Clay, Jos kaolin, Maikunkele clay, Afuze clay, Usen clay, Uzalla clay, Kankara kaolin, Getzo kaolin, Mayo-Belwa clay, Ibamajo, Moye and Nkwo-Alaike Fireclays, Onibode Fire-Clay and many more have been characterized and found useful applications for ceramics and refractory uses [1][2][3].
Sadly, it’s been observed that most of the imported ceramic base products are made with coloring oxides, glazes and body recipes considered toxic to humans and environment. The primary raw material for ceramics in Nigeria is clay. The dearth of technology in the West African and Africa’s most populous nation (Nigeria) has limited ceramics growth to Clay since the know-how to handle advance ceramics is unavailable.
The demand for clay base ceramics in Nigeria is so high that demand is met through importation. The volume of ceramics activities handled by manufacturing companies like West African Ceramics, Royal Ceramics, BN ceramics which are undoubtedly the biggest ceramics firms in Nigeria and the existence of other smaller ones all heavily involve in clay base ceramics have encouraged the need to report more available options to avoid importation of clays, ceramics and materials that can be locally sourced and available.
Mgbom clay is relatively abundant and in commercial quantity and unique for its thick reddish brown coloration, found in Afikpo Local Government of Ebonyi State. The clay is currently being used for the production of ceramic wares such as earthen wares, pots, plate, figurines, flower vases, iron base glazes e.t.c but no detailed study of its engineering properties and other industrial utilization have been documented.
This study aims to establish the mechanical and structural profile of the clay with a view to suggesting other industrial areas of application. This is to discourage the spending on FOREX by government in subsidies or direct import of ceramics materials that have local alternatives for technology and wealth creation.
Materials and Methods
The Mgbom clay was obtained at different locations at a depth of 1.52 m to get a good representation of the site and brought to the Ceramics Engineering Research laboratory for detailed study.
Characterization of the Clay Sample
The physical, chemical, spectral study was also carried out and results generated were compared with standards in literature, to ascertain the suitability of this clay for ceramics application either for earthenware, porcelain, glaze, thermal and electrical insulation, refractory and or others.
Experimental procedures for the physical analysis of clay
The clay sample was processed as described by [1, 3]. Dry processing method was employed as shown in Figure 1. The clay obtained was air dried, pulverized and sieved using 0.35 mm mesh to remove debris and coarse materials, then oven-dried at 1100C to constant weight. The dried clay was again pulverized, sieved using a 0.18 mm mesh and stored in dry large plastic containers for analyses. A known weight of the Clay was mixed with calculated amount of water to achieve mold ability for test specimen production.
Figure 1. Flow sheet of dry processing method of clay
Sample preparation for chemical analysis
The processed powdered sample was analyzed using AAS. A known mass of the dried sample was measured and digested with Aqua-Regia (Hydrochloric acid: Nitric acid in a ratio 3:1). After the digestion, a known volume of Hydrofluoric acid was added to ensure complete digestion. The digested mixture was then filtered using Whatmann no. 5 filter paper and water was added to the filtrates obtained and made to standard volume for AAS analysis. The residue obtained was ashed at 5000C to constant weight in a platinum crucible and the non combustible component obtained was used for silica determination.
Sample preparation for micro-structural analysis
The stored pulverized sample was prepared for X-ray Diffraction (XRD), Scanning Electron Microscopy (SEM), and FTIR as described by [1]. SEM model JEOL 840 was used for the Scanning Electron Microscopy. The Philips PW 1830 X-ray diffractometer with a cu-anode was used for the XR-D study. Mineral peaks were identified using XPert High Score plus Software.
Mechanical test
Parameters such as Flexural strength, Water absorption, Linear(dry – fired)shrinkage, apparent porosity, bulk density, apparent density, refractoriness, cold compressive strength among others were determine. Methods employed were as described by [3, 4].
Flexural strength: The test pieces of dimension 10.2cm x 1.5cm x 2.1cm were used for this test and were supported on the ends of three cylindrical rods arranged in an equilateral triangle form and a load electrically applied by the rupture machine until it failed. The test is also called modulus of rupture (MOR) test. Corresponding to the temperatures, the MOR was computed as Eq. [1]:
![]() (1)
(1)
Where: P - yield/breaking load in Kg, L - distance between supports (7 cm), H - height in cm, B - breathe in cm.
Water Absorption: The rectangular bars test pieces of dimension 8 cm x 4.1 cm x 2.1 cm were used for this study. The test specimen after heating at the experimental temperatures and weighed (Wf) to the nearest cm, were boiled for two (2) hours, brought down and allowed to cool, cleaned and weighed (Ws) again. The water absorption, W.A. (%) was computed as Eq. [2]:
![]() (2)
(2)
Linear shrinkage: The rectangular bar test specimen of dimension 8.0 cm x 4.1 cm x 2.1 cm with a line of 5 cm drawn at their centers were used for this test. The green samples were allowed to dry at room temperature while the others were dried and sintered at experimental temperatures inscribed on them. After sintering, the change in the 5 cm line drawn was recorded using a veneer caliper. The drying shrinkage was determined using the Eq. [3].
![]() (3)
(3)
Where: Sl – Linear (Dry-Fired) Shrinkage, Ld – Dried length and Lf – Fired length.
Apparent porosity: method was as described for water absorption. It was calculated as Eq. [4-5]:
![]() (4)
(4)
Where: A.P – Apparent Porosity (%).
Similarly, Apparent Density was computed as shown in Eq. [5].
![]() (5)
(5)
Where: A.D – Apparent Density (g/cm3)
Bulk density was calculated as in Eq. [6]:
![]() (6)
(6)
Where: Wp – suspended weight (g), B.D - Bulk Density (g/cm3)
Water of Plasticity: a known mass of the dried pulverized clay sample was measured out W1. 1000 ml (1 litre) graduated cylinder was filled with water which was added to the clay (W1) in little proportions at a time followed by thorough mixing and kneading till a homogenous mass of about the right consistency for molding was achieved. The amount of water added to the clay was noted and the equivalent weight recorded as W2. The percentage water of plasticity was then calculated as Eq. [7]:
![]() (7)
(7)
Where: W2 – Weight of Water used, W1 – Weight of sample used and Dw – Density of water and W.P – Water of Plasticity (%).
Cold Crushing Strength: The test measures the resistance of bricks to load. Test bricks sintered at 9000C were crushed using hydraulic compression crusher fitted with a manual manometer. Load was exerted by pulling the manual hand wheel until failure occurred and the corresponding manometer reading noted. The CCS was computed as Eq. [8]:
![]() (8)
(8)
Where: Lm – Maximum Load (KN), Ac – Cross Sectional Area (m2).
Refractoriness: Pyrometric cones (Orton standard pyrometric cones) designed to deform at 1000, 1250, 1300, 1400, and 15000C were used in accordance with the ASTM standard. Temperature was raised at 100C/min as was programmed in the digital pyrometer fitted to the furnace. The furnace had a maximum temperature of 15000C. Test specimens at the experimental temperatures were observed for signs of failure, cracks or deformation. The temperature for which such failure signs were observed was taken as refractory temperature beyond which the body will collapse.
Making moisture: cylindrical test pieces in triplicates were used for this test. Immediately after obtaining a uniform mass of the clay with appropriate consistency for molding, this was the first test carried out. The weights of the test specimen before and after drying to constant weight at 1100C were known and recorded. The making moisture dry basis was then calculated as Eq. [9]:
![]() (9)
(9)
Where: Ww – wet weight (g), Wd – dry weight (g), M.M – making moisture (%).
Results and Discussion
Raw materials: Increase in temperature increased the opacity of the ceramic color as the bricks obtained darkened. The color shift was from brown to purple at 12500C. The change in color might indicate the presence of lots of transitional elements in the body [5][6].
Chemical Analysis: The oxide distribution is shown in Table 1. Elevated levels of fluxing oxides such as Fe2O3, CaO, MgO, and K2O were observed. These fluxing agents alter the vitrification temperature of ceramics bodies by pulling it down. Without fluxing oxides, it would be difficult to produce glass and other impervious ceramic bodies since extremely high temperatures would be required to melt the glass formers in a ceramics matrix. The higher the fluxing oxides in clay, the lower the maturing temperature of the clay. This is the principle applied in the development of glazes. Silica (SiO2) content of clay was found to be above 45% indicates free silica (Quartz) which makes the clay suitable for paper, paint and mid temperature ceramics application. It is however below levels required for refractory and glass as shown in Table 1.
Table 1. Chemical profile of Mgbom clay compared with some standard clays for industrial application [1][4]
|
Oxides |
Refractory bricks |
Glass |
Paper |
Paint |
Mgbom |
|
SiO2 |
51 – 70 |
80- 95 |
45.0- 45.8 |
45.3- 47.9 |
51.21 |
|
Al2O3 |
25 – 44 |
12 – 17 |
33.5 – 36.1 |
37.9 – 38.4 |
24.33 |
|
Fe2O3 |
0.5 – 2.4 |
2 – 3 |
0.3 – 0.6 |
13.4 – 13.7 |
11.42 |
|
CaO |
0.10 – 2.0 |
4 – 5 |
0.03 – 0.60 |
0.03 – 0.60 |
1.41 |
|
MgO |
- |
- |
- |
- |
1.07 |
|
K2O |
- |
|
- |
- |
0.15 |
|
Na2O |
- |
- |
- |
- |
0.02 |
|
TiO2 |
|
|
|
|
0.03 |
Figure 2. Distribution of metal oxides in Mgbom Clay
The Alumina content (27%) of the clay as shown in Figure 2 is below the standard required for mid to high temperature ceramics, refractory, paper, and paints as presented in Table 1. The lower the Alumina content, the lower the coefficient of thermal expansion of ceramic bodies [1]. This may be due to the coupling reaction between Al3+ and K+ in the system [1][7]. Refractory clays need high alumina content. The higher the alumina content of clay the higher its suitability for refractory applications and the higher the refractoriness. The Fe2O3 content below 2% (<2%) means that the clay will fire white and above 2% means the clay fires brown, ox-blood or pink depending on the amount of Fe2O3 and other associated coloring oxides. Value obtained for this clay was above 2% which explains why the clay fired dark purple. Also, the value obtained was higher than 0.5 – 2.4% being permissible limits for refractory bricks [4]. Figure 2 shows a high percentage content of silica, alumina and iron (III).
Physical characterization of Mgbom clay base Ceramics: The changes as a function of temperature of the mechanical parameters are presented in Table 2.
Table 2. Mechanical profile of Mgbom clay compared with some standard clays for industrial applications [4][8]
|
Sample parameter |
Mgbom (at 12500C) |
Refractory |
Ceramics |
Fireclay |
|
Apparent porosity (%) |
5.28 |
10 – 30 |
10 – 30 |
20 – 30 |
|
Water absorption (%) |
2.71 |
- |
- |
- |
|
Apparent Density(g/cm3) |
2.06 |
- |
≤ 2.2 |
≤ 2.2 |
|
Bulk Density(g/cm3) |
1.95 |
≥ 1.8 |
≥ 1.85 |
≥ 1.85 |
|
Modulus of Rupture (KgF/cm2) |
>45.38 |
- |
- |
- |
|
Cold-crushing strength (KN/M2) @ 9000C |
1440 |
1500 |
1500 |
1500 |
|
Modulus of plasticity (%) |
1.23 |
- |
- |
- |
|
Linear shrinkage (%) |
6.01 |
≤ 7 |
≤ 10 |
≤ 8 |
|
Making Moisture (%) @ 300C |
38.15 |
- |
- |
- |
|
Water of Plasticity (%) @300C |
46 |
- |
- |
- |
|
Refractoriness (0C) |
1300 |
≥1500 |
≥1000 |
≥1500 |
Key-Not available
Flexural strength: The plot is shown in Figure 3. Flexural strength increased with increase in temperature. The thermal compaction of the particles may have led to formation of strong uniform bonds which greatly increased the strength. Increase in flexural strength with increase in temperature may be due to increase in the formation of meta-kaolinite from Kaolinite which crystallizes to alumina liberating water as shown in Eq. [10] and with oxides interaction produces mullite and free silica in the form of crystoballite (β-Quartz) as shown in Eq. [11] [9].
Al2O3.2SiO3.2H2O → Al2O3.2SiO3 + 2H2O↑ (10)
(Kaolinite) (Meta-kaolinite) (Water).
Al2O3.2SiO3 → Al2O3 + 2SiO3. (11)
(Meta-Kaolinite) (Alumina) (Silica).
Upon cooling, the thermal rearrangement and formation of new bonds greatly confers strength on the ceramics. Also presence of α-quartz tends to increase the amount of free silica present which melts with increase in temperature to form a uniform dense structure that greatly confers strength on the body.
Figure
3. Flexural strength behavior of Mgbom Clay
Hematite (α- Fe2O3) is a strong low temperature secondary flux which presence in the clay reduces the melting and vitrification temperature of the glass formers in the ceramic matrix forming a uniform crystalline layer that increases the strength of the ceramics when cooled to ambient temperature.
Linear Shrinkage: The plot for linear shrinkage is shown in Figure 4.
Figure 4. Linear shrinkage (L.S) of Mgbom Clay as a function of temperature
It shows an increase in L.S. with increase in temperature. The value obtained was below the internationally accepted value of 7 – 10% recommended for linear shrinkage for refractory clays [10][11] as shown in Table 2.
The low shrinkage value may suggest the absence of organic impurities in the clay. High values of CaO/MgO are also associated with high L.S but combined value obtained (2.48%) as shown in Table 1 is considered not significant to cause a major alteration in the L.S of the clay. Also the high composition of quartz in the clay as shown in Figure 1 may reduce any possible tendency for the ceramics made from this clay to suffer linear shrinkage since it’s a non expansive material due to the strength of the Si – O bond. Fireclays have a recommended range of 4 – 10% [10][12]. High shrinkage values are not desirable as it causes cracks due to body compression and consequently a change in the bulk volume [1].
Apparent Porosity: The variation in the apparent porosity with temperature is shown in Figure 5.
Figure 5. Apparent porosity and water absorption behavior of Mgbom clay
The decrease in porosity with increase in temperature indicates the closure of pores. Low values of porosity suggest low organic or combustible materials in the clay which burns off at elevated temperatures creating pores and perforations in the body. The higher the perforations, the higher the apparent porosity. Values obtained were considered too low for refractory and high temperatures application and thermal insulation but suitable for electrical insulation, low to mid temperature ceramics application, glazes and sanitary applications. Very low porosity encourages the entrapment of gases which can cause cracks on the ceramics or pin-holing if used as a glaze material. The low porosity also means poor thermal shock. When desired like in refractory and water filter candle applications, porosity is created by the addition of diatomite or organics such as rice husk, saw dust and other readily available agricultural wastes.
Water Absorption: Water absorption measures the amount of water the sample is likely to retain in its body matrix. The plot is shown in Figure 5. The plot shows a decrease in water absorption with increase in temperature from 9000C to 12000C which is due to the thermal compression of the particles together to replace the holes created by the ejection of air, water and combustible materials. The value obtained for the clay falls within the recommended value of 2.6-2.73% [11]. The lower the water absorption, the better the body for sanitary and culinary applications [1]. Where higher permeability to water is desired, increasing the apparent porosity will also increase the water absorption.
Bulk Density: B.D generally increases with increase in compaction. The variation in the B.D is shown in Figure 6.
Figure 6. Apparent density and bulk density of Mgbom clay
The value as shown in Table 2 was within the internationally accepted range of 1.7 – 2.1g/cm3 for building and fireclays [13]. The increase in B.D with increase in temperature is due to increase in compression which forces the particles together and closure of pore spaces. Also interaction of α-quartz with fluxing oxides which forms crystoballite and mullite creates an impervious glassy phase which helps to seal up the pores and increase the B.D.
Apparent density: A.D is the mass divided by its apparent volume. A.D accounts for the volume of closed pores as well as open pores. Figure 6 shows the response of A.D to variation in temperature. A.D showed a decrease with increase in temperature. Value obtained at 12000C as shown in Table 2 is indicative of very compact body. The smaller the value for A.D, the more compact the ceramics/body. Value of 2.06 is below the range of 2.3 – 3.5g/cm3 being the internationally accepted standard range [14]. This suggests that the temperature used is not ideal for production of earthenware ceramics using this clay. Low to mid temperatures like 10000C – 11500C would be more ideal if A.D within the accepted standard value is to be achieved. As temperature increases, compression of particles occurs as organics, entrapped gases and liquids are evicted. Also other thermally unstable non-fuse able components are either decomposed or ejected creating holes or pores which increase the A.D. As the spaces are closed up and particles forced together, the A.D will decrease. This compaction will impact on the bulk density which will increase with decrease in A.D as shown in Figure 6.
Refractoriness: Value obtained clearly shows that the clay is not suitable for refractory application as contained in Table 2. Clays considered suitable must have refractoriness of ≥15000C but value obtained for this clay was well below the stated limit. The low value is due to the effect of inorganic impurities found at elevated amount which acts as fluxing oxides on the Si – O, Al – O and Al – Si bonding. The presence of CaO, MgO, K2O and Fe2O3 which are all very strong fluxes interact with Si and Al in the clay matrix at red heat pulling down the vitrification temperature of the body to a temperature too low for refractory applications. Also table 1 shows the Alumina content of the clay to be <25% and the range of Al2O3 content of clays suitable for refractory is ≥ 25%. The higher the alumina contents of clay, the better its suitability for refractory applications.
Cold Crushing Strength: CCS represents the maximum load per unit area that a product will withstand before failure occurs at room temperature under compressive and specified conditions. Value obtained at 9000C was 1440 KN/M2 which is below 1500 KN/M2 standard for refractory, fireclays and high temperature Ceramics applications. This also implies that the resistance to abrasion will be below requirements for these applications. The higher the cold crushing strength, the higher the resistance to abrasion and vice versa. The resistance to slag attack will also be below the standard for refractory, electrical and thermal insulation and other high temperatures ceramics application. This is because its been observed that the higher the CCS of materials, the higher the resistance to slag attack.
Making Moisture: M.M is the measure of the amount of liquid (water) added to achieve plasticity of clay. It is a green test which gives information on the strength and plasticity of the clay. It is however affected by the amount of water used to achieve mouldability [1]. The high the value of M.M, the higher the elasticity and the tendency to expand and vice versa. Low values of M.M means that a clay is short and also not expansive. Shortness of clay is due to elevated levels of siliceous materials, low levels of organic and inorganic impurities and large particle sizes. Value obtained was 38.15% which classifies the clay as expansive and plastic.
Modulus of plasticity: The closer the value to unity, the stronger the clay at green and fired stage. It is the ratio of the initial height to the deformed height. This test gives information on the workability and also green strength of the clay [1]. The value for the clay was 1.36, which is ≤ 1.4 which has been the observed limit for strong and expansive clays.
Water of Plasticity: Amount of water required to bring dry clay to its state of ideal plasticity. The higher the amount of water needed, the finer the particle size, the more plastic and expansive the clay, and the greater the wet- dry shrinkage and by implication the higher the total shrinkage of the clay.
Figure 7 is the X-ray diffraction plot of the sample. Three major minerals are seen as the major component of the clay. They include quartz, kaolinite, and hematite. Hematite is the mineral form of iron (III) oxide (Fe2O3).
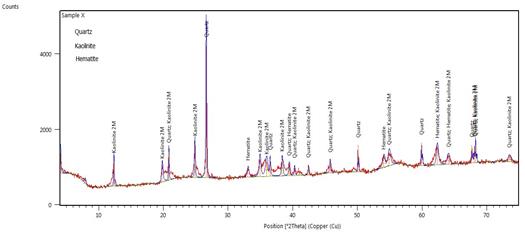
Figure 7. XRD spectra of Mgbom Clay
Hematite crystallizes in the rhombo-hedral system and it has the same crystal structure as limonite and corundum. This mineral can be considered as trace mineral, thus the inhalation of such small grain sized iron bearing mineral (hematite) along with other minerals will create lung disease, because the particles are coated in the surface of lungs.
Kaolinite - also includes dickite and nacrite; formed by the decomposition of orthoclase feldspar (e.g. in granite) with kaolin as the principal constituent. Kaolin is a dioctahedral 1:1 layered clay mineral that contains 10–95% of the mineral kaolinite [15].
The structure of kaolinite is a tetrahedral silica sheet alternating with an octahedral alumina sheet. These sheets are arranged so that the tips of the silica tetrahedrons and the adjacent layers of the octahedral sheet form a common layer [16].
The molecular formula that is common for the kaolinite group (kaolinite, nacrite, dickite) is Al2Si2O5 (OH)4 [15][17].
Quartz, or α-quartz, is the mineral form of SiO2 stable at low temperatures and pressures. It occurs in igneous, sedimentary, metamorphic, and hydrothermal mineral environments, particularly in continental regions. The structure is acentric, and occurs in both left and right-handed varieties piezoelectric and pyroelectric. Quartz accepts only very limited amounts of other elements in substitution under extreme conditions of temperature and pressure. Polymorphs include β-quartz, tridymite, cristobalite, coesite, stishovite, and keatite.
SEM analysis
The micro-structural observation of the clay surface shows a finely distributed uniform surface with isolated patches of granulated texture as shown in Figure 8.
|
(A) |
(B) |
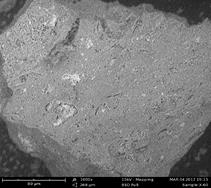
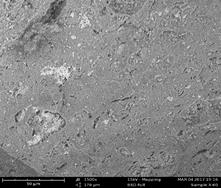
Figure 8. SEM of Mgbom Clay (A) 50 µm (B) 80 µm
The microstructure shows the occurrence of finely distributed grains, high contact surface and consequently, decreases in porosity and water absorption [1].
The surface also reveals the absence of numerous clay minerals and inorganic impurities in the matrix. No bundle of needle-like structure or crystals with lath shape morphology was observed.
FTIR analysis
Figure 9 shows the spectra of the Clay.
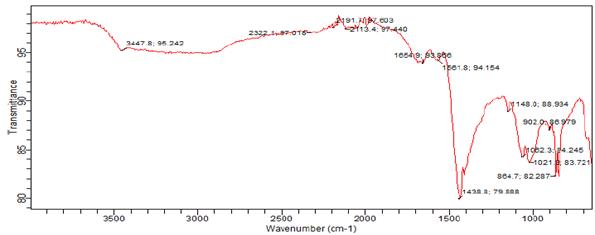
Figure 9. FTIR spectra of Mgbom Clay
Summary of the spectra is shown in Table 3.
Table 3. FTIR values of Mgbom Clay
|
Peaks |
Functional groups |
|
583.71 |
Fe – O stretching of Hematite |
|
864.7, 902, 1062.3, 1021.3, 1148, 1438. |
Si – O stretching |
|
1438, 1561.8 |
CO32- internal vibration mode of Carbonates |
|
1654.9 |
OH- deformation |
|
2113.4, 2191.1, 2322.1 |
C ≡ C of alkynes |
|
3447.8 |
OH- vibration consistent with Phyllosilicates |
The clay shows absorptions at 1654.9 cm-1 which is –OH bending vibration. The stretching vibrations for Si – O were observed at 864.7, 902, 1062.3, 1021.3, 1148, 1438 cm–1 showing the presence of Quartz.
The band at 2467.6 is consistent with OH- stretching [18][19]. The presence of absorption frequencies of 902 cm-1, 1654.9 cm-1, 3447.8 cm-1 shows the presence of kaolinite in the clay. The frequency at 583.71 cm-1 is due to Fe – O stretching suggesting the presence of hematite in the clay. This is supported by the elevated level of Fe2O3 shown in the chemical analysis of the clay. V
ibrational frequency at 1438 and 1561.8 cm-1 are due to CO32- of Carbonates. Bands at 2113.4, 2191.1, 2322.1 cm-1 are attributed to C≡C of alkynes showing the presence of organic Carbon. The differences observed in some of the vibrational bands when compared with data available in literature may be due to factors such as interference of kaolinite by overlap of other clayey mineral presenting characteristic vibrational bands in these spectra and substitution of free Fe in the structure of the octahedral sheet of kaolinite [15].
Conclusion
The results obtained shows that, the clay contains three major minerals which are Quartz, Kaolinite and Hematite. Chemical profile shows high amount of silica but the involvement of other fluxing oxides has limited the application of this clay to only earthenware, low-temperature ceramics and glazes where Fe2O3 is desired.
Fired behavior of the clay shows it is unsuitable for refractory, thermal insulation, porcelain, electrical insulation and culinary applications.
The SEM study show a finely distributed uniform surface with isolated patches of granulated texture which explains the physical behavior of the clay.
References
1. Ituma C.G., Etukudoh A.B., Abuh M.A., Akpomie K.G., Obioha C.I., Utilization of Nkpuma-Akpatakpa clay in ceramics: characterization and microstructural studies, J. Appl. Sci. Environ. Manage, 2018, 22 (1), p. 47-53.
2. Etukudoh A.B, Akpomie K.G, Okereke O.C.B, Abuh M.A., Effect of cassava peel on the insulating properties of Ogugu clay deposit, International Journal of Advanced Engineering Research and Technology (IJAERT), 2016, 4 (8), p. 273 – 280.
3. Abuh M.A., Abia-Bassey N., Udeinya T.C., Nwannewuihe H.U., Abong A.A, and Akpomie K.G., Industrial potentials of Adiabo clay in Calabar municipal of cross river state, south-south Nigeria, Pacific Journal of Science and Technology, 2014, 15 (1), p. 63-75.
4. Abubakar I., BirninYauri A., Faruq U.Z., Noma S.S., Sharif N., Characterization of Dabagi clay deposit for its ceramics potential, Afr. J. Environ. Sci. Technol., 2014, 8 (8), p. 455 – 459.
5. Elueze A.A., Ntekini E.E., and Ekwere J.J., Compositional and industrial assessment of clay bodies in Itu Area, South Eastern Nigeria, Journal of Mining and Geology, 1999, 35 (2), p. 117-124.
6. Fakolujo O.S., Olokode Y., Aiyedun P.O., Oyeleke Y.T., Anyanwu B.U., Lee W.E., Studies on the five (5) selected clays in Abeokuta, Nigeria, Pacific Journal of Science and Technology, 2012, 13 (1), p. 83 – 89.
7. Farmer V.C., Infra–red spectroscopy in clay mineral studies, Clay Minerals Journal, 1968, 7, p. 373-382.
8. Omowunmi O.J., Characterization of some Nigerian clays as refractory materials for furnace lining, Niger, Found. of Eng Manage, 2000, 3, p. 1 – 4.
9. Anih L.U., Indigenous manufacture and characterization of electrical porcelain insulators, Nigerian Journal of Technology, 2005, 24 (1), p. 1 – 7.
10. Irabor P.S.A., Physical and chemical investigation on some Nigerian kaolinite clays for use in the ceramics and allied industries, Nigerian Journal of Engineering Research and Development, 2002, 1 (1), p. 54-59.
11. Benneth C.C., Settling behavior of kaolinite clay in the absence of flocculates, Pacific Journal of Science and Technology, 2008, 9 (1), p. 21-28.
12. Ekosse G.E., Fourier transform infrared spectrophotometry and X-Ray powder diffractometry as complementary techniques in characterizing clay size traction of kaolin, J .Environ Sci., 2011, 23 (3), p. 404-411.
13. Abolarin M.S., Olugboji O.A., and Ugwuoke I.C., Experimental investigation on local refractory materials for furnace construction, Proc. of 5th Ann. Eng. Conf., Federal University of Technology: Minna, Nigeria, 2004, p. 82-85.
14. Adelabu S.O., Documentation, application and utilization of clay minerals in Kaduna State Nigeria, Intech: http://dx.doi.org/10.5772/48093, 2012.
15. Aroke U.O., El-Nafaty U.A., Osha O.A., Properties and characterization of kaolin clay from Alkaleri, North-Eastern Nigeria, International Journal of Emerging Technology and Advanced Engineering, 2013, 3 (11), p. 387 – 392.
16. Zoltan A., Jozsef F., Environmental health criteria 231 (EHC 231): Bentonite, kaolin, and selected clay minerals, World Health Organization, Geneva, 2005.
17. Christopher B., Nigel D. and Jack Y., The thermal stability of mixed phenylphosphonic acid/water intercalates of kaolin and halloysite, A TG–EGA and VT-DRIFTS study, J. Mater. Chem., 2002, 12, p. 273–278.
18. Njoya A., Nkoumbou C., Grosbois C., Njopwouo D., Njoya D., and Courtin-Nkoumbou A., Genesis of Mayouom kaolin deposit (Western Cameroun), Appl. Clay Sci., 2006, 32, p. 125-140.
19. Ojo O.J., Suraj A.A, Adewole T.M., and Abiola A.O., Sedimentological and geochemical studies of Maastrichtian clays in Bida basin, Nigeria: Implication for resource potential, Center point Journal (Science Edition), 2011, 17 (2), p. 71 – 88.