Engineering, Environment
Comparison of some physical and mechanical properties of Nigerian local soybean and cowpea
Sunday Emmanuel KAYODE 1, Bayode Julius OLORUNFEMI *2,
1Department of Agricultural and Environmental Engineering, Federal University Technology, Akure, Nigeria
2Department of Mechanical Engineering, Federal University, Oye-Ekiti, Nigeria
E-mail(s): kaysunny451@yahoo.com1; bayode.olorunfemi@fuoye.edu.ng2
* Corresponding author, phone: +2348036061994
Received: July 29, 2018 / Accepted: October 29, 2018 / Published: December 30, 2018
Abstract
The objective of this work was to compare the physical and mechanical properties of two leguminous crops (soybean and cowpea). The experiment was conducted at various moisture contents. The physical and mechanical properties of soybean and cowpea determined includes shape, size, density, weight, volume, hardness, moisture content, coefficient static friction, hardness, compressive and shear strength. To determine the mechanical properties, compression and three-point bending tests were conducted at 2.5 mm/min. The average length, width, thickness, volume and density were 10.539 ±0.561 mm, 7.361±0.370 mm, 4.874 mm, 0.460±0.010 cm3 and 2.210±0.060 g/cm3 respectively for cowpea and 7.350±0.362 mm, 6.154±0.328 mm, 6.033±0.311 mm, 0.237±0.006 cm3 and 1.743±0.101 g/cm3 which were also compared. It was observed that, by increasing moisture contents of soybean and cowpea, geometric mean diameter, sphericity, true density and angle of repose had an upward increment, whereas their bulk densities decreased. The average fracture force and energy obtained by compression test at vertical, horizontal and minor loading were 102.300 N, 57.800 N and 59.200 N respectively for soybean, and 100.8 N, 56.4 N and 57 N respectively for cowpea. It was observed that more energy is needed to break the soybeans compare to the cowpea at three points loading.
Keywords
Cowpea; Grains; Mechanical properties; Moisture content; Physical Properties; Soybean
Introduction
Handling and transportation of leguminous crops remains a major problem in agricultural production because of their difference in shape, size, hardness, texture etc. Inappropriate ways of dealing with these leguminous crops has led to destruction and wastage of these materials. Hence, there is need to understand the difference in behaviour and properties of leguminous crops and comparing them to aid in maximum use of them and in choice of equipment selection for their handling, transportation and processing.
Understanding the differences in their properties helps in designing better equipment and machine for transportation, processing and handling of those agricultural materials [1] Soybean (Glycine Max) and cowpea (Phaseolus Vulgaris) are agricultural materials that serve as food to both man and livestock and also serve as by-products use in manufacturing industries.
The largest production of cowpea is in the moist and dry savannah of Sub-Saharan Africa (SSA), where it is intensively grown as an intercrop with other cereal crops like millet, sorghum and maize as well as rice fallows [2]. Though it is grown in other part of the world, Nigeria remains the largest producer and consumer of cowpea in the world. Figure 1 is a pictorial view of Nigerian soybean.
According to FAO data (2001-2010) [3], Nigeria produces an average of 2.58+/- 0.31 million metric tonnes.
The nutritional value of cowpea is in the composition of its grain. The grain is rich protein up to 30% in some varieties. In addition, the grain contains micronutrients such as iron and zinc which are necessary for healthy living [4].
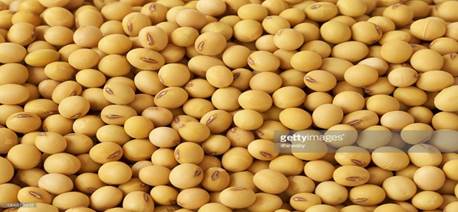
Figure 1. Pictorial view of a Nigerian Soybean [1]
Soybean (Glycine max L) is a leguminous crop and the world’s foremost provider of vegetable protein, oligasacharies, dietary fibre, phytochemicals (especially isoflavones), and minerals [5]. Soybean is included in the category of oilseed, which is a generic reference to crops with seeds that can produce edible and/or non-edible oil in economic quantities [6]. Soybeans can be grown in a wider variety of soil and climatic conditions than any other major world crop.
Consequently, soybeans are the most widely grown oilseed in the world. Nutritionally, soybeans contain significant amounts of phytic acid, and B Vitamins. Soybean seeds can be used to make flour and dairy substitutes such as milk, margarine and yogurt and meat substitutes such as veggie burgers. Soybean protein is equivalent in quality to animal protein [7]. Oil can be extracted from both the seeds and pods and the by-product of the extraction is used as an animal feed. The oil from the plant is used in products such as paint, linoleum and soap. Soybean is also grown as a cover crop and used as animal fodder or hay [8]. Figure 2 is a pictorial view of a Nigerian Cowpea.
. 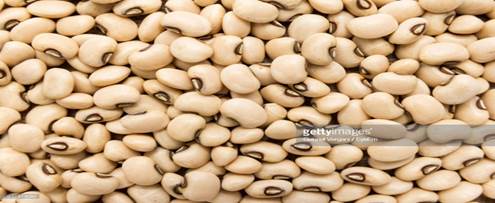
Figure 2. Pictorial view of a Nigerian Cowpea [1]
Recent works have revealed that cowpea has promising potential as feedstuff for poultry. Its incorporation in animal diets has reduced the cost/kg of feed and improved growth and production parameters [9, 10, 11]. However, the utilization of some species of cowpeas was limited by the presence of antinutritional factors that negatively affect poultry performances.
On the alternatives] soybean meal, as the primary and most dependable protein source for poultry feed, is becoming progressively expensive [12].
As a result of high cost of ingredient used in poultry production, using low price ingredient is advocated for to reduce the cost of production. It is therefore, necessary to search for readily available local feed materials to replace imported protein sources during period of soybean shortage [4].
Among the potential sources of plant protein, grain legumes like cowpea could be good alternatives to soybean meal because they are known to have a similar amino acid profile [10, 13]. Affordability of the most legumes seed as plant protein sources compared to animals ones can encourage their utilization in feeding animals and poultry especially in the present economic undertone in developing countries [14].
It is important to determine the physical and mechanical properties in order to enhance mechanization of both their planting and harvesting operation and hence the operation involve in their processing. Information on physical and mechanical properties of agricultural products (soybean and cowpea) is needed in designing and adjustments of machines used during planting, harvesting, separating, cleaning, handling and storing of agricultural materials and converts them into food, feed and fodder.
The properties which are useful during design must be known and determined at laboratory conditions and compared [15]. The wide variation in the engineering properties of legume varieties suggest possible applications for various end-use products [16].
The mechanical properties such as hardness, compressive strength, impact and shear strength and the rheological properties affect the various operations of agricultural processing.
The development of satisfactory harvesting and processing method are greatly influenced by the mechanical properties of the product. Mechanical properties of the agricultural products are mostly conveniently measured with the force-deformation curve. [17].
Measured physical characteristics of soybean at different moisture content includes dimension, true and bulk densities. Consideration is also given to other characteristics such as porosity and density as the main parameters as well as the static coefficient of friction of soybean.
Material and method
Samples preparation and procurement
The seed materials used for this research work were cowpea (Phaseolus Vulgaris), and Soybeans (Glycine Max) seeds. These grains were obtained from three geo-political regions (North, Western and middle belt) in Nigeria. Laboratory equipment used included measuring cylinder, weighing balance, micro meter screw gauge, sliding machine, vernier caliper, dryer, universal testing machine. In order to determine 1000-unit mass (m1000), fifty (50) grains were selected randomly and weighed. True-density (Td), bulk-density (bd) and volume (V) were determined by use of displacement in liquid method.
Physical properties measurement
The physical properties such as length (L), width (W), thickness (T), mass (M), volume (V), true density (ρp), bulk density (ρd), depth of product (Dp), geometrical mean diameter (Dg), sphericity (f), porosity (p), and surface area were measured using vernier calliper, weigh balance and measuring cylinder [18].
Size and sphericity
The method of random sampling similar to the one used by Dutta et al [19] was used for seeds. Three principal dimensions namely; length, width and thickness were measured using a micro-screw gauge and vernier calliper (least count of 0.01mm) for the geometric mean diameter (Dc) and sphericity (f).
Sphericity is presented in Eq. [1].
(f) = ![]() (1)
(1)
Eq. [1] was proposed by Mohsenin [20] for the calculation of Sphericity,
Where: f - sphericity, L - length of the seed, W - width of the seed, T - thickness of the seed.
Geometric dimension
Geometric dimensions and mass of the soybean and cowpea seeds were measured by vernier caliper and digital weighing balance with accuracy of 0.001 mm respectively at different moisture content. By use of those three dimensions, geometrical mean diameter (GMD), sphericity (f) and surface area (S) of cowpea and soybeans were obtained in Eq. [2].
S = ![]() 2 (2)
2 (2)
Where: S - surface area (cm2).
DP was the geometric mean diameter, which was calculated using the relationship by Eqs. [3-4].
DP = (LWT) 0.03 (3)
Where: L- length (m), W- width (m), T- thickness (m).
S = ![]() 2 (4)
2 (4)
The above equations were proposed by Mohsenin [20].
True density and bulk density
True density (ρp) was determined by toluene displacement method as indicated with Eq. (5), and bulk density (ρb) was also determined using Eqs. [5-6] [10].
(ρp)![]() (5)
(5)
(ρb)![]() (6)
(6)
Where: ρp - true density, ρb - bulk density.
Porosity
The percentage void of an unconsolidated mass of material such as grain, silage, hay and grain can be determined by porosity tank method [21].
Porosity affects the angle of internal friction and the dynamic angle of repose. Materials with high values of porosity have high values of angle of friction and angle of repose. Porosity depends on the shape, dimension and roughness of the material surface. Porosity, which is also known as packing factor ‘PF’ may be calculated by using the relationship as given by Eq. [7].
Porosity = {![]() }
(7)
}
(7)
Volume and density
The volume of soybeans and cowpea seeds were obtained using water displacement method. A measuring cylinder of 100 ml was used; by dropping the grain in the measuring cylinder filled with a known volume of water which is equal to its own volume following Archimedes principle. The volume was then read directly from the cylinder. The average volume of the grains was then determined. The grains were initially weighed on the digital weighing balance to obtain their average mass. The density which is referred to as particle density in product is mass per unit volume is obtained from the Archimedes principle equation.
Weight
This was carried out by weighing the seeds on a precision digital weighing balance; reading to 0.01 (g) calibrations. The experiment was carried out at room temperature.
Angle of repose
The angle of repose was determined by using a special tilting table fabricated in the department of Agricultural Engineering used along with a topless and bottomless box of dimension 150 x 100 x 20 mm3 filled with cowpea and soybeans seeds and places on the adjustable tilting surface or inclined plane apparatus (Figures 1). The stainless steel, ply wood, galvanized, was place after the other and the experiment was repeated ten times to find the mean value of the repose angle. Allowing the seeds to flow and assumed a natural slope. The dynamic angles of repose of loosely packed materials are normally higher than those of closely packed material. Angle of repose and frictional properties of the agricultural materials play an important role in selection of design of hoppers, storage bins and other equipment like grain extractor. According to Herderson et al [22], determination of angle of repose is given in Eq. [8].
F = μtan QR (8)
Where: F - angle of repose, µ - coefficient of static friction.
Therefore, the coefficient of static friction could be calculated by Eq. [9].
µ=![]() (9)
(9)
Coefficient of static friction
The coefficient of static friction of soybeans and cowpea seeds were determined in respect to four surfaces, which are plywood, mild steel, stainless steel and glass using the inclined plane apparatus. The table was gently raised and the angle of inclination to the horizontal at which the seeds started sliding was read (Figure 3) off the protractor attached to the apparatus. The coefficient of static friction was calculated as the tangent of this angle. Some researchers used similar method in determining angle of repose [23, 24].

Figure 3. Tilting box [1]
Moisture content
The moisture content (MC) of Soybeans and Cowpea seeds were obtained as shown in Eq. [10]. The ratio of the weight of water present in the seeds to the dry weight of the seeds.
MC =![]() (10)
(10)
The direct method was used, that is the oven dry method. The initial weight of the seeds were weighed and known, the weight of the can was also weighed and known, then the seeds and the can were placed in the oven at a temperature of 750C: for 16 hours to get the first moisture content. The seeds were then dried for 24 hours at the same temperature of 1050C. The moisture content was recorded. The third moisture content of the seeds was also determined after oven- dried for 48 hours at the same temperature of 1050C [20].
Measurement of mechanical properties
A Testometric machine (Model 1186) equipped with a 5000N compression load was used to carry out the mechanical properties of soybean and cowpea at vertical, horizontal and minor axis (Figure 4).

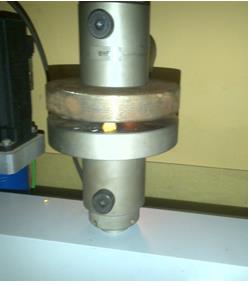
Figure 4. Testron machine with seed placement [1]
A compression test was performed on the seeds using the Monsanto Universal Testing Machine. Testing Conditions for the Testron machine were loading range: 0.0-5000 N with chart speed of 25 mm/min. Each seed was placed between the compression plates of the machine. The seed was compressed at a constant deformation rate of 1.25 mm/min. The applied forces at bio-yield and their corresponding deformation for each seed samples were read directly from the force deformation curve. The mechanical behaviour of the seed was expressed in term of force required for maximum strength of the seed, energy required to deform the seed to initial rupture and seed specific deformation. The rupture force was determined as the force on the digital display when the seed under compression made a clicking sound. Each process was completed whenever the break point of the positioned seed was reached. The mechanism of loading of material is shown in Figure 5.

Figure 5. Mechanism of loading of materials
The maximum shear strength is expressed by Eq. [11] below;
ds S= ![]() (11)
(11)
Where: ds S - maximum shear strength, Fmax - maximum Force, A – area.
The indices that determine the compression behaviour of plant materials are modulus of elasticity and compression energy. The linear portion of the force-displacement curve is used to determine the modulus of elasticity in compression, which is given by Eq. [12];
sc = ![]() (12)
(12)
Where: sc - modulus of elasticity in compression, Fc - compression force, (N), ÑL - transverse deformation due to compressive force, d - diameter of the grain at the point of compression (m).
Results and Discussion
Physical properties
The length, thickness, width, density, geometric mean and volume of soybeans and cowpea were affected by the different moisture levels present in the materials (soybeans and cowpea) (Figure 6).
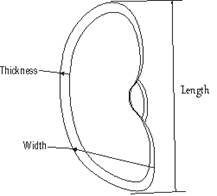
Figure 6. Length, breadth and thickness of soybeans and cowpea
Coefficient of friction
The result of mean for coefficient of friction has shown in Table 2.
Table 2. Result of mean values for coefficient of friction of maize, rice, cowpea and soybeans on plywood, stainless steel, mild steel and glass
|
Material |
Soybeans |
Cowpea |
|
Wood |
0.330 |
0.456 |
|
Stainless Steel |
0.581 |
0.637 |
|
Mild Steel |
0.485 |
0.606 |
|
Glass |
0.300 |
0.309 |
Mechanical property test
Compression on soybean and cowpea was determined using testron testing machine. The materials were loaded in three axes, the material was placed horizontally, vertically and on minor axis between the testron machine plate, hence the force is applied to cause fracture from which the force at peak, deflection at peak, strain at peak, force yield, deflection yield, strain yield, force yield, deflection at yield and strain (Table 3).
Table 3. Mean value for mechanical properties of soybeans and cowpea obtained at three-point bending test
(a) Axial loading compression test
|
Materials |
Force @ peak (N) |
Def. @Peak (mm) |
Strain @Peak (%) |
Force @Yield (N) |
Def. @yield (mm) |
Strain@ Yield (%) |
Def. @Break (mm) |
Strain @Break |
|
Soybeans |
59.200 |
0.387 |
4.248 |
37.800 |
0.274 |
2.325 |
0.595 |
8.749 |
|
Cowpea |
57.000 |
0.226 |
3.464 |
36.800 |
0.100 |
1.5527 |
0.426 |
6.524 |
(b). Vertical loading compression test
|
Materials |
Force @ peak (N) |
Def. @Peak (mm) |
Strain @Peak (%) |
Force @Yield (N) |
Def. @yield (mm) |
Strain@ Yield (%) |
Def. @Break (mm) |
Strain @Break |
|
Soybeans |
102.300 |
1.201 |
11.043 |
35.810 |
0.169 |
1.150 |
1.745 |
15.697 |
|
Cowpea |
100.800 |
1.113 |
10.357 |
35.600 |
0.102 |
0.953 |
1.556 |
14.486 |
(c). Horizontal Loading Compression Test
|
Materials |
Force @ peak (N) |
Def. @Peak (mm) |
Strain @Peak (%) |
Force @Yield (N) |
Def. @yield (mm) |
Strain@ Yield (%) |
Def. @Break (mm) |
Strain @Break |
|
Soybeans |
57.800 |
1.156 |
8.054 |
23.010 |
0.662 |
1.166 |
1.064 |
10.285 |
|
Cowpea |
56.400 |
0.589 |
7.385 |
21.800 |
0.084 |
1.050 |
0.753 |
9.443 |
Comparing the effects of moisture content on length, width, thickness and geometric diameter on soybeans and cowpea
The variations in length, width, thickness and geometric diameter of soybeans and cowpea are in respect with moisture content. All dimensions increase with the grains moisture content up to 26% moisture content. Beyond 26% moisture content, there is no appreciable dimensional change.
The grain probably retain some tiny air voids as they absorb water and these are replaced water, beyond 26% moisture content there making sphericity of soybeans to increase linearly with grain moisture content up to 25% (db). In Figure 6, the grain displayed no dimensional changes.
The grains surface area increases with increasing moisture content, however, it was found that the surface area of soybeans increase linearly with grain moisture content. The sphericity decreases with increasing moisture content up to 26% and shows no increase with moisture content beyond this. Figure 7 shows the variation of bulk density with moisture content.
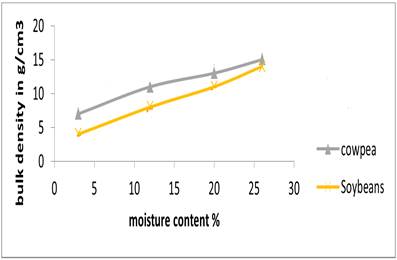
Figure 7. Variation of bulk density of grains with moisture contents
Comparing the coefficient of static friction in soybeans and cowpea
The static coefficient of friction for soybeans and cowpea determined with respect to stainless, glass, plywood and galvanized sheet surfaces increased with increasing moisture content. The coefficient of friction at all moisture contents considered is highest on plywood followed by galvanized iron and stainless steel. The mean coefficient of friction of Soybeans and cowpea has shown in Table 2. The grains also become rougher and possibly, sticker on the surface as the moisture content increases, making the coefficient of friction increased.
The coefficient of soybeans is seen higher in mild steel than cowpea due to the glittering outer layer of the soybeans. But in other materials (wood, stainless steel and glass), cowpea is higher than soybeans. Figure 8 shows the variation of true density with moisture content. Increase in moisture content of the grain, increases the weight hence increases the true density of the material.
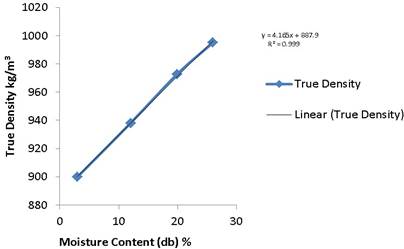
Figure 8. Variation of true density of with moisture content
Increase in moisture content of the grain, increases the weight hence increases the true density of the material.
Figure 9 also showed that increase in water content of the grain increases the porosity of the grain.
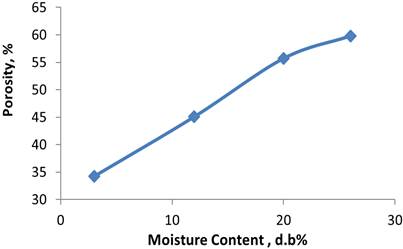
Figure 9. Variation of grain porosity with moisture content
Increase in moisture content of the grain increases the porosity of the grain.
Figure 10 also showed the variation of coefficient of static friction with grains.
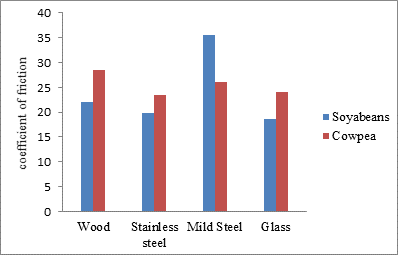
Figure 10. Variation of coefficient of static friction with grains
The grain becomes rougher and possibly stickier on the surface as the moisture content increases, hence increases the coefficient of static friction.
Angle of repose
The angle of repose for soybeans and cowpea determined with respect to stainless, plywood and mild steel and glass sheet surfaces increased with increasing moisture content. The angle of repose increases with increase in coefficient of friction and grain moisture content. The variation is similar to that of Frazier [1, 24] for cumin seeds and [15] for guna seed, however, exhibit a linear increase in angle of repose with increase in moisture content.
The differences could be due to difference in the surface roughness of grain as they get wet. Angle of repose is a useful parameter for optimum design of hoppers. The inclination angle of hopper wall should be larger than the grain angle of repose to ensure the continuous flow of grain by gravitational force at yield, force at break, deflection at break, strain at break were determined
Mechanical properties
Figures 11-16 shows the graph of soybeans and cowpea at different loading.
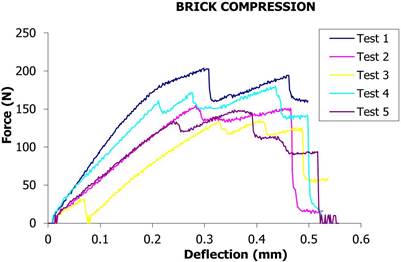
Figure 11. Compression test on soybean grains seed when placed vertically
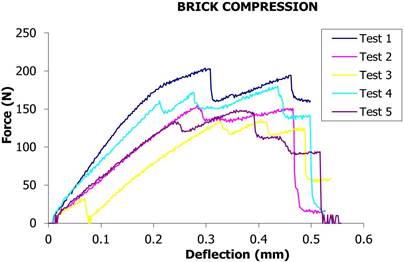
Figure 12. Compression test of five (5) sample of soybeans grains seed horizontally
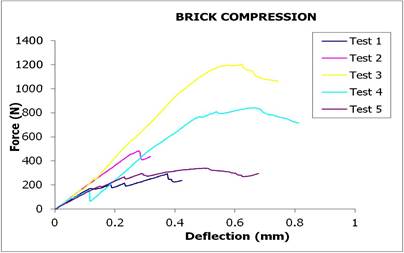
Figure 13. Compression graph of axial loading of soybean
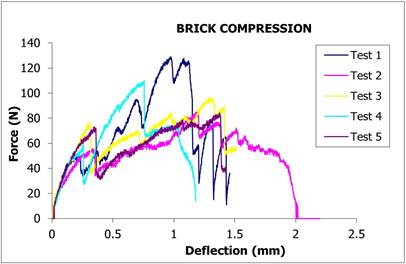
Figure 14. Compression test graph for cowpea when placed vertically
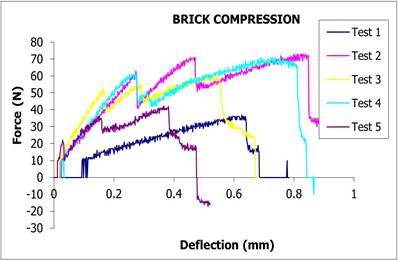
Figure 15. Compression graph for horizontal loading in cowpea seed
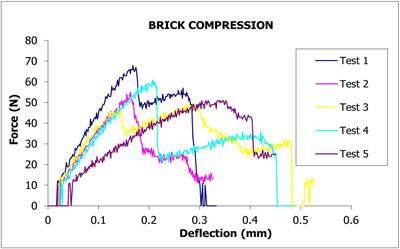
Figure 16. Compression graph of axial loading of cowpea
Comparison of mechanical properties of soybeans and cowpea
Mechanical properties of soybeans and cowpea were known by subjecting them to compression. Compression is the act of determining the behaviour of materials under a compressive load. Compression tests were conducted by loading the test specimen between two plates and then applying a force to the specimen by moving the crossheads together.
The compression test was used to determine elastic limit, proportionality limit, yield point, yield strength and compressive strength. The force- deformation characteristics are exhibited by the grains under compressive loading force front. The most important of the compressive curve was the first local maximum point, which was selected as the rupture force. There was a decrease in the force after rupture occurred in the specimen and this point was denoted as the rupture point. Compression on crops was determined using testron testing machine. The materials were loaded in three axes, The material is placed horizontally, vertically and on minor axis between the testron machine plate, hence the force is applied to cause fracture from which the force at peak, deflection at peak, strain at peak, force yield, deflection yield, strain yield, force yield, deflection at yield and strain (Table 3).
In this research, five tests were carry out on soybeans and cowpea at three different loading; vertically, horizontally and axially. The graph shows five different lines, with each line representing result graph for each seed. From the result, more energy is needed to break soybeans compare to cowpea during processing or transformation of the material to another form. The harness nature of soybeans is probably as a result of the coat which makes it hard for penetration of water when soaked.
None of mechanical properties obtained by three-point bending test were significantly affected when MC was increased from 12 to 16% (w.b). Hence, the mean values of fracture force, fracture energy, specific fracture energy and bending strength were 21.43N, 4.13 J × 10-3, 339.54 Jm-2, and 20.43 MPa, respectively at the range of MC (12% to 26%, w.b).
Conclusions
This work was focused on some physical and mechanical properties of soybeans and cowpea based on the results and discussion of my experiment the following conclusions could be made: all the dimensions of soybeans and cowpea increased with increase in moisture content. The length, width, thickness, arithmetic mean diameter, and geometric mean diameter of the maize, soybeans, beans and rice increased linearly with increase of moisture content. The 1000-seed mass increases linearly with increase in moisture content.
Sphericity, volume, and surface area increased linearly with increase in moisture content. True density was higher than bulk density at all grains moisture content studied. Bulk density slightly decreased linearly with increase of moisture content but the true density porosity increased with increase in moisture content. The angle of repose and static coefficient was highest for wood, followed by galvanized and stainless for the material tested. The load-deflection behaviour for the soybeans and cowpea was presented. Compressive load at rupture and at yield depend largely on contact area, that is the largely the contact area, the smaller the load applies to it.
References
1. Kayode S.E., Olorunfemi B.J., Soyoye B.O., Determination of engineering properties of some Nigerian local grain crops, International Journal of Agricultural and Bio-systems Engineering, 2018, 3 (1), p. 10-18.
2. Ishiyaku M.F., Higgins T.J., Umar M.L., Murdock S.M., Obokoh M., Huesing J.E., Field evaluation of some transgenic Maruca resistant Bt cowpea for agronomic traits under confinement in Zaria, Nigeria, 2010.
3. Olorunfemi B.J, Adejuyigbe S.B, Ogbeide S.O, Adeyemi H.O., Adekunle A.A, Kayode S.E. Development of computer-aided management for grain storage in Nigeria, Journal of Multidisciplinary Engineering Science and Technology, 2018, 5 (10).
4. Boukar O., Massawe F., Muranaka S., Franco J., Maziya-Dixon B., and Fatokun C., Evaluation of cowpea germplasm lines for minerals and protein in grains, 2010.
5. Ogundele G.F., Ojubanire B.A., and Bamidele O.P., Proximate composition and organoleptic evaluation of cowpea (Phaseolus vulgaris) and soybean (Gglycine max) blends for the Production of Moi-moi and Ekuru (steamed cowpea paste), J. of Exp. Bio. and Agric. Sc., 2015, 3 (2), p. 207-212.
6. Gupta R.K., Das S.K., Physical properties of sunflower seeds, J. Agric. Eng. Pes., 1997, 66, p. 1-8.
7. Karabab E., Physical properties of popcorn kernels, J. Food Eng., 2006, 54, p. 100-107.
8. Mateos-Aparicio I., Redondo Cuenca A., Villanueva-Suarez M.J. and Zapata-Revilla M.A., Soybean, a promising health source, Nutricion Hospitalaria, 2008, 23, p. 305-312.
9. Chandrasekar V. and Viswanathan R., Physical and thermal properties of coffee, Journal of Agricultural Engineering Research, 1999, 73, p. 227-234.
10. Teguia A., Chakam V.P., and Tchoumboue J., Effect sets de la cuisson ou de l’extrusion du niébé (Vigna unguiculata) nsur les performances de production des poulets de chair en finition, Bull. Anim Prod. Afr., 2007, 55, p. 118-126.
11. Defang H.F., Teguia A., Awah-Ndukum J., Kenfack A. and Ngoula F., Performance and carcass characteristics of broilers fed boiled cowpea (Vigna unguiculata Wal) and or black common bean (Phaseolus vulgaris) meal diets, Afr. J. Biotechnol.,2008, 7, p. 1351-1356.
12. Chakam V.P., Teguia A., Tchoumboue J., Performance of finisher broiler chicks as affected by graded levels of cooked cowpeas (Vigna unguiculata) in the grower-finisher diet, Bull. Anim. Prod. Afr., 2008, 56, p. 251-258.
13. Shi S.R., Lu J., Tong H.B., Zou J.M. and Wang K.H., Effects of graded replacement of soybean meal by sunflower seed meal in laying hen diets on hen performance, egg quality, egg fatty acid composition, and cholesterol content, J. of App. Poultry Research, 2012, 21, p. 367-374.
14. Ameen O.M., Fatope O.M., Usman L.A. and Adebayo S.A., Bioactive metabolites in improved cowpea seeds, African Journal of Biotechnology, 2005, 4, p. 513-516.
15. Frazer B.M., Verma S.S., and Muir W.E., Some physical properties of Fababeans, Journal of Agricultural Engineering Research, 1976, p. 23.
16. Fageria N.K., Baligar V.C., Jones C.A., Common bean and cowpea, growth and minerals nutrition of field crops, 7, p. 281-381.
17. Singh B.B., and Awika J., Breeding high yielding cowpea varieties with enhanced nutritional and health traits, https://iyp2016.org/resources/documents/related-documents/75-breeding-cowpea-for-quality-b-b-singh/file.(Accessed, July 2018).
18. Mamman E., Umar B., and Aviara N., Effect of moisture content and Loading orientation on the Mechanical Properties of nut, Agricultural Engineering International: The CIGRE Journal. Manuscript FB 04 015, 2005.
19. Dutta S.K., Nema U.K. and Bharadway R.K.., Physical properties of grains, Journal of Agricultural Engineering Research, 1999.
20. Mohsenin N.N., Physical properties of plant and animal materials (2nded. Revised), New York, Gordon and Breach Science Publishers, 1986.
21. Day C.L., Device for measuring void in porous material, Agric. Eng., 1994, 45, p. 36-38.
22. Herderson J.D., Perry K., Determining static coefficient of friction and angle of repose of grain on structure surface, Transaction of the ASAE, 1976.
23. Barley E.A., Physical properties of millet, Journal of Food Engineering, 2002, 51, p. 39–46.
24. Singh K.K., Goswani T.K., Physical properties of cumin seeds, J. of Agric. Eng. Research, 1996, 64 (2), p. 93-98.