Engineering, Environment
Consumption patterns of public water supply using linear programming techniques
Ibrahim ABDULLAHI 1, Ismail ABUBAKAR 2, Iyadunni Ndububa OLUFUNMILAYO 3, Lawal Batagarawa RABIA 4, Adebola Ajibike MAARUF 5 and Tsoho USMAN 6
1,4,6 Department of civil Engineering Nigerian Defence Academy, Kaduna State, Nigeria
3 Department of Civil Engineering Federal University Oye-Ekiti, Ekiti State, Nigeria
2, 5 Departments of Water and Environmental Engineering Ahmadu Bello University Zaria, Kaduna State, Nigeria
Emails: 1 aibrahim@nda.edu.ng,2 abuismail1@yahoo.com, 4 OINdubaba@yahoo.com,
4 kilishir@yahoo.com, 5 idowu_ajibike@yahoo.com,6 udtsoho@yahoo.com
Corresponding author phone: +2348026906930. +23407062407917
Received: February 05, 2018 / Accepted: December 19, 2018 / Published: December 30, 2018
Abstract
This report presents the outcome of a survey of water use pattern in Kaduna metropolis, Kaduna State Nigeria. The water use pattern study extends to various water consumers such as residential, institutional, commercial and industrial.
The study was conducted by distribution of questionnaires and oral interview. The questionnaires contain questions related to water demand and uses. The research work presents the outcome of a linear Programming Techniques Model and sampling techniques of water use pattern carried out. The study was conducted by the application of linear Programming Approach and sampling techniques. The sampling technique contains questions related to water demand and uses. The information obtained were analysed and the result show that the residential water consumption varies from 46l/c/d to 115l/c/d with lower values for high and medium density areas, while higher value is for low density areas because of high standard of living. The daily values for commercial, industries and Public facilities sampled within the metropolis were; 29,915.854, 366,666.666 and 29, 308.804 litres respectively. A Water consumption model was developed using Linear programming modelling technique to the allocation of 176,360,000 L of water produced daily by the State Water Corporation and supplied to the four sectors of the town. The result shows that the model gave an optimal solution of 275, 170, 410 L to the four sectors with an allocation of 150,441,410 L to residential sector, 101,325,000 L to commercial sector, 223,040,000 L to public sector and 1,100,000L to industrial sector. It is concluded that the water supply by the Water cooperation is less than the water demanded.
Keywords
Allocation; Management; Linear programming; Sector; Utilized
Introduction
Water consumption varies from one area to another depending on socioeconomic standard of the people, the level of education and development, nature of prevailing climate, the hygienic characteristics of the people, level of provision of sanitation facilities and general sanitary habits of the people [1]. However, it generally agreed that a minimum of 50 l/c/d is needed by an individual to satisfy his basic need irrespective of socio-cultural background [2].
Kaduna metropolis, like many other cities in Nigeria does not have accurate water demand figures that could be used for the design and improvement of the water supply system.
For effective service delivery, many studies have been carried out in the area of water demand management in developing countries. In a study conducted by [3] in Ilorin, Nigeria, the basic per capita consumption for planned residential areas was found to be 89 litres per day. This demand is however suppressed because of intermittent pumping [4]. [3] Proposed a probable minimum demand of between 92 to 96 litters per capita per day depending on the 9 litters or 10 litters capacity water flush toilets.
This survey and evaluation study on water use pattern in Kaduna metropolis is to establish water consumption rates for the residential, institutional, commercial and industrial consumers. The results will be useful for the purpose of upgrading the water supply scheme, planning expansion of water treatment plant, design of pumping stations, and the design of storage and distribution system for Kaduna metropolis.
The purpose of this research work is too carried out the surveyed of the water consumption pattern for both Residential, Public, Commercial and Industrial sectors in Kaduna metropolis using random sampling techniques and Questionnaire method. From the method adopted in the research, the consumption pattern of residential water in Kaduna metropolis indicated that residential water use in low density areas ranged between 70.25l/c/d to 115.22l/c/d with an average value of 92.74l/c/d. The residential water use for medium density areas ranged from 55.50l/c/d to 66.94l/c/d, with an average of 61.22l/c/d. Also the residential water use in high density areas was between 46.07l/c/d and 96.37l/c/d with an average value of 71.22l/c/d. The differences that exist in the water use rates among the study areas are as result of variation in socio economic level, standard of living, age of community, population, availability of water and level of sanitation awareness. The daily consumption pattern for all commercial, industrial and institutional facilities sampled within the metropolis were 29,915.854, 366,666.6 and 29,308.804 litters respectively.
Material and method
Study area
The map of Kaduna metropolis is obtained indicating the various areas of study. Kaduna metropolis consists of four Local Government Areas (LGAs), namely: Kaduna North, Kaduna South, Igabi and Chukun which comprises the study area as showed in Figure 1 above and is situated at the centre of the northern Nigeria. It is cited on gently sloping ground on the west bank of River Kaduna, which serves as a good source of water [5]. It has a population of about 767,306 only for Kaduna North and South Local Government. While Igabi and Chukun Local Govt. Areas have a population of about 803,025.However there are some parts of these local governments which are not part of the metropolitan.
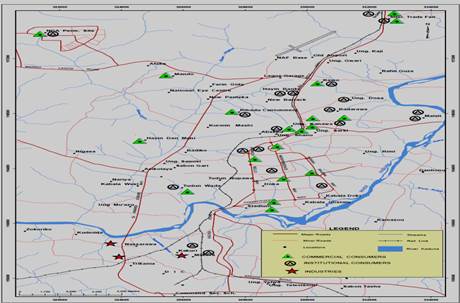
Figure 1. Map of Kaduna metropolis showing various areas of study
All the four Local Government Areas constitute a total sum of about 1,570,331including some few places in Igabi and Chukun Local Government Areas, but has now grown to 465,323 for Kaduna North, 514,023 for Kaduna South 549,789 for Igabi and 475,147 for Chukun making a total number of 2,004,282 by 2016 when the 2006figure was projected with 2.47% annual growth rate recommended in Software world for population growth (2003).
The water supply intake is situated at Malali village in Kaduna north where treatment plant was build. The first treatment plant (old plant) was established in 1972, while the second plant (new plant) was established in April 1987. The second plant was established to supplement the first plan; the old treatment works plant has a capacity of 90million litter per day while the new treatment works has a capacity of 150million litter per day.
The total capacity of the treatment works is 240 million litter per day. On average a total of about 180 million litter per day is expected to be pumped everyday out of which 85 percent is supplied per day, in addition to these two treatment plans another treatment plant is located in Kaduna South which has a capacity of 27million litter per day it was commissioned in 1927.All these three treatment plans (Kaduna North new water works, Kaduna North old water work and Kaduna South water works) has the production capacity of producing 105.64, 54.86 and 15.86million litter per day of treated water supply to the metropolis respectively, making total sum of 176.36million litter per day as the expected total production of treated water supply to the metropolis. Kangimi dam was also built to supplement the main Kaduna treatment plant which is located at about 30Km away from Kaduna city; it has a capacity of 58.5 mm3.Kaduna like other urban areas in the developing countries has a number of sectors. Four of such sector namely Residential, Commercial, Industrial and the Public institutions are prominent in Kaduna.
The residential structure of Kaduna show 48 wards with Kakuri/Makera being the largest ward followed by Rigasa, Nasarawa, Tudun-Wada, Doka respectively while, Janruwa being the least, in terms of population according to Kaduna State Census 91. Also there are well established commercial concerns; among them are Hotel establishments, car washing centres, laundry and dry cleaning services, mini and supermarkets, banks, etc.
The public institutions sector has Fire Fighting establishments, army and police barracks, public hospitals and schools among its prominent establishments and finally the industrial sector has a wide range of industries including the processing and the manufacturing ones. Two sampling techniques were utilized, namely the stratified and simple random sampling. For our stratified sampling, each sector was divided into strata in which every stratum was allocated.
Data collection
Primary data were, therefore, collected from Kaduna State Water Board, Kaduna Bottling Company and Kaduna Petrochemical Refinery Company (NNPC) for the four sectors and also field work were conducted while secondary data were obtained from Published materials. The determination of the water use pattern in Kaduna Metropolis would have been easier and perhaps more accurate if households and other consumers have rate-measuring meters. In the absence of meters, Questionnaires and verbal interview method was adopted to facilitate the estimation of water use in the city. The survey method involved drawing up a set of questions for the households in each of the study areas (low, medium and high density areas) and also for commercial institutional and industrial users. Similarly data on water consumption, number of total connection for the sectors was also obtained from Kaduna State Water Board for the purpose of the research. Population data was also collected from National Population Commission and Published materials.
Sampling method
Were one surveys every person or a whole set of units in a population you are taking a census. However, this method is often impracticable; as its often very costly in terms of time and money. For example, a survey that asks complicated questions may need to use trained interviewers to ensure questions are understood [13]. This may be too expensive if every person in the population is to be included. To overcome these problems, samples are taken from populations, and estimates made about the total population based on information derived from the sample. A sample must be large enough to give a good representation of the population, but small enough to be manageable.
Random sampling
In random sampling, all items have some chance of selection that can be calculated. Random sampling technique ensures that bias is not introduced regarding who is included in the survey [65]. Five common random sampling techniques are:
- simple random sampling,
- systematic sampling,
- stratified sampling,
- cluster sampling, and
- multi-stage sampling
Simple random Sample: With simple random sampling, each item in a population has an equal chance of inclusion in the sample [19]. Simple random sampling is the most widely-used probability sampling method, probably because it is easy to implement and easy to analyse.
Stratified Sample: A general problem with random sampling is that you could, by chance, miss out a particular group in the sample. However, if you form the population into groups, and sample from each group, you can make sure the sample is representative. In stratified sampling, the population is divided into groups called strata. A sample is then drawn from within these strata.
Linear programming technique
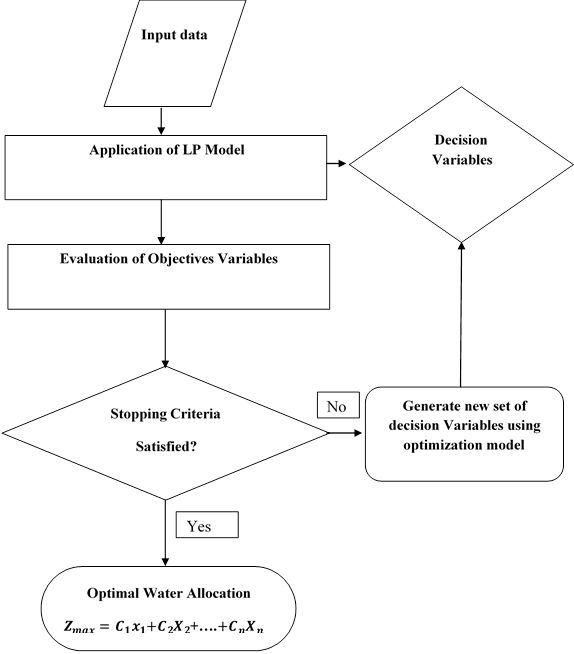
Figure 2. General framework of simulation optimization modelling approach
For water allocation in Kaduna metropolis
First, the given problem must be presented in linear programming form. This requires defining the variables of the problem, establishing inter-relationships between them and formulating the objective function and constraints as showed in figure 2 above for the General framework of simulation. A model, which approximates as closely as possible to the given problem, is then to be developed. If some constraints happen to be nonlinear, they are approximated to appropriate linear functions to fit the linear programming format. In case it is not possible, other techniques may be used to formulate and then solve the model [14].
To solve such L.P.P there are two methods:
1. The Big-m-method or method of penalties
2. The two-phase simplex method.
The formulation of linear programming problem as a mathematical model involves the following key steps [23].
Step 1: Identify the decision variables to be determined and express them in terms of algebraic symbols such as x1, x2, x3;
Step 2: Identify all the limitations in the given problem and then express them as linear equations or inequalities in terms of above defined decision variables.
Step 3: Identify the objective which is to be optimized (maximized or minimized) and express it as a linear function of the above defined decision variables.
Subject to the constraints we express Eq. [1],
![]() (1)
(1)
Where: ![]()
![]() (2)
(2)
![]() (3)
(3)
![]() (4)
(4)
Where: ![]() .
.
We can state the objective function as Eq. [5]:
![]() (5)
(5)
Where: Z - the maximum water to be allocated (in litters), x1, x2, x3, x4 - the various sector ie Residential sector, Commercial Sector, Public Institutions Sector and Industrial Sector.
Result and discussion
This survey and evaluation study on water use pattern in Kaduna is to establish water consumption rates for the residential, institutional, commercial and industrial consumers. The results will be useful for the purpose of upgrading the water supply scheme, planning expansion of water treatment plant, design of pumping stations, and the design of storage and distribution system for Kaduna metropolis. Similarly the data collected from water board on water supply to the sectors will be use to optimize the water allocation.
Analysis of residential water demand
The total volume of water used by all households divided by the total population gives the per capita water use.
The population of households affects total water use. The population distribution is shown in Table 1 for the various residential areas.
Table 1. Analysis of surveyed data distribution of residents in households
|
Number of people in household |
Number of households |
||
|
Low density area |
Medium density area |
High density area |
|
|
1-4 |
59 |
56 |
28 |
|
5-8 |
86 |
122 |
73 |
|
9-12 |
18 |
31 |
38 |
|
13-16 |
03 |
16 |
19 |
|
>16 |
00 |
24 |
15 |
122 households out of 281 sampled in medium density areas have the number of residents between 5 and 8. For the low density areas, most of the households have between 5 and 8 (i.e. about 50% of the total households sampled in this category).
None of the households in the low density residential areas have its number of occupants greater than 16.
Table 2 gives the detail analysis of the type of houses that exists in the study areas under each category. For the densely populated area, 47% of the people live in multi-tenant buildings popularly called face to face, 23% in story buildings, 20% in flats or apartments and 10% in bungalows.
Table 2. Analysis surveyed type of houses in the residential areas
|
Type of houses |
Low density area |
Medium density area |
High density area |
Total |
|
Flat |
80 |
69 |
32 |
181 |
|
Bungalow |
50 |
85 |
18 |
153 |
|
Storey Building |
36 |
30 |
43 |
109 |
|
Multi-tenant houses |
00 |
65 |
80 |
145 |
|
Total |
166 |
249 |
173 |
588 |
Bungalows type house were most common for medium populated areas, followed by flats, multi-tenant houses, and story buildings in that order. Most of residents do not depend on direct public supply (tap water alone), they also source for water from combination of wells and boreholes.
Table 3 shows that in the low and medium density areas, more households depend on a combination of taps and borehole, while in the high density areas, residents depend on a combination of taps and wells.
Table 3. Analysis surveyed of sources of water supply to the residential areas
|
Source of water |
Number of households indicating various sources of water |
||
|
Low density area |
Medium density area |
High density area |
|
|
Only Tap |
25 |
55 |
30 |
|
Only Well |
05 |
35 |
14 |
|
Only Borehole |
19 |
15 |
12 |
|
Tap and Well |
49 |
34 |
45 |
|
Tap and Borehole |
58 |
75 |
16 |
|
Well and Borehole |
04 |
30 |
29 |
|
Borehole, Well and Tap |
06 |
05 |
27 |
Analysis of commercial, institutional and industrial water demand
The daily values for all commercial, industrial and institutional facilities sampled within the metropolis were 29,915.854, 366,666.6 and 29,308.804 litres respectively.
Tables 4 to 6 show the summary of all the commercial, institutional and industrial consumers surveyed respectively.
Table 4. Analysis of surveyed commercial consumers
|
Type of Establishment |
No |
% |
|
Retail Shops |
20 |
14.18 |
|
Hotels |
12 |
8.51 |
|
Canteens |
25 |
17.73 |
|
Slaughter Slabs |
10 |
7.09 |
|
Abattoir |
14 |
9.93 |
|
Car Wash |
30 |
21.28 |
|
Dry Cleaners |
10 |
7.09 |
|
Hair Dressing Saloons |
08 |
5.67 |
|
Others |
12 |
8.57 |
|
Total |
141 |
100 |
Table 5. Result of surveyed of institutional consumers
|
Type of Establishment |
No |
% |
|
Banks |
8 |
8.51 |
|
Clinics |
10 |
10.64 |
|
Hospitals |
10 |
10.64 |
|
Nursery and Primary Schools |
25 |
26.60 |
|
Secondary Schools |
20 |
21.28 |
|
Post-Secondary Schools |
3 |
3.19 |
|
Government Ministry / Parastatals |
10 |
10.64 |
|
Fire services |
4 |
4.25 |
|
Barracks |
1 |
1.06 |
|
Others |
3 |
3.19 |
|
Total |
94 |
100 |
Table 6. Analysis of surveyed of industrial consumers
|
Type of Establishment |
No |
% |
|
Block Making |
50 |
44.64 |
|
Bakery |
20 |
17.86 |
|
Pure Water Factories |
35 |
31.25 |
|
Others |
07 |
06.25 |
|
Total |
112 |
100.00 |
Car wash has the highest number followed by the food canteens as commercial users. Other types of establishment include business centres, petrol filling stations, video clubs, etc. Out of 94 institutional consumers sampled, nursery and primary schools have the largest number and closely followed by secondary schools. Banks, ministries and parastatal have the least number. A total number of 112 industrial consumers were surveyed consisting mostly of block making industries, pure water, and bakery. Others include bottling company, NNPC, IBB, Yoghurts Production, etc.
Analysis of population forecast
In the analysis of this research work only one method of the four method of population forecast I the methodology was applied in order to forecast the future population of Kaduna metropolis which is known as geometric increase method the most popularly used method of future population forecast and the method is describe below while Table 7 is the result of the forecast from 2006 to 2018:
Table 7. Census population of 2006 and projected population forecast to 2016 ofKaduna State
|
S/No |
L.G.A |
Senatorial District |
2006 Population |
2016 Population |
2018 Population |
||
|
Male |
Female |
Both Sexes |
|||||
|
1 |
Chikun |
B |
187,433 |
184,839 |
372,272 |
475,147 |
498,908.849 |
|
2 |
Igabi |
B |
217,414 |
213,339 |
430,753 |
549,789 |
577,283.5009 |
|
3 |
Kaduna North |
B |
187,075 |
177,500 |
364,575 |
465,323 |
488,593.5381 |
|
4 |
Kaduna South |
B |
204,969 |
197,762 |
402,731 |
514,023 |
539,729.1756 |
Source: Field work (2016)
The method of estimation can be in the following method:
1. Arithmetic increase method
2. Geometric increase method
3. Method of varying increment or incremental increase
Arithmetic increase method: This method is based upon the assumption that the population increases at a constant rate i.e. the rate of change of population with time i,e (dp/dt) is constant. Thus Eq. [6] or [7]:
![]() =k (6)
=k (6)
![]() (7)
(7)
By integration of Eq.(6-7) then it becomes Eq. [8]:
![]() =k (
=k (![]() (8)
(8)
Where: suffixes 1 and 2 represent the last and the first decade or census, respectively. Thus t2-t1 - no. of decade.
The general form of arithmetic increase is given by Eq. [9]:
![]() ={
={![]() +
+![]() (9)
(9)
Where: pn - prospective or forecasted population after n decades from the present (i.e. last known census), po - population at present (i.e. last known census), n - no, of decade between now and future,µ - average (arithmetic mean) of population increase in the known decade.
Geometric increase method: In this method, the per decade percentage increase or percentage growth rate (r) is assumed to be constant, and the increase is compounded over the existing population every decade. This method is therefore also known as uniform increase method. The difference between arithmetic and geometric method is that in geometric there is compounding in every decade while in arithmetic there is no compounding. Hence geometric increase is given by Eq. [10]:
![]() =
=![]() (10)
(10)
Thus equation (9) can simplify as Eq. (11):
pn= po(1+r/100) (11)
Where: r - is in percentage, pn - population after 2 decade for successive decade.
Similarly Eq. [12] can be simply to give Eq. [12]:
pn= po(1+r/100)n (12)
Where: po - initial population, ie - the population at the end of last known census, pn- future population after a decades, r - assume geometric rate (%).
Method of varying increment or incremental increase: In this method, the per decade growth rate is not assume to be constant as in the arithmetic or geometric progression methods: but is progressively increasing or decreasing, depending upon whether the average of the incremental increases.
The population for a future decade is worked out by adding the mean arithmetic increase (say µ) to the last known population as in arithmetic increase method and to this is added the average of the incremental increases ỷ, once for the first decade, twice for the second decade, thrice for the third decade, and so on. Incremental increase is given by Eq. [13]:
![]() ={
={![]() +
+![]() +n
+n![]() (13)
(13)
Where: pn - population after n decade from present (i.e. last known decade), µ - average increase of population of known decade, average of incremental increase of the known decade.
From the method of population forecast described above one of the method will be used in order to forecast the population of the residential, commercial public and industrial consumption of the study area. In this case I applied (Geometric increase method).
The formula is given as Eq. [14]:
pn= po(1+r/100)n (14)
Where: po - initial population, either population at the end of last known census, pn - future population after a decades, r - assume geometric rate(%) and r = 2.47(%) according to the growth rate.
The table above (Table7) is the population forecast of the four local governments in Kaduna Metropolis using the population census of 2006 given by the National Population census. The population was projected to 2016 and later on projected to current year which is 2018 as indicated in Table7 (see Appendix).
Table 8 and Figure 3 shows the result of total water supply, total water demand, deficiency and % deficiency for the four sectors. In each of the sector the total water demand, total water supply, deficiency and % deficiency are represented in blue, red green and grey colours respectively.
Table 8. Total daily water demand and supply for the four sectors of Kaduna Metropolis area
|
Sector |
Total water demand (L) |
Total water supply (L) |
Deficiency |
% Deficiency |
|
Residential |
158,398,518l |
69,125,133 |
89,273,385 |
77.43 |
|
Commercial |
101,325,000 |
3,377,500 |
97,947,500 |
96.67 |
|
Public Institution |
22,304,000 |
743,466 |
21,560,534 |
96.67 |
|
Industrial |
1,100,000 |
366,667 |
733,333 |
66.67 |
Source: Field work (2016)
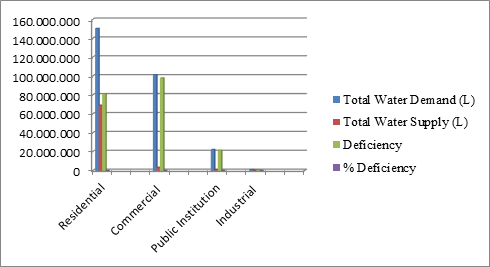
Figure 3. Total daily water demand, supply, deficiency and % deficiency for the four
Sectors of Kaduna metropolis area
In each of the sectors there is a combination of four colours representing the comparison between total water demand, total water supply, deficiency and % deficiency. The result shows that the % deficiency is high for commercial, public, while that of industries is lower compared to residential sectors indicating that those areas relies more with their personal source of water supply than that of the public source. It is very clear from the figure that the demand is higher than the supply for both commercial, public and industrial sectors.
Table 9 and Figure 4 above is the comparison between model allocation and the water supply in the four sectors of the metropolis.
Table 9. Comparison between model allocation and Water supply to the sectors
|
Sectors |
Water supply by the water corporation (L) |
Model allocation to sectors (L) |
|
Residential |
69,125,133 |
158,398,518 |
|
Commercial |
3,377,500 |
101,325,000 |
|
Public Institution |
743,466 |
22,304,000 |
|
Industrial |
366,667 |
1,100,000 |
Source: Field work (2016)
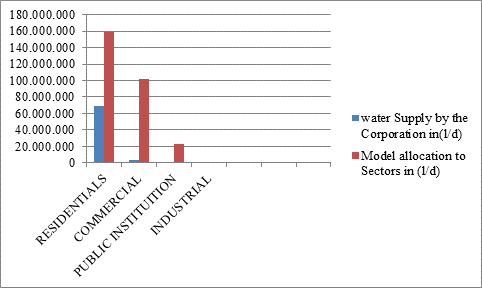
Figure 4. Comparison between model allocation and water supply to the sectors
The blue colour of the bar chart is the water supply by the water board while the maroon colour is the bar chart of the water supply by the model allocation In all of the four sectors water supply is lower than the model allocation this indicated that there is a short of water for all the sectors.
Table 10 above is the optimal allocation of Water Supply for the four Sectors of Kaduna Metropolis Area.
Table 10. Optimal allocation of water supply to the sectors
|
Total quantity supply(L) |
Sectors; Total quantity allocated |
||||
|
Residential x1 (L) |
Commercial x2 (L) |
Public x3 (L) |
Industrial x4 (L) |
Total |
|
|
176,360,000 |
158,398,518l |
101,325,000 |
22,304,000 |
1,100,000 |
283,127,518l/d |
Source: Field work (2016)
The Table 10 represented the total quantity supply by the Water Board, the optimal allocation obtained by the model for the residential, commercial, public institutions and industrial sectors and the total optimal water allocated to the four sectors respectively, the table indicated that the total optimal water allocated is higher than the water supply by the Water Board to the sectors.
Conclusion
From our analysis, there is a clear difference in the quantity of water being allocated to the sectors by the State Water Corporation is inadequate because the Optimal Water allocated by the model for the four sectors is 283,127,518 l/d while the Water board supply 176,360,000 l/d and only 73,612,760 l/d is allocated. This indicated that there is a deficiency of 106,767,518 l/d of water supply compare with the total water produced by the board. There is a need for the Water Corporation to enhance their supply so as to meet the optimal allocation of the supply. The basic lesson learnt from this research is that: The prevailing allocation method by the State Water Corporation is inefficient to the extent that water is undersupplied to the sectors. This calls to question the water supply criteria being used by the Water Corporation. Since Kaduna metropolitan town has the same social-economic character of other Nigerian towns and to a great extent with urban areas in developing countries, any plan dealing with the allocation of public water supply to the urban sectors within these regions should be based on the Criteria specified by this model. Thus the allocation of water with this model technique assures of optimal supply of water to strategic consumers on the satisfaction of the prevalent constraints. The implication of this research which can be applied internationally is that water is a scarce resource in most urban areas especially in developing countries. The reoccurring water supply shortages relative to demand have been a source of worry to many public water supply managers in these urban areas. The situation as presently experienced is that water which is manufactured at a very great financial cost is often undersupplied to the sectors. This calls the attention of managing the little resources available by making law enforcement for water abuses.
Acknowledgement
The successful completion of this research work would not have been possible without the help and assistance of various people either directly or indirectly. It is therefore necessary for me to express my profound gratitude to those who have contributed to the success of this research work in one way or the other. My sincere thanks to my supervisor Professor Abubakar Ismail and Dean of Postgraduate School Professor AO Ahmad for his contribution toward the success of this research work, I also extent my sincere gratitude to Professor Idris Abubakar of ABU Zaria now the Executive Director Engineering services of Nigerian Port Authority, towards his immeasurable and valuable constructive criticism to this work, I am also indebted to extend my gratitude to Ustaz Aminu Saminu Ibrahim for assisting me in collection of data and also in the analyses of the result. Whom I learn more from him in computer Technology and Ustaaz Abdulmajid of the DICT NDA, Kadunaat last my appreciation goes to Dr. Nasiru Abdullahi Math Department for whose contribution to the analysis of my result is immeasurable.
Appendix
The algebraic expression is written as follows:
5x1 + 8x2 + 8x3 + 14x4 ≤ 35
19x1 + 19x2 + 19x3 + 24x4 ≤ 81
588x1 + 141x2 + 94x3 + 112x4 ≤ 935
23x1 + 23x2 + 23x3 + 3x4 ≤ 72
2x1 + 2x2 + 2x3 + 6x4 ≤ 12
110x1 + 110x2 + 110x3 + 120x4 ≤ 460
5x1 + 5x2 + 5x3 + 1x4 ≤ 16
To calculate the demand for the sectors we use the formula as follows:
Customers water demand Qn = Pn x qd.
Where: Qn- recorded average daily consumption at year n; Pn - population at year n; qd- computed per capita daily demand at year n.
Residential Sector = 75.06 l/d = 158,398.518 l/d x 0.07506 m3/d = 158,398.518 m3/d
Commercial Sector = 29,915.854 l/d = 3,387 x 29.916 m3/d = 101,325 m3/d
Public Institutions Sector = 29,308.804 l/d = 761x29.309 m3/d = 22,304 m3/d
Industrial Sector = 366,666.666 l/d = 3 x 366.667 m3/d = 1,100 m3/d
Kaduna metropolis optimal water supply=283,127,518l/d =283,127.518 m3/d.
The allocation of various sectors in the metropolis are:
Residential sectors =158,398,518l/d =158,398.518 m3/d.
Commercial sectors =101,325,000l/d =101,325 m3/d.
Public sectors = 22,304,000l/d =22,304 m3/d.
Industrial sectors =1,100,000l/d = 1,100 m3/d.
References
1. Odubu M.O., Ikin F.A., Urban water supply in the 21st Century Africa in Donkor, DO(ed) African regional development in the 21st Century, Pal Publishers Accra Ghana, 2008.
2. Bello N.B. and Abdullahi I.K., Water supply situation in Kano metropolitan prospect and challenge, International Journal of Research in Earth and Environmental Science@2013-2014 IJREES &K.A.J All right revised version, 2014.
3. Sule B.F., Ayanshola A.M. and Salami A.W., Water consumption patterns in Ilorin, Kwara State, Nigeria, 2nd Annual Civil Engineering Conference, University of Ilorin, Nigeria, 2010.
4. Emma E., Raymond N.C., Anya D. and Nnaemeke I., Optimal allocation of public water supply to the urban sectors of Enugu Nigeria, A linear programming approach, Appl Water Sci(2014)/4:73-78 DO1 10.1007/s 13201- 013-0131-0, 2013.
5. Ajibike M.A., Evaluating performance of a water utilities using Kaduna as a case study, PhD Thesis ABU Zaria. Submitted to the School of Postgraduate ABU Zaria, 2012.
6. National Population Commission Gazette report 2007, http://www.population.gov.ng/
7. Ajibade L.T. and Okwori A., Developing of an information system for rural water supply scheme in Kaduna State Nigeria, Journal of Environmental Science (JES), Dept. of Geography FUT Mina, 2009.
8. Igwe K.C., Onyenweaku C.K. and Tanko L.,A linear programming approach to combination of crop managestic farm animal and fish enterprises in Ohafia agricultural zone Abia State Nigeria, Global Journal of Science Frontier Research Agriculture and Veterinary Science, 2013, 13 (3), 2013.
9. Wu Y.M., Application of linear programming, a case study land devotion stud, 1989, 6(3), p. 201-206
10. Oyebanji M.O., Ogunlowo A.S., Application of linear programming technique in bakery: A case study of Omo-Oroki bakery, unpublished M.sc Dissertation Federal University of Technology Akure, 1989.
11. Mokebe K.D.,Joubert J.W., Application of linear programming models to optimize pulp stock production process, Tappsa J., 2013, 1, p. 20-26.
12. http//www.iwawater wiki.org/xwiki/bin/view/Article/water quality 2009.
13. Lawrence O.E., Mathematical application of simplex numerical method in the allocation of water in Aboine river basin of Nigeria, European International Journal of Science and Technology,2013, 2 (5).
14. Lawrence O.E., Development of model equation for the allocation of water resources in Anambra Imo river basin development authority of Nigeria, European International Journal of Science and Technology,2014, 1 (5).
15. Operational research, National open University of Nigeria,http://www.nou.edu.ng/uploads/NOUN_OCL/pdf/SST/CIT%2520756.pdf
16. Arunkumar M. and Mariappan V.E., Water demand analysis of municipal water supply using EPANET software, International Journal on Applied Bioengineering, 2011, 5 (1).
17. Konstantin P.G., Water supply and demand sensitivities of linear programming solutions to a water allocation problem, Applied Mathematics, 2012, 3, p. 1285-1297Http://dx.doi.org/10.4236/am.2012.330185 Published Online October 2012 (http://www.SciRP.org/journal/am)
18. Akpor O.B. and Muchie M., Challenges in meeting the MDGs: The Nigerian drinking water supply and distribution sector, Journal of Environmental Science, 2011.
19. Linear programming. https://www.c.sprioceton.edu/-rs/AlgsDSo/22
20. Bonnie G.C., Estimating the value of water in alternative uses natural, Resources journal, 29. http//larschoolunm.edu/ng/.10/4me29/2/10_colby_estimating.pdf.
21. Surender K., Analysing industrial water demand in India: A distance function approach, surender@nipfp.org.in.
22. Ayanshola A.M., Sule B.F., and Salami A.W., Modelling of residential water demand at household level in Ilorin, Nigeria, Journal of Research Information in Civil Engineering, 2010, 7 (1).
23. Muhammad Y.A., Application of linear programming on cost-minimization of poultry-feeds (a case study of Adiya poultry farm in Sokoto state), A dissertation submitted to the Postgraduate School, UsmanuDanfodiyo University, Sokoto, Nigeria, 2011, in partial fulfilment of the requirements for the award of the degree of Master of Science (Mathematics).
24. Moses N., Optimal production of portable water: A case study AgonoSwedru-Ghana Water Company limited, A thesis submitted to the Institute of Distance Learning to the Department of Mathematics, Kwame Nkrumah University of Science and Technology In partial fulfilment of the Requirement for the degree of Master of Science Industrial Mathematics, 2011.
25. Yao L., Analysis of urban water use and urban consumptive water use in Nebraska-a case study in the city of Lincoln, Grand Island and Sidney. Digital Communication @University of Nebraska-Lincoln, 2013.
26. Ingeduld P. and Zdeneksvitak I., Modelling intermittent water supply System with Epanet, 8thannual WD Symposium, EPA Cincinnal, 2006.
27. Shandas I.V., Alberti M., Gibson J., Moddemeye S., Meijer J. and Irons, a GIS based water demand analysis for municipal application, Map India Conference, 2003, © GISdevelopment.net, All rights reserved.
27. Cooks Z., Urban S., Maupin M.P. and John K., Domestic, commercial, municipal and industrial water demand assessmentand forecast in Ada and canyon countries, Idaho, 2001. https://www.idwr.idaho.gov/waterboardPlanning/PDFs/DCMI._Reportpdf.